Actionable Alerts
Atatus AI Alerting lets you stay ahead of potential issues. Our intelligent alerts notify you instantly of unexpected problems and provide early warnings when things start to go wrong. Actively monitor your systems in real-time, and address problems before they escalate.
Leverage Diverse Alert Types for Comprehensive Monitoring
- Receive notifications when your metrics exceed defined thresholds.
- Customize alerting with static thresholds and dynamic baselines. Use static alerts for fixed thresholds and dynamic alerts to adapt to changing baselines.
- Combine multiple metrics and conditions into a single alert for a comprehensive view of your system's health.
- Monitor both CPU usage and memory consumption together to prevent system overloads.
Tap Into Multiple Alert Sources for Enhanced Flexibility
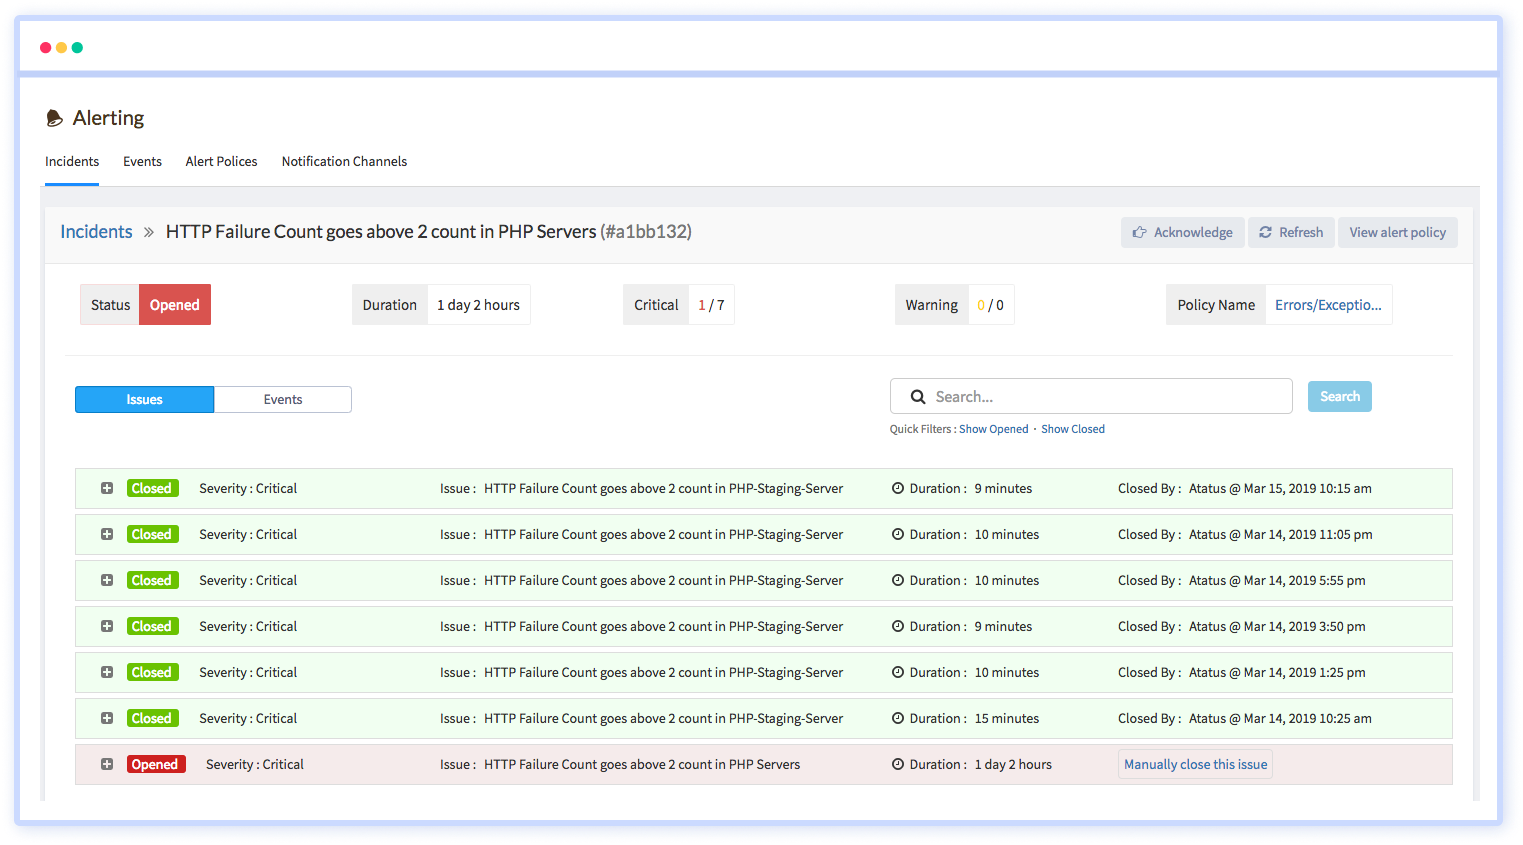
- Monitor your web applications for performance issues like slow page load times, high error rates, and AJAX callback delays.
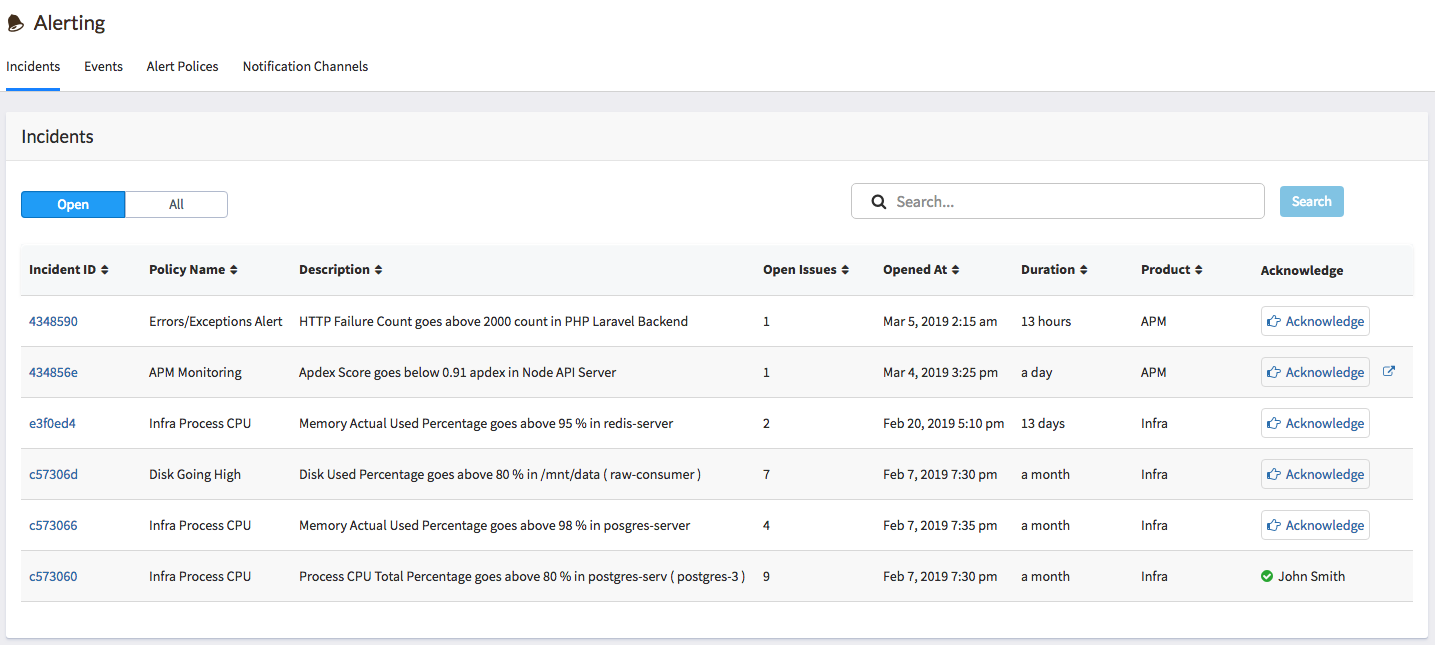
- Track your server infrastructure with alerts on CPU, memory, and disk usage. Receive instant notifications when system resources face pressure, helping you prevent potential outages.
- Keep an eye on database performance with alerts on query execution times, throughput, and error rates.
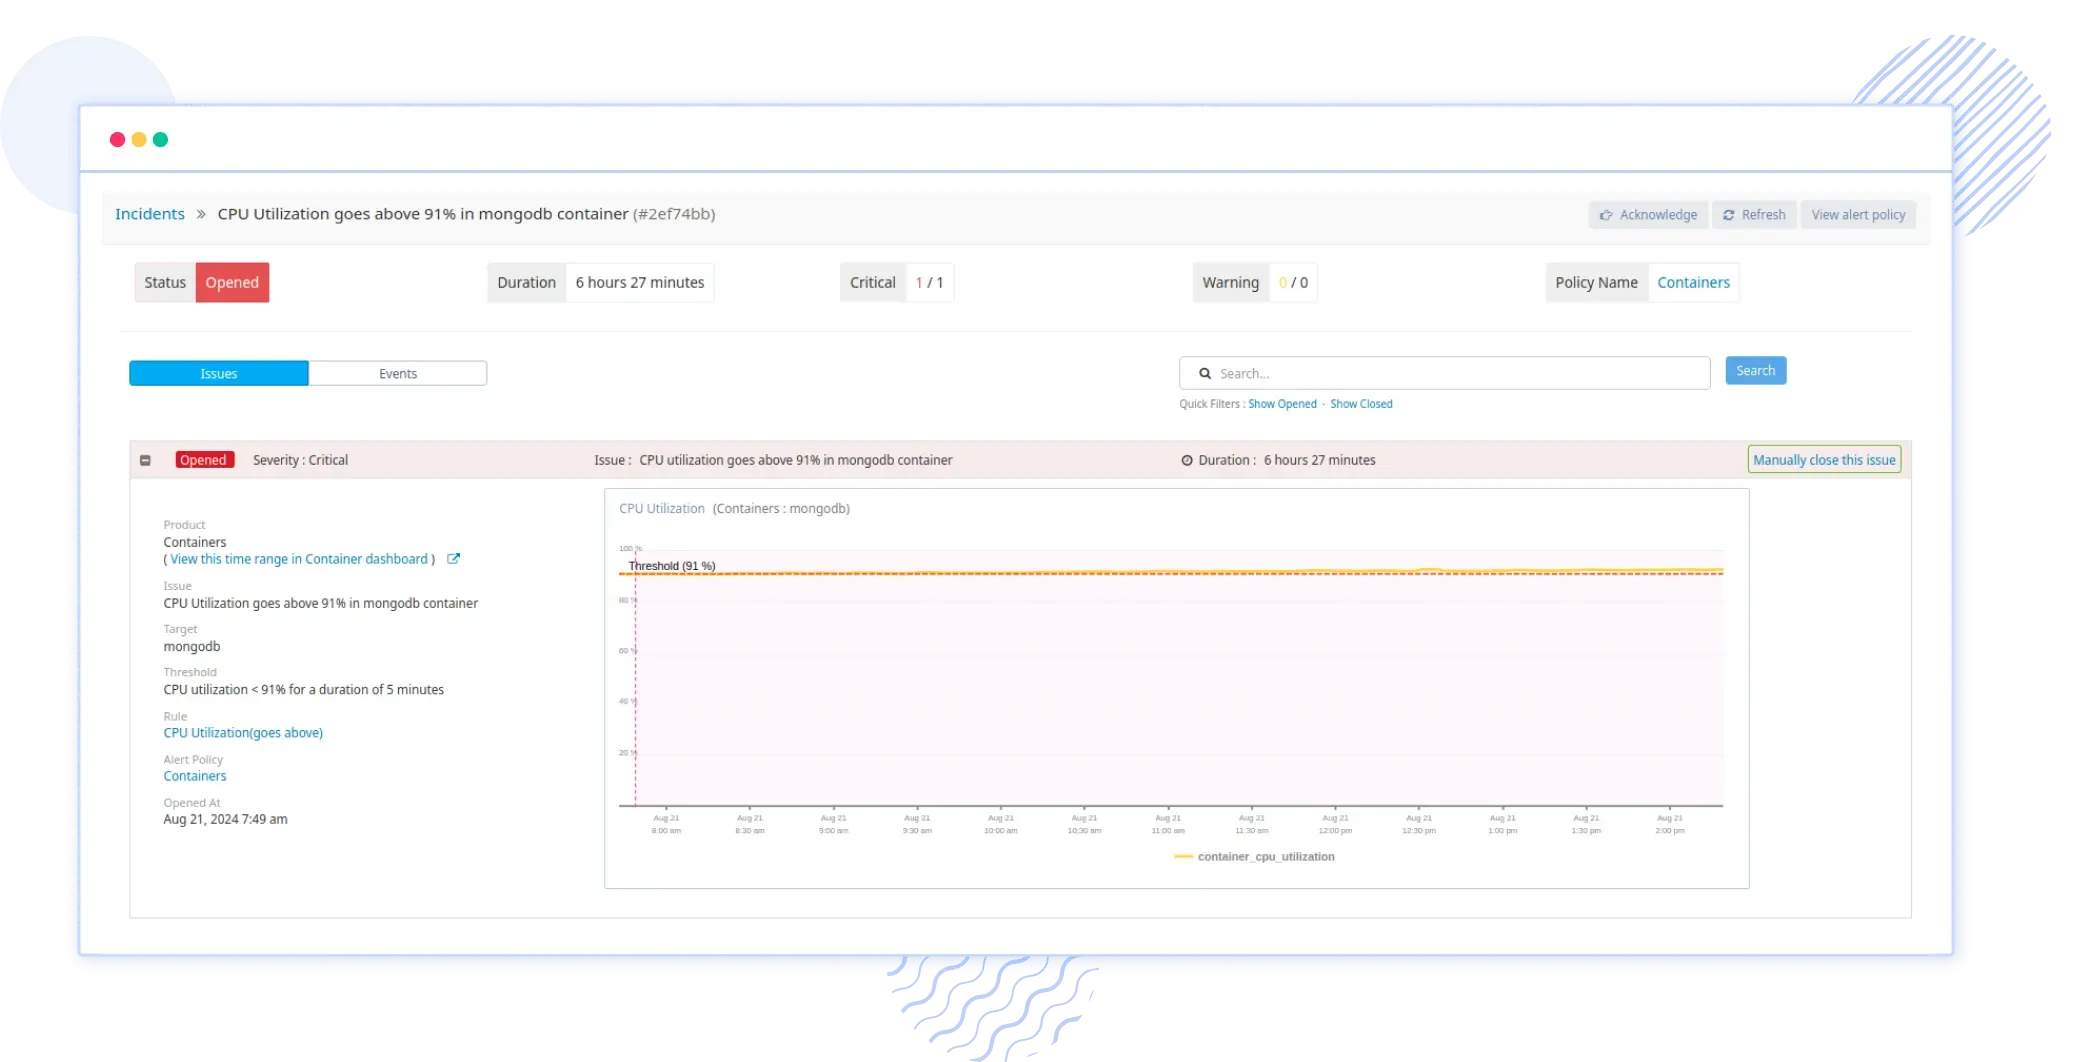
- Maintain the health of your containerized environments with alerts on replica status, resource usage, and more.
Customize Alert Metrics and Notification Channels
- Choose from a wide range of metrics to set up your alerts, including response times, error rates, throughput, and more. Focus on the most critical aspects of your application.
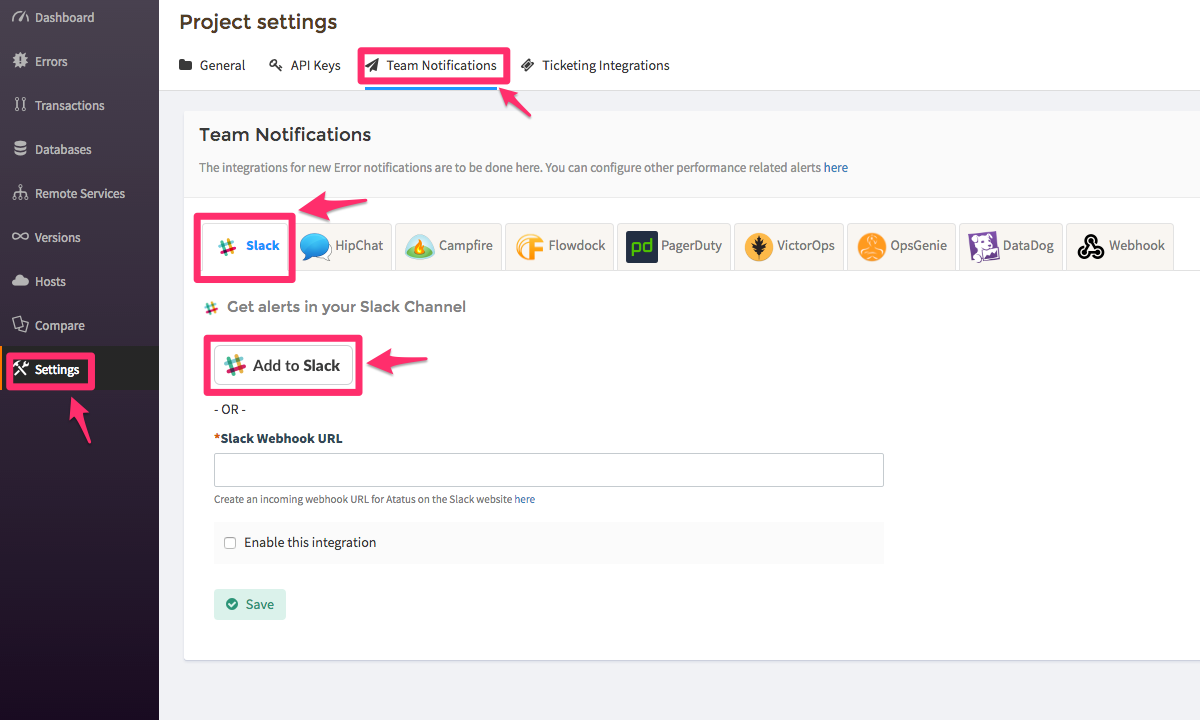
- Integrate with popular notification platforms like Slack, Asana, PagerDuty, and JIRA. Receive alerts directly in your preferred communication channels for quick and efficient incident response.
- Set up alerts for real-time notifications or batch summaries, depending on your operational needs.
- Stay informed about critical issues instantly or receive periodic updates to manage alert fatigue.


 +1-760-465-2330


