API Logs Monitoring
Track and analyze API logs to gain a deeper understanding of how APIs are being used. With our organized event-focused API metrics and super-fast search system, view live insights into your API failures, response and request payloads, regardless of whether you're working on REST, GraphQL, or decentralized APIs.
Common Challenges You Face
Real problems experienced by teams like yours every day
Finding API Errors in Millions of Logs
"We have millions of API log entries per day. Finding the specific error that caused a customer issue is like finding a needle in a haystack."
No Context Around API Failures
"Logs show an API error occurred, but we don't know which user, what request payload, or what state the system was in."
Can't Correlate Logs Across Services
"Request flows through 5 microservices. Logs are scattered across systems with no way to connect them to the same transaction."
Log Storage Costs Exploding
"We're spending thousands per month on log storage, but 95% of logs are never read or analyzed."
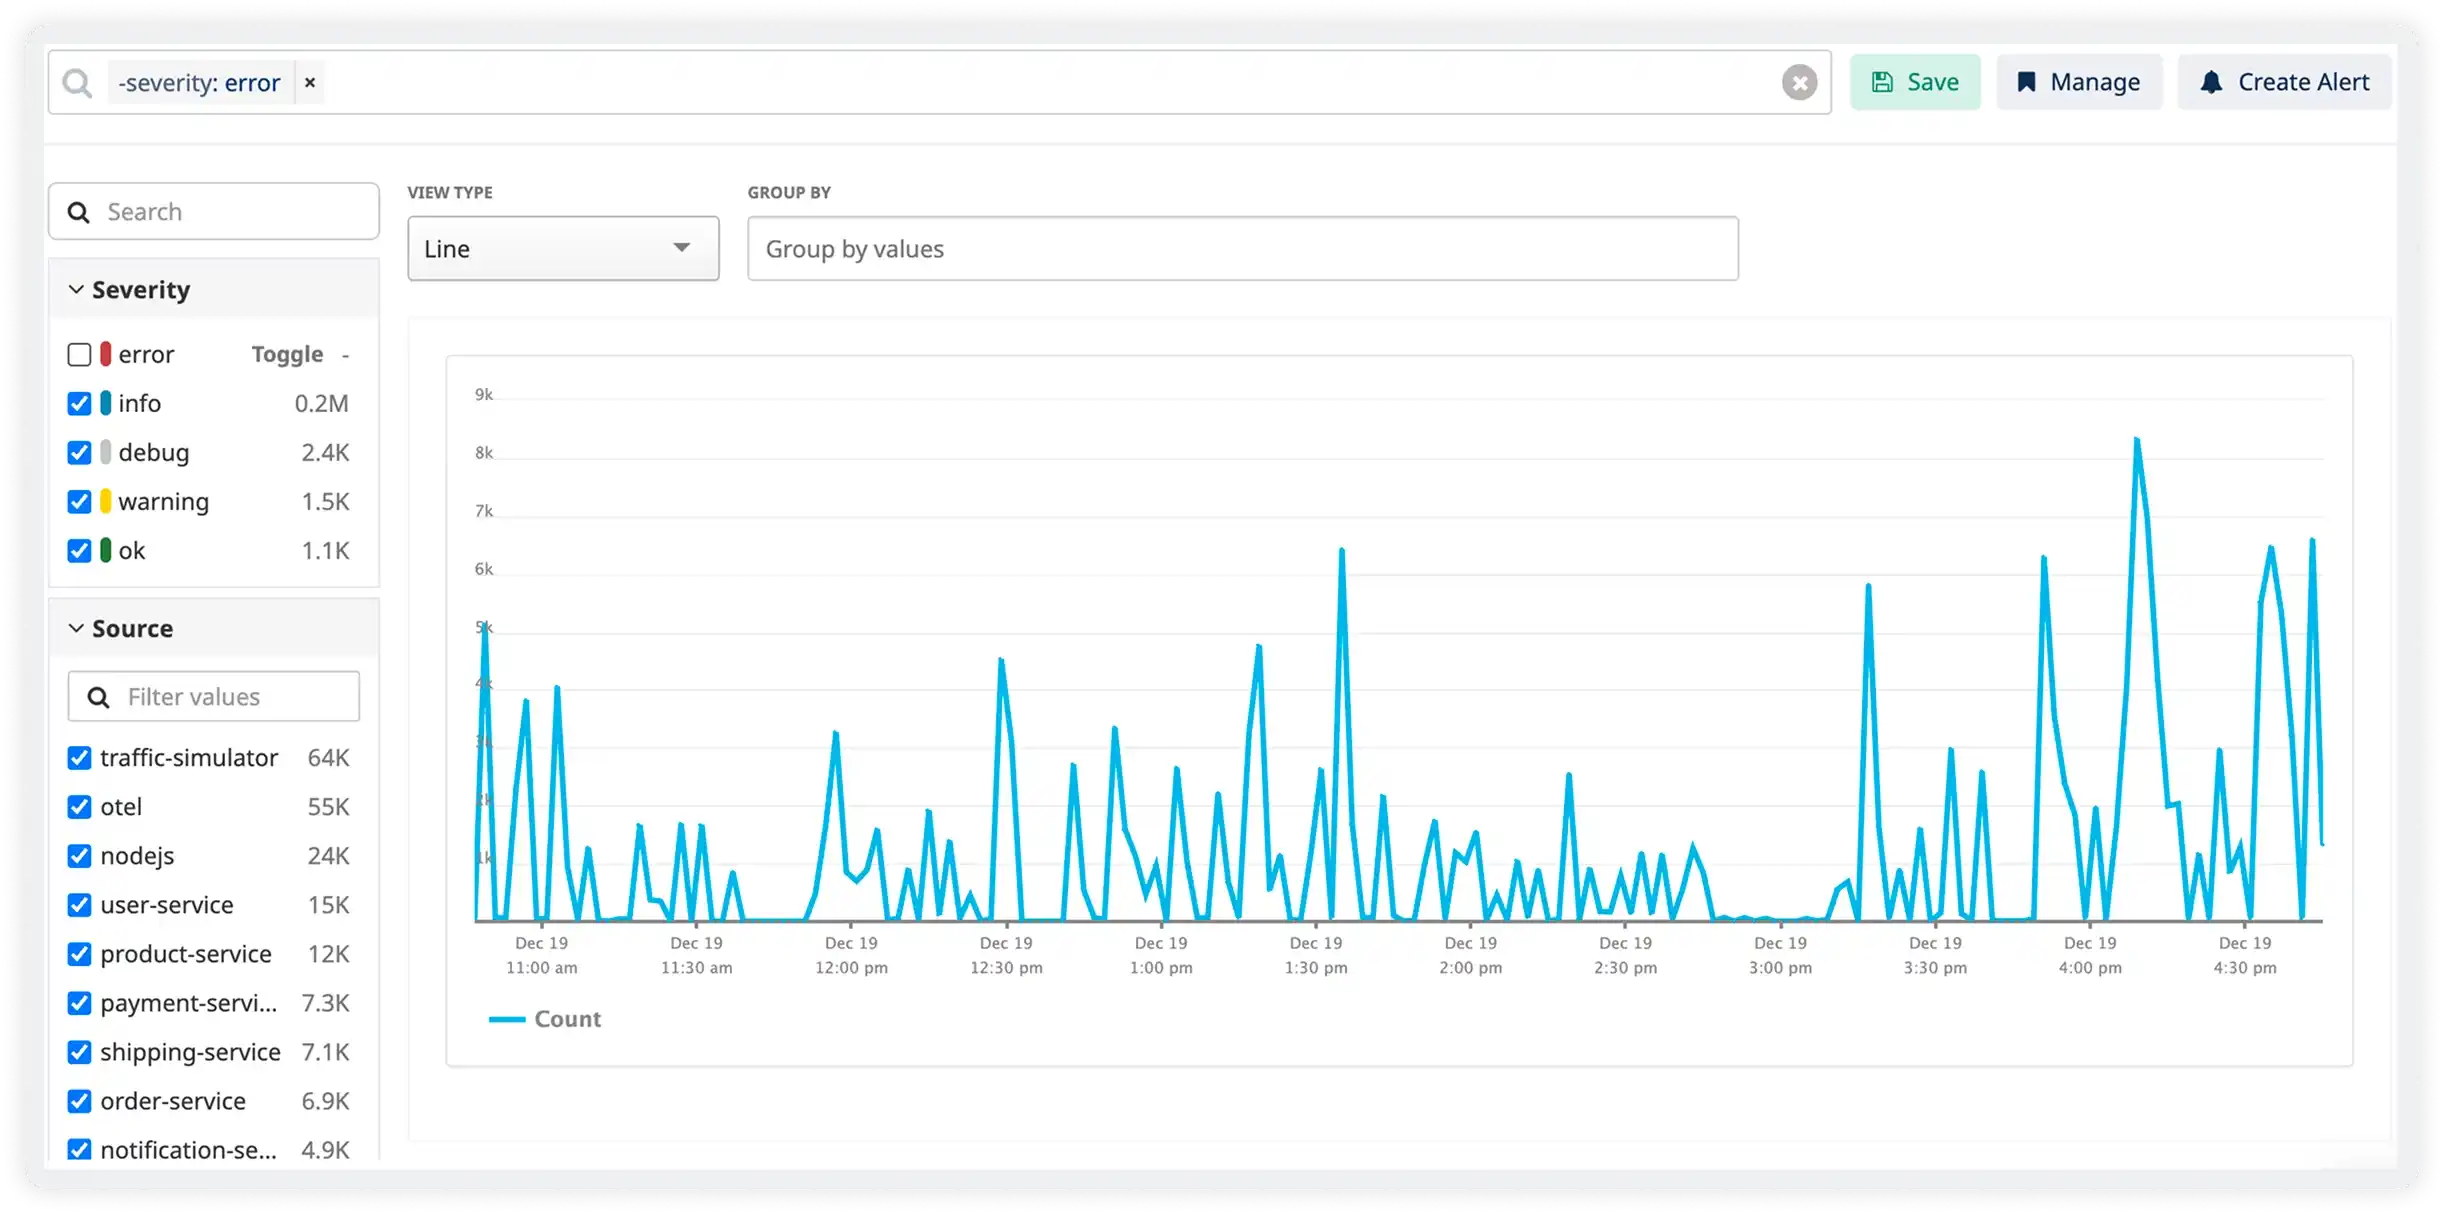
Instant Log Detection
- Search across all API logs to quickly identify failures, slow requests, and unexpected behavior during production issues.
- Eliminate noisy log digging by isolating only relevant API requests when incidents occur.
- Filter logs by endpoint, status code, user, service, or custom fields to uncover recurring error or latency patterns.
- Trigger alerts when log signals indicate issues such as rising 5xx errors, authentication failures, or abnormal response times.
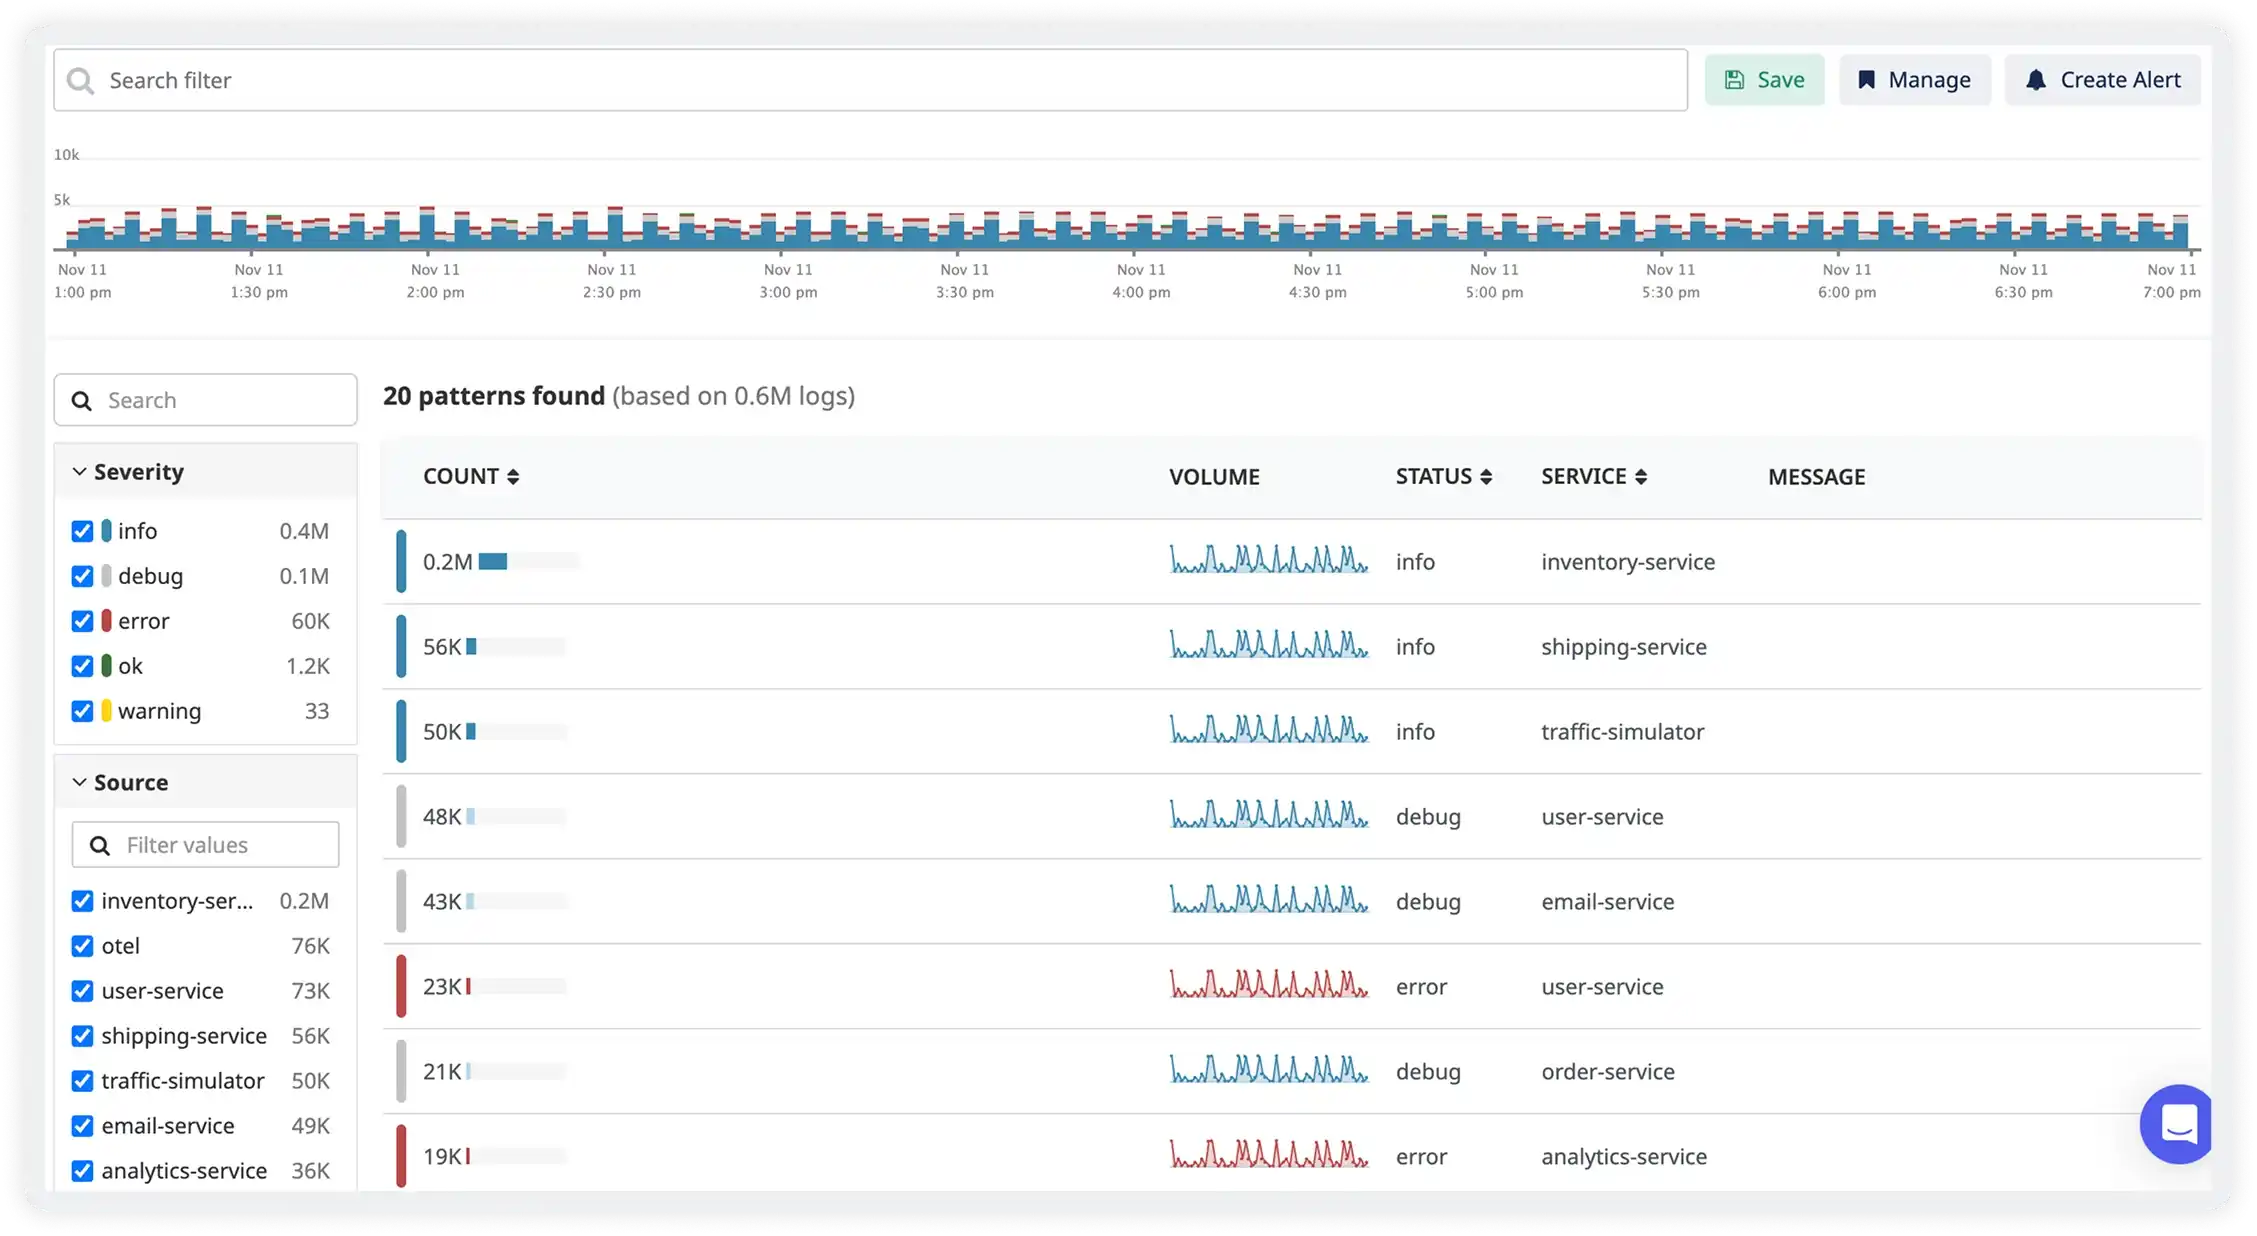
Structured Log Insights
- Capture structured API logs with consistent fields such as endpoint, latency, status code, HTTP method, and custom tags.
- Break down logs by environment, region, version, or customer segment to quickly locate the source of failures.
- Enable reliable aggregation, filtering, and comparison using structured and queryable log formats.
- Accelerate investigations and reduce guesswork by working with clean, normalized log data.
Contextual Log Analysis
- Correlate API logs with related metrics, traces, and events to understand both symptoms and root causes.
- Group logs using request IDs or trace identifiers to reconstruct end-to-end request flows.
- Identify cascading failures by observing how errors propagate across dependent services.
- Resolve incidents faster by analyzing logs alongside performance and infrastructure data in a unified view.
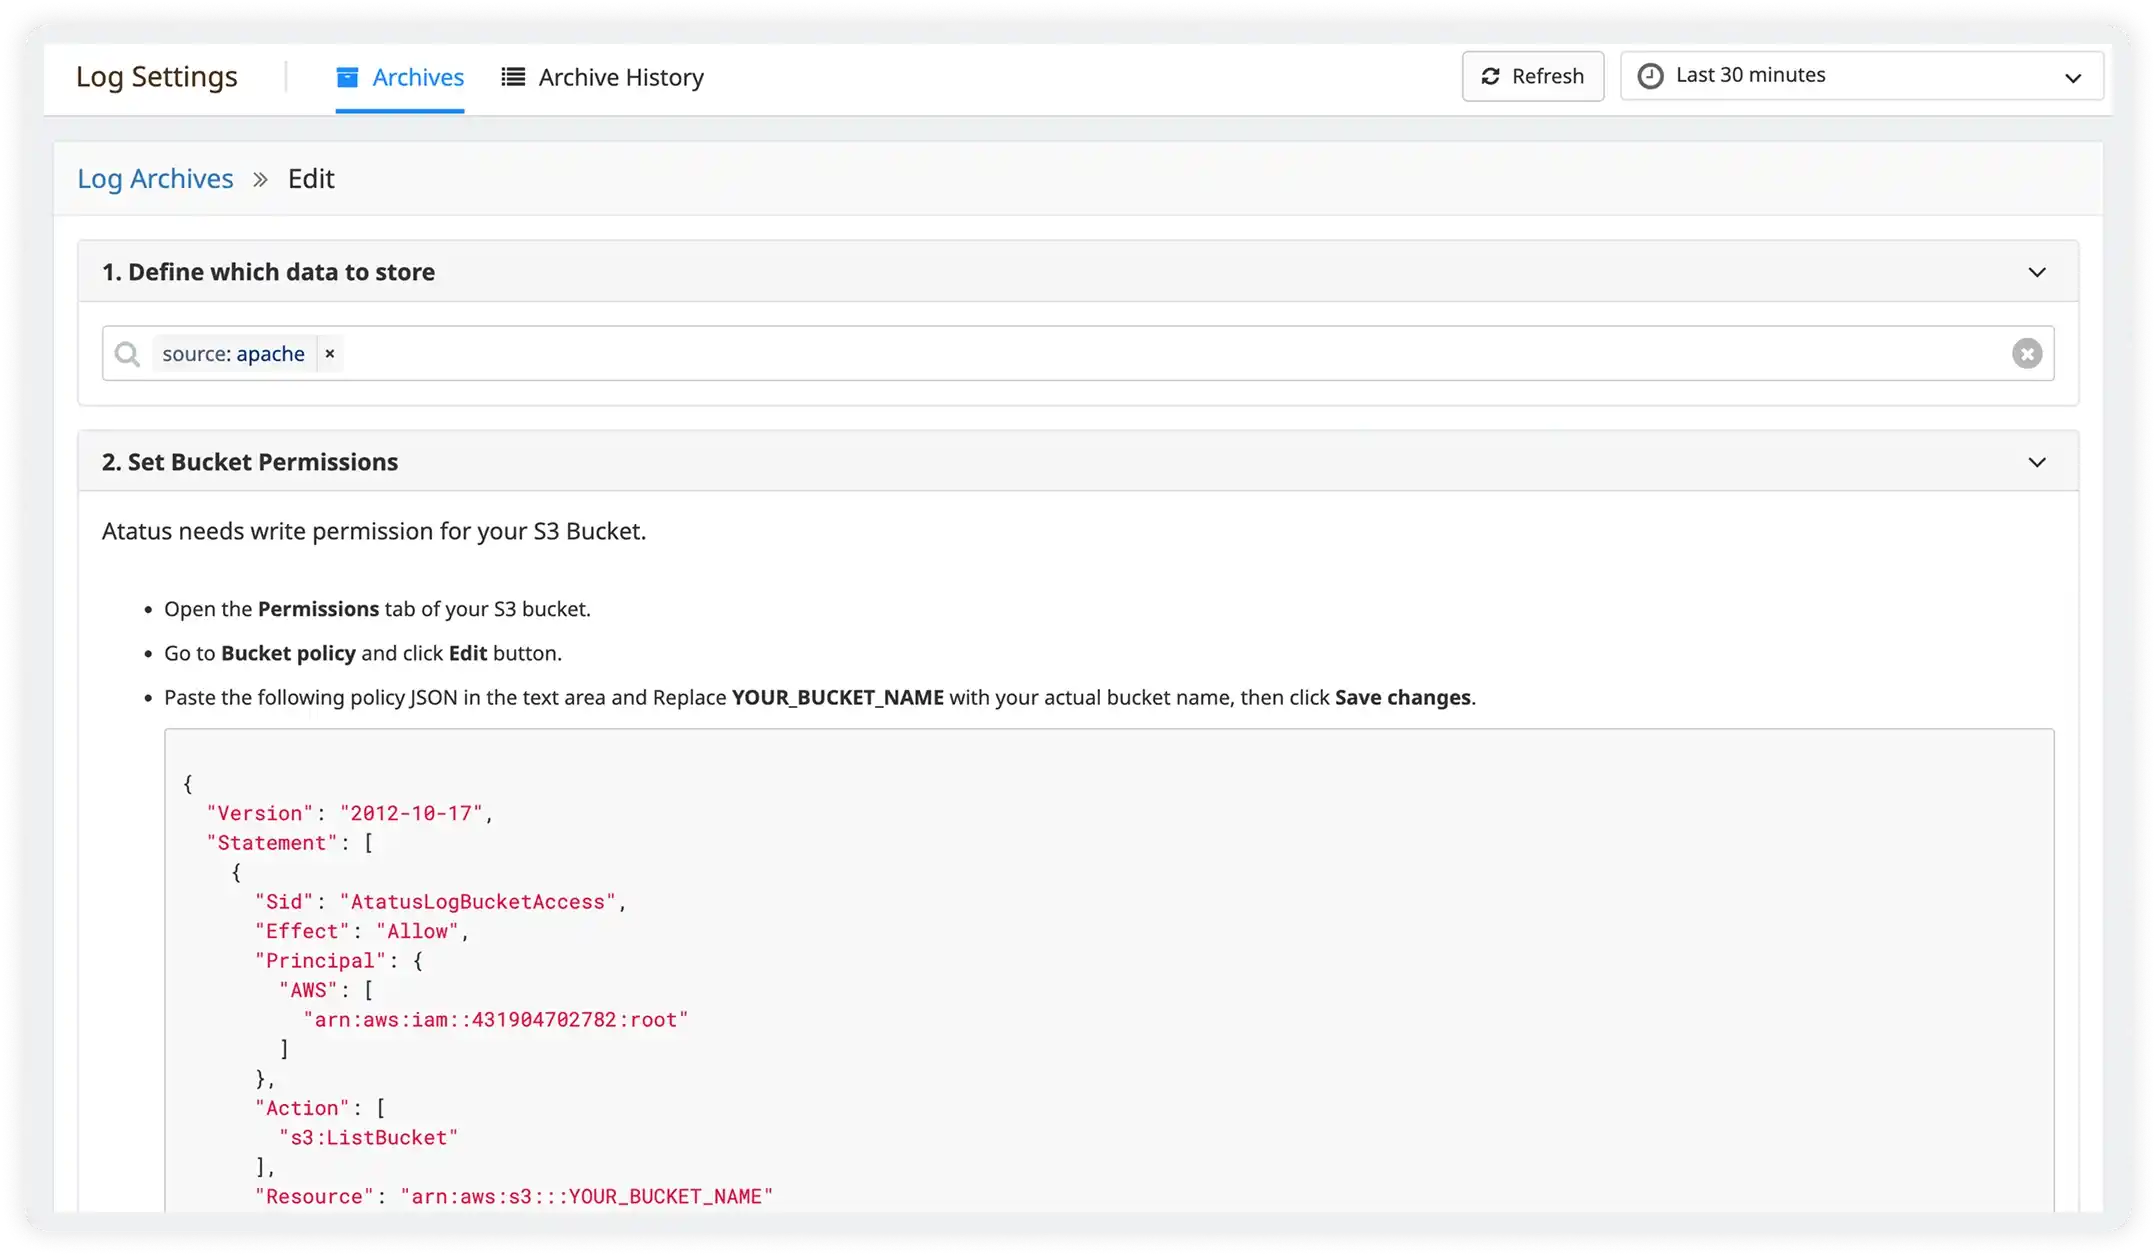
Smart Log Retention
- Control log retention policies to prioritize high-value API data while minimizing storage costs.
- Retain critical logs such as errors, slow requests, and key endpoints for troubleshooting and audit requirements.
- Sample or limit low-value traffic while preserving visibility into important behaviors.
- Apply retention rules by service, environment, or log level so teams always have the right data during incidents.
How Atatus Transforms Your Operations
Measurable improvements across your DevOps workflows and business metrics
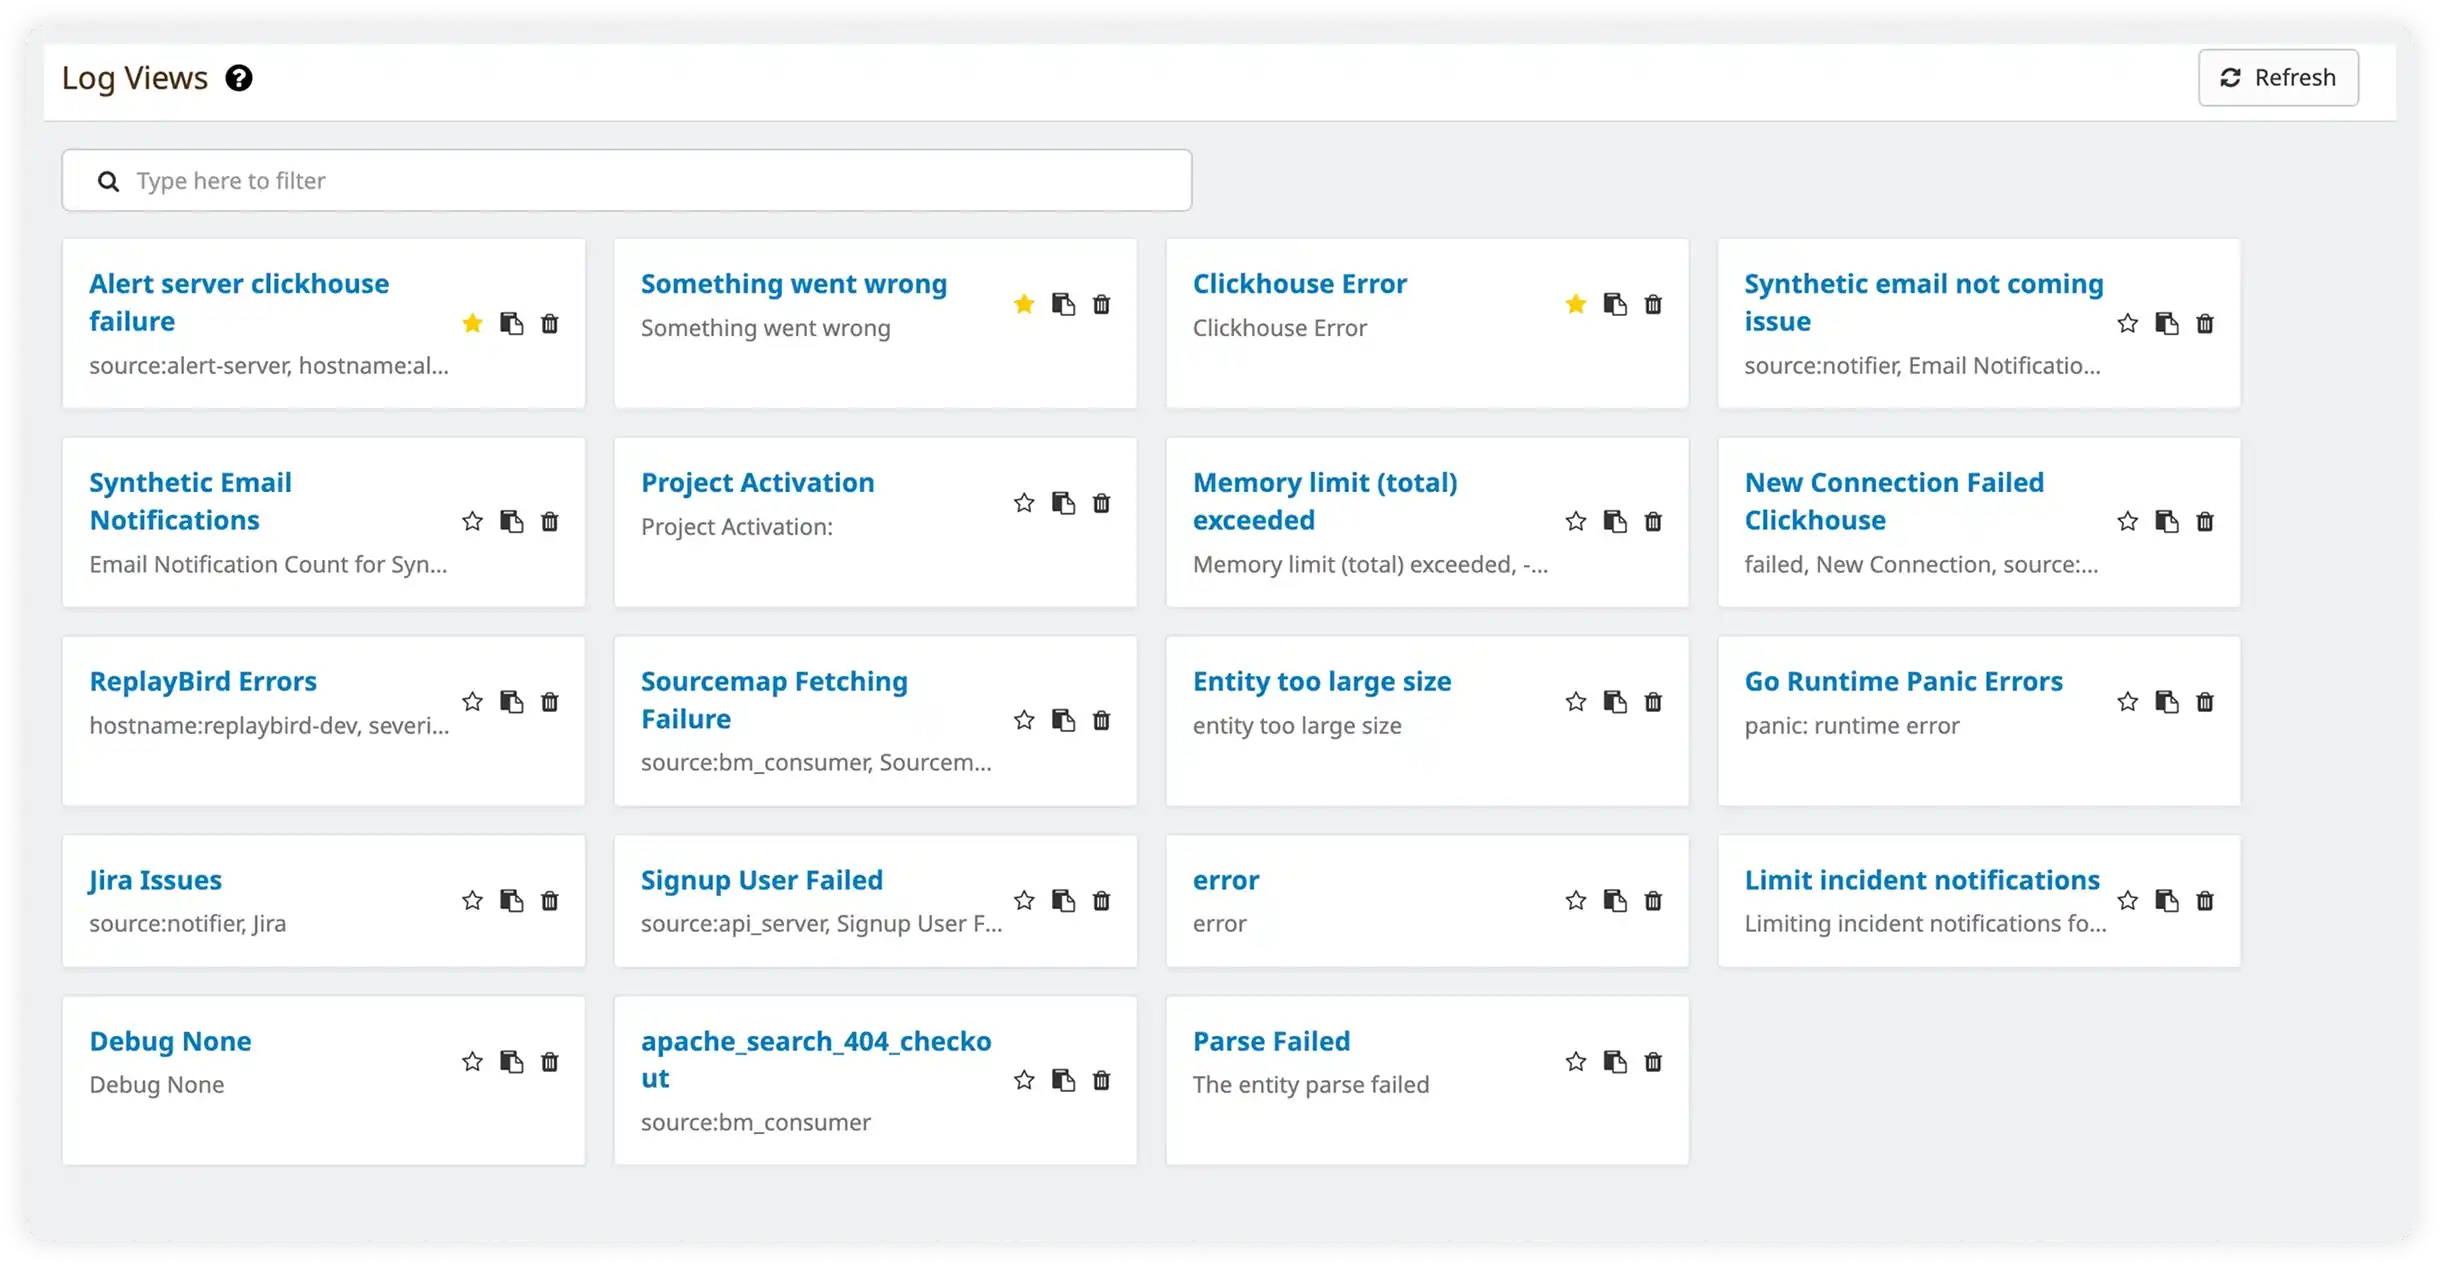
Find Critical API Errors in Seconds
10x faster log searchPowerful search and filtering across all API logs with automatic error detection and intelligent grouping.
DevOps Impact
Full-text search, regex patterns, and field-level filtering on structured API logs
Business Impact
Resolve customer issues 10x faster with instant log access
Complete Request Context for Every Error
90% reduction in debug timeAutomatically capture request/response payloads, headers, user context, and system state when errors occur.
DevOps Impact
No more 'unable to reproduce' - full context available for every logged error
Business Impact
Faster debugging and fewer escalations to engineering
Trace Requests Across All Microservices
Cross-service visibilityAutomatic correlation of logs across services using trace IDs, showing the complete request journey.
DevOps Impact
See logs from all services involved in a single request in chronological order
Business Impact
Identify which service in the chain caused the issue instantly
Unified Observability for Every Engineering Team
Atatus adapts to how engineering teams work across development, operations, and reliability.
Developers
Trace requests, debug errors, and identify performance issues at the code level with clear context.
DevOps
Track deployments, monitor infrastructure impact, and understand how releases affect application stability.
Release Engineer
Measure service health, latency, and error rates to maintain reliability and reduce production risk.
Milestones that spark performance excellence
Reflections from clients who've achieved unmatched excellence through innovative strategies.
Read customer stories


