Ensure Uptime with 24x7 Synthetic Monitoring
Test your websites, APIs and servers from nine locations, every minute by default. HTTP, SSL, DNS, TCP, ICMP, UDP and multistep API checks, with alerts that wait for real failures.
Build a check. Test it before you save.
Pick a check type, run it once, and start from the assertions Atatus suggests.
Choose request type
Define request
Advanced options: request headers, authentication, body, cookies
Dedicated pages: SSL monitoring · DNS monitoring · chaining requests is a multistep check
Press Test check to run the request once and see what comes back.
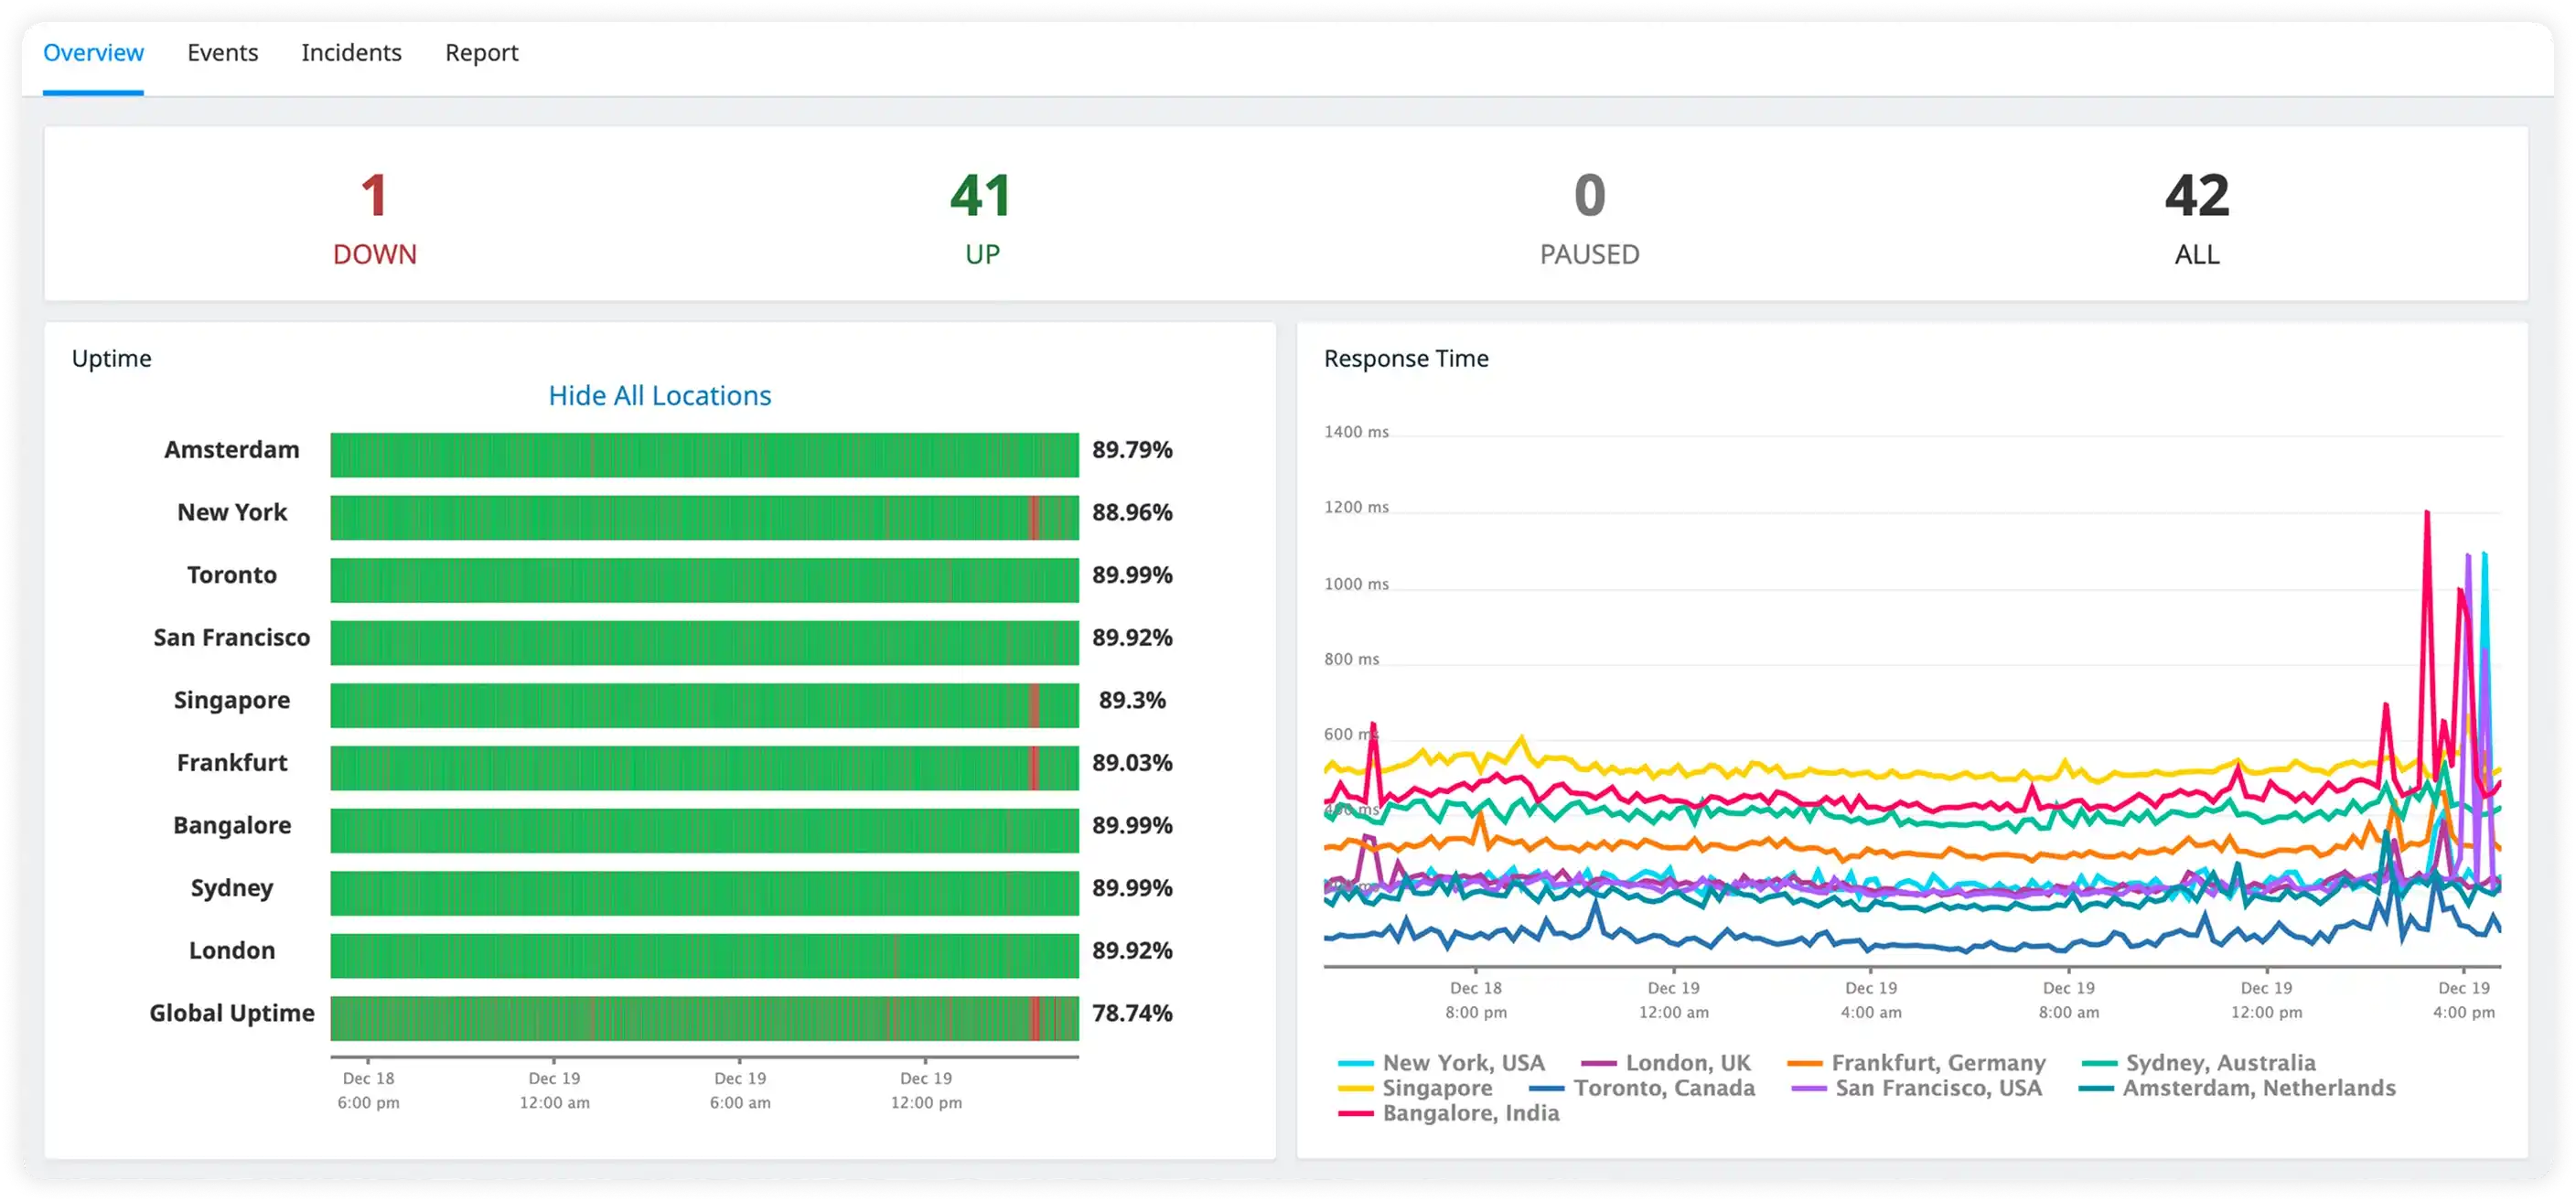
Nine locations. Every minute.
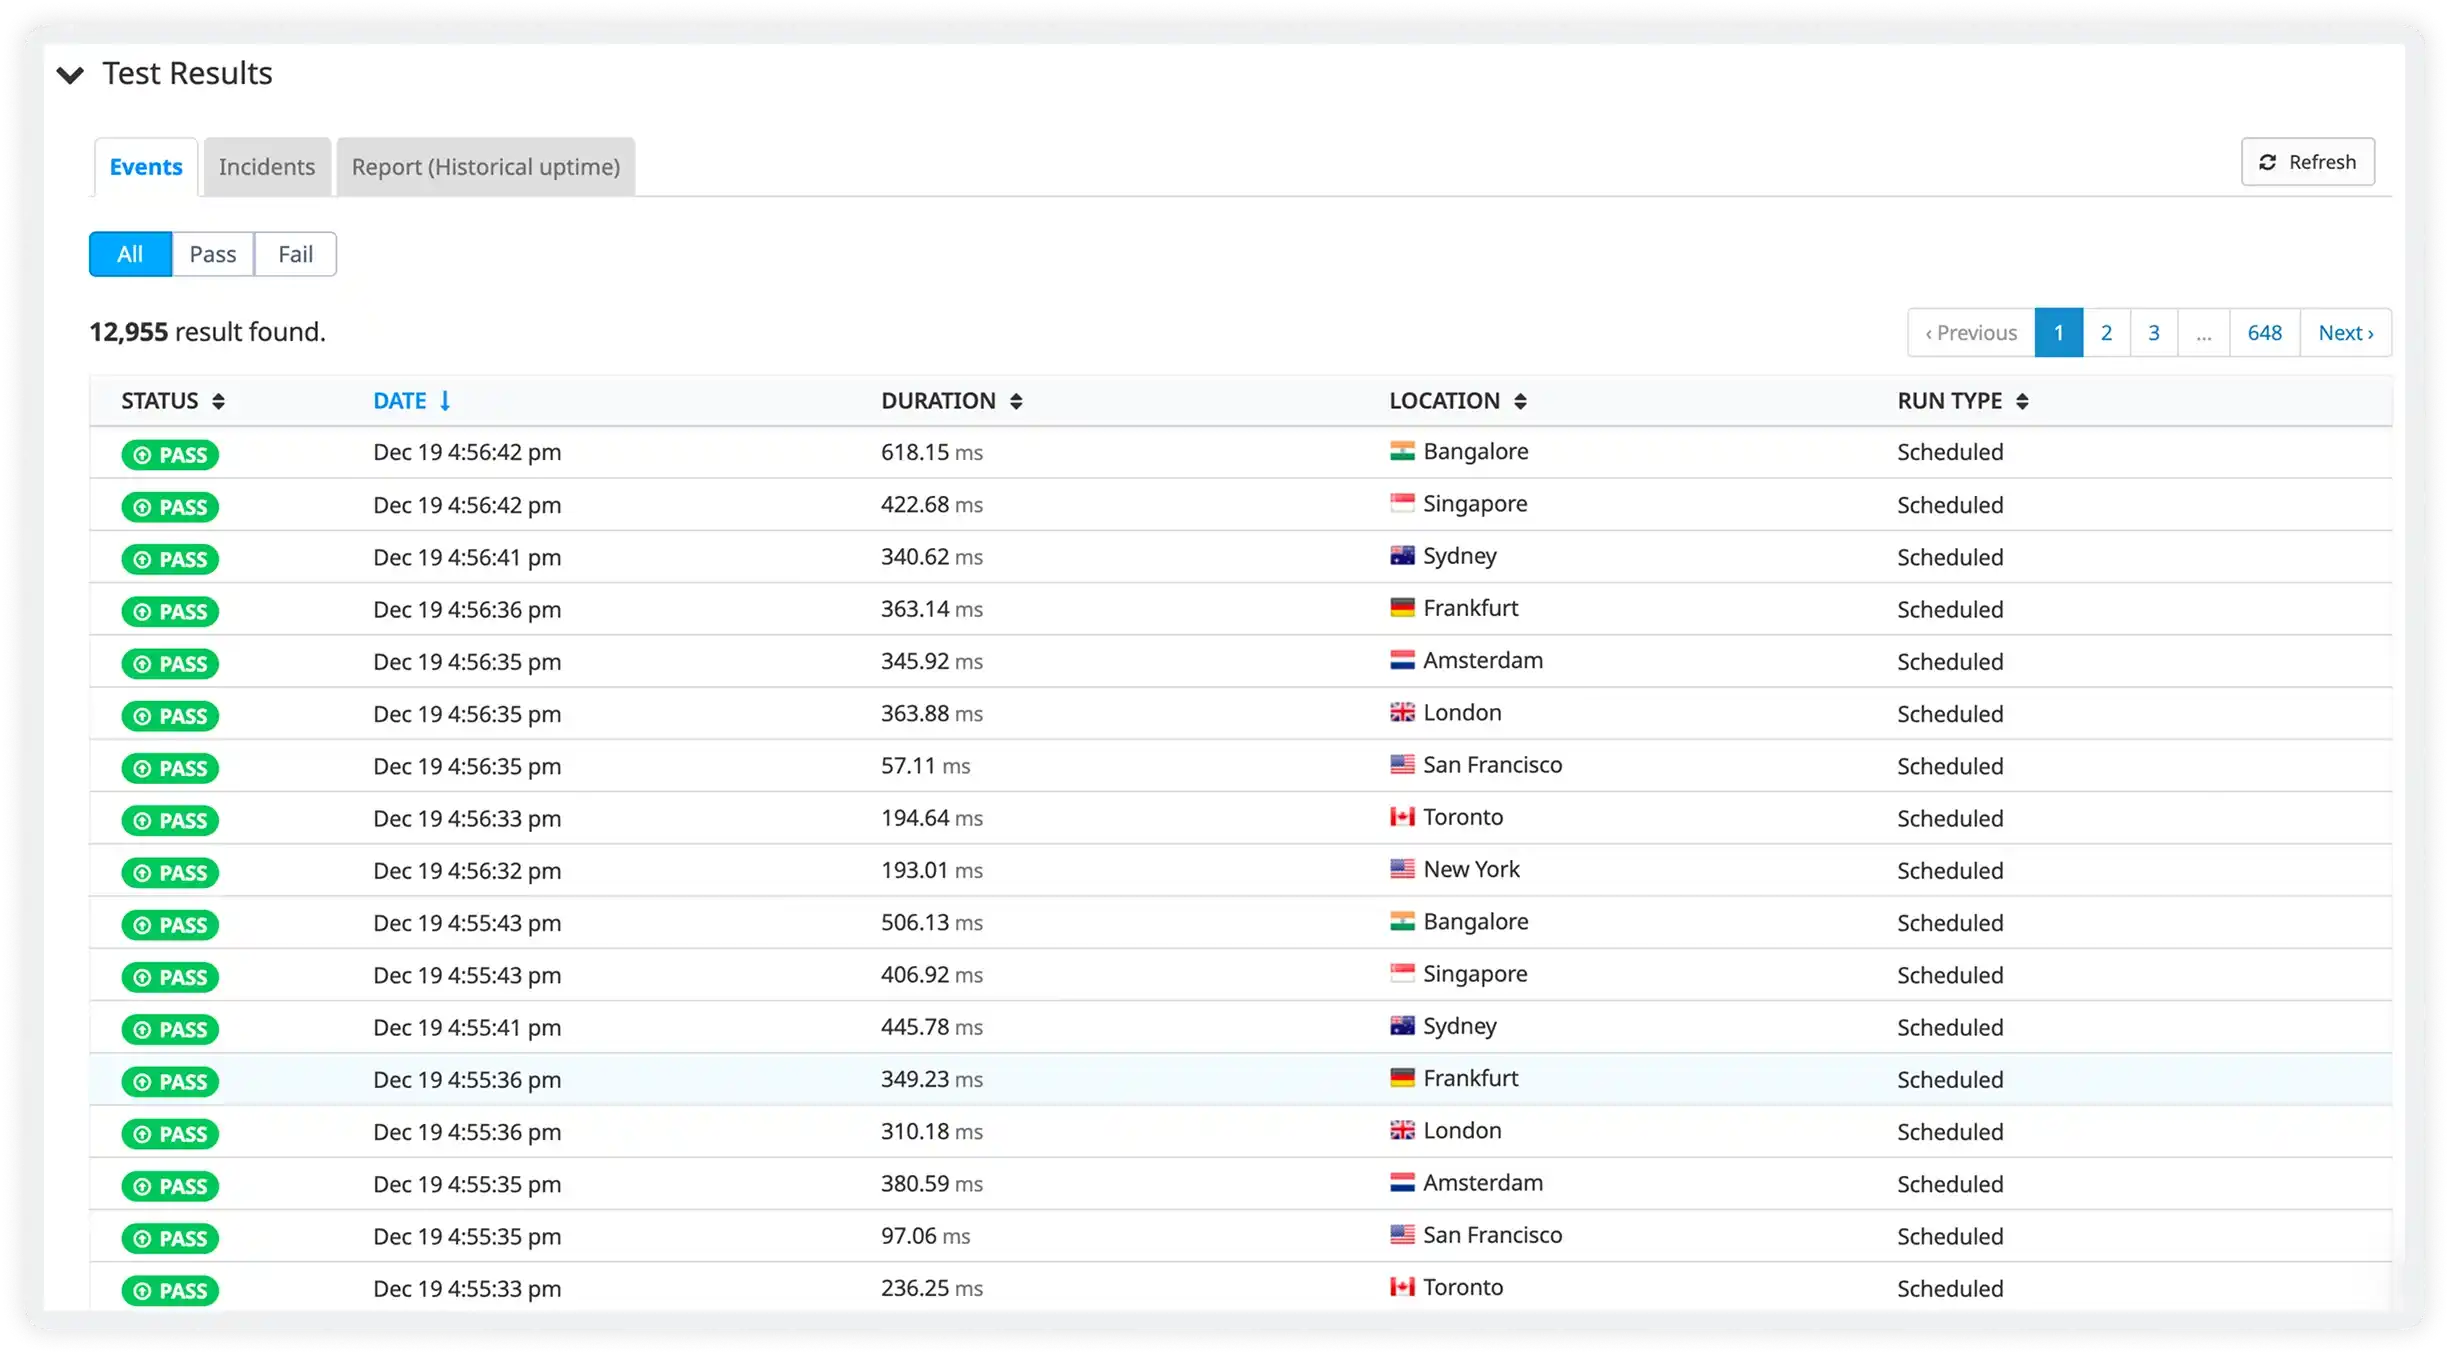
Checks run once a minute by default, from the locations you pick. Open any run to see where the time went.
- 138 ms
- 133 ms
- 90 ms
- 176 ms
- 193 ms
- 166 ms
- 218 ms
- 294 ms
- 323 ms
Sample data · pick a location to open its last run
Log in, then test what is behind it.
Chain requests into one check. Pull a value out of one response and send it with the next.
POST /api/login
- ✓status code is 200
Extracts TOKEN from the response header x-auth-token, parsed with regex.
Sample data · click a step to inspect it
Page on outages, not blips.
Set how many failures in a row, at how many locations, before anyone is notified.
- First failed run at Frankfurt
- 3 failures in a row: Frankfurt is down
- No alert: down at 1 of the 2 locations you require. Treated as a blip.
Checks run every minute · sample data
Uptime Monitoring, screen by screen.
Real screens from the Atatus app.
Questions about uptime monitoring
Pricing, deployment, data and the agent. If something is missing, a person will answer it on a demo call.
Synthetic monitoring uses scripted simulated checks to continuously test your application's availability even when no real users are active giving you proactive, always-on visibility. Unlike RUM, which captures actual user sessions, synthetic monitoring catches failures at 3am before any user reaches your checkout page.
Each check runs from the locations you pick, out of nine: Toronto, New York, San Francisco, Frankfurt, London, Amsterdam, Singapore, Bangalore and Sydney. You set how many failures in a row a location needs before it counts as down, and at how many locations the check must be down before anyone is notified, so a single network blip does not page you.
Yes, at the API level. A multistep API check chains requests into one check: log in, then call the endpoints behind the login. You can extract a value from one step's response header, as is or with a regular expression, and send it in the next step. Each step has its own assertions, and you can choose to continue the test when a step fails.
Checks run once a minute by default, so a failure is seen on the next run. An alert fires as soon as your retry and location conditions are met, and goes to email, Slack, Microsoft Teams, PagerDuty, OpsGenie, SMS through Twilio or a webhook.
Atatus covers HTTP, SSL, DNS, TCP, ICMP, UDP and multistep API checks from nine locations, with assertions on status, headers, body, response time, certificates, records and packet loss. Synthetic checks live in the same platform as APM, logs and real user monitoring, pricing has no per-user fees, and Atatus can also run on-premises.
Yes. Atatus is SOC 2 Type 2 audited, ISO 27001:2022 certified and supports GDPR. Data is encrypted in transit and at rest and stays in the region where it was collected. Teams that need to keep data in-house can run Atatus on-premises, and pricing has no per-user fees.