The Atatus Blog
APM, logs, real user monitoring, infrastructure and SRE practice: engineering guides and tool comparisons.
- APM
- Application Performance Monitoring
- OpenTelemetry
- Log Management
- Logs
- Kubernetes
- PHP
- Node.js
- Java
- Real User Monitoring
- Datadog
- New Relic
- Observability
- Database Monitoring
- Infrastructure Monitoring
- Distributed Tracing
- Serverless
- alternatives
Dash0 Agent0 Alternatives: 5 Observability Platforms Compared
Dash0 Agent0 has real limits: OTel-only ingestion, usage-based billing, and a newer ecosystem. See how Atatus, Datadog, New Relic, Dynatrace, and SigNoz stack up on pricing, OTel support, and free trials.
- Error Tracking
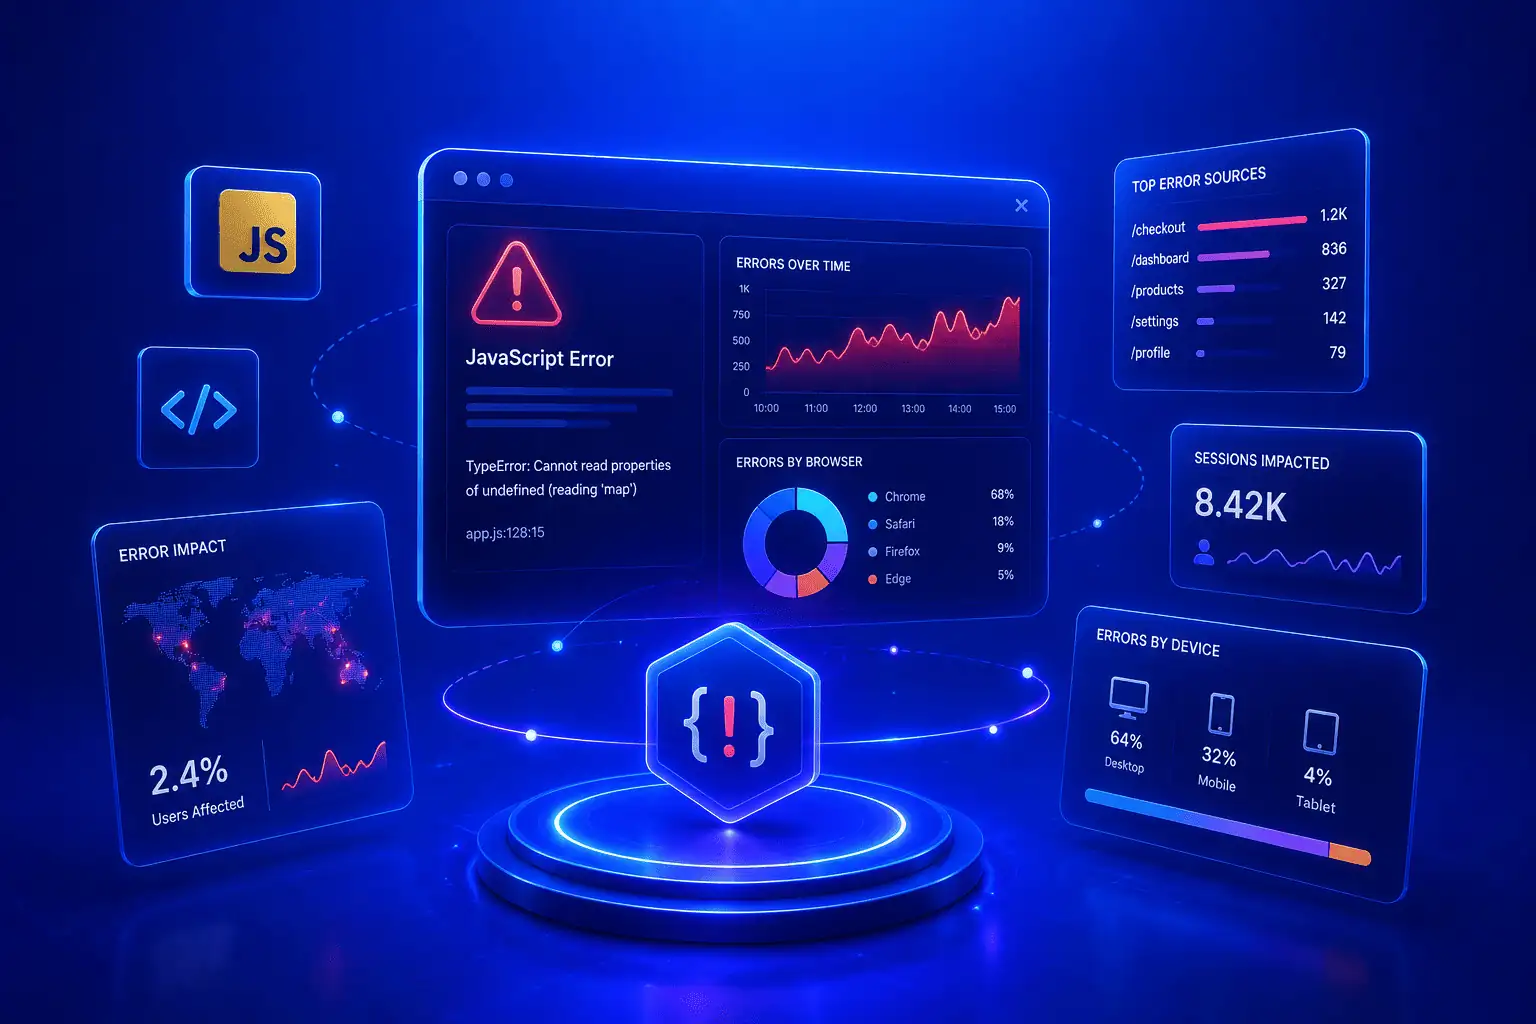
JavaScript Error Monitoring: 12 Best Practices to Cut Noise & Ship Fixes Faster
Most JavaScript error feeds are 90% noise. Here are 12 production-tested practices from domain whitelisting to smart alerting that surface the errors actually breaking your users' experience.
- on premises
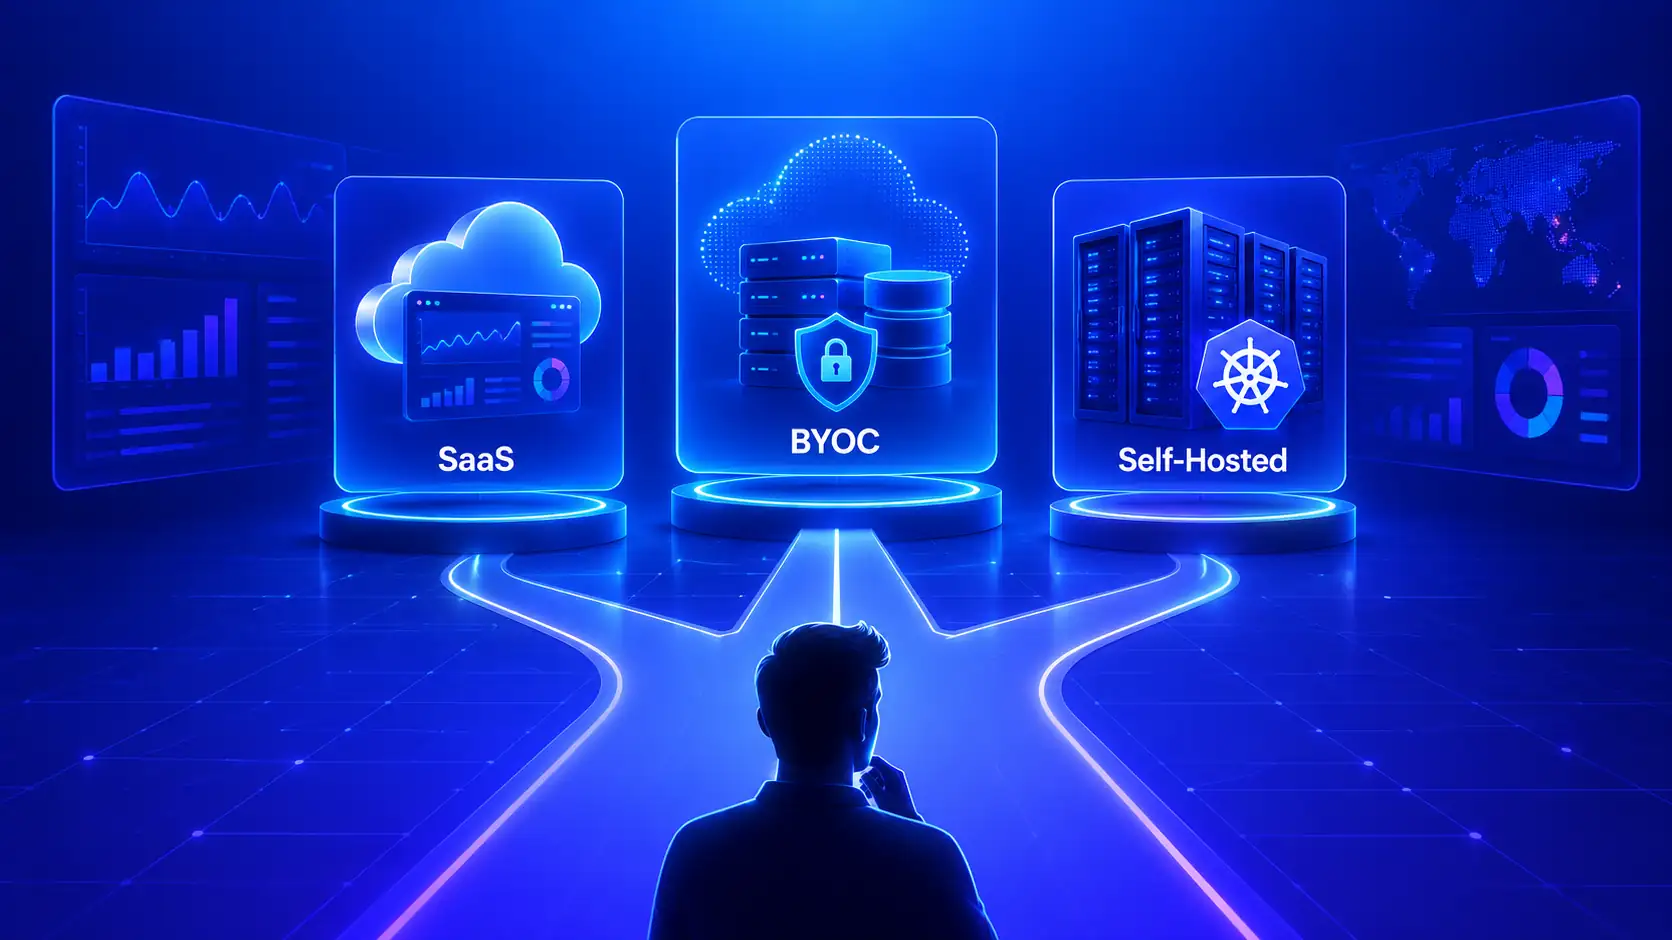
SaaS vs Self-Hosted Observability (Including BYOC): Cost, Latency, Control and Governance
SaaS, BYOC, and self-hosted observability behave differently at scale in cost, latency, control and governance. A practical breakdown to help you pick the right deployment model.
- postgresql
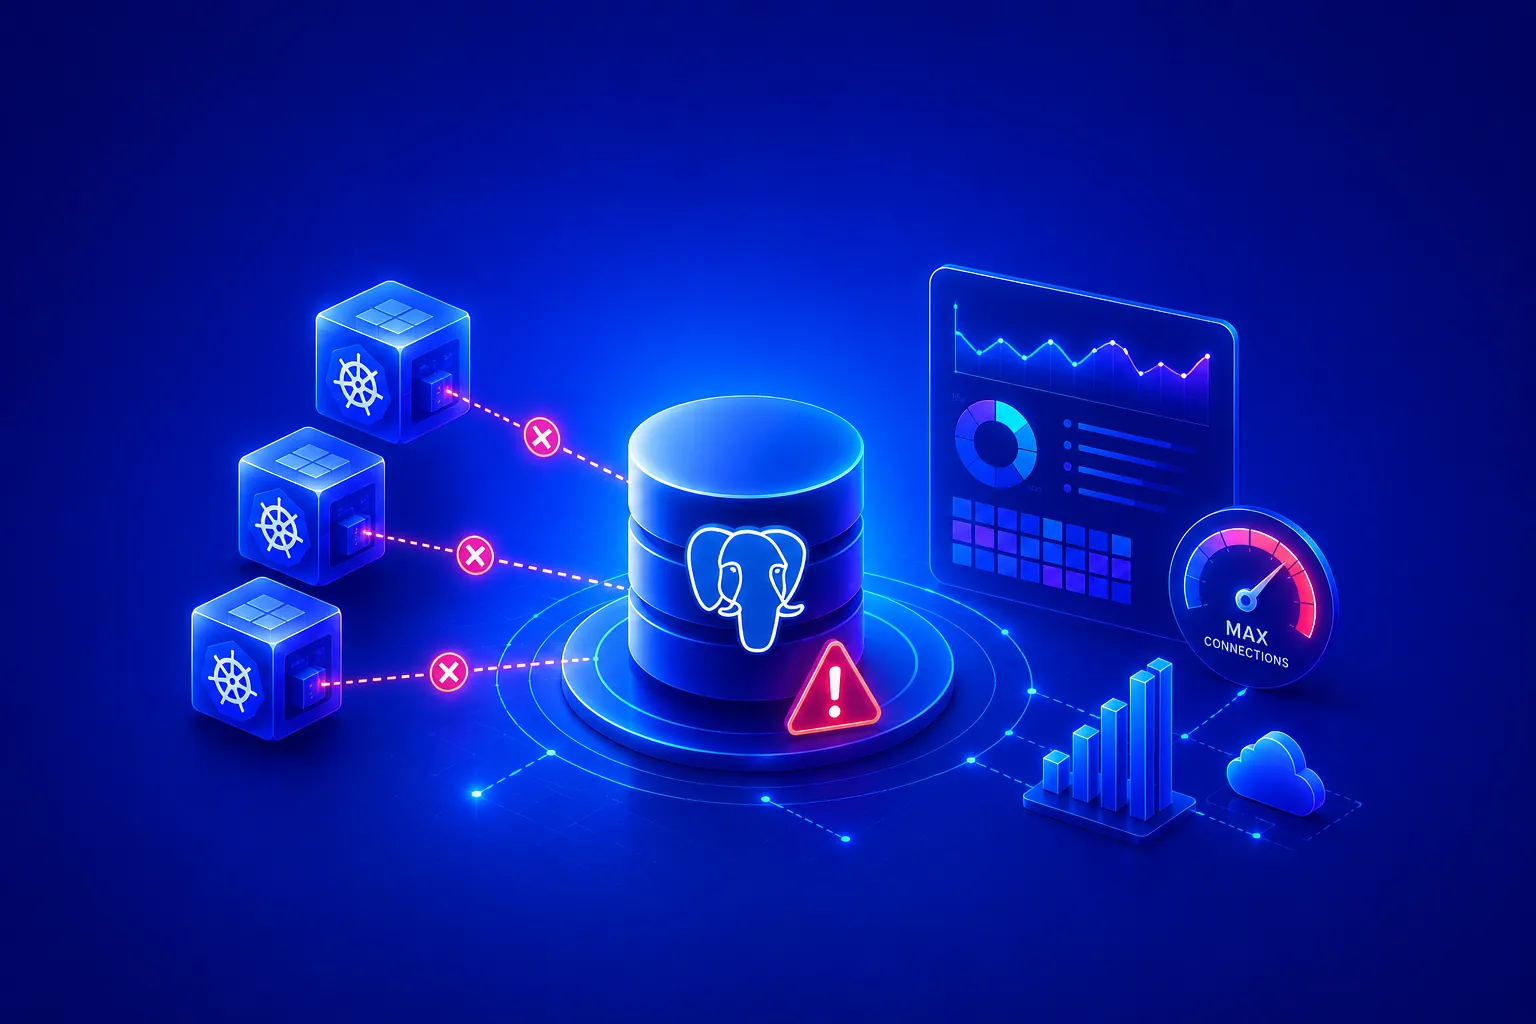
PostgreSQL Connection Pool Exhausted in Kubernetes: Causes, Diagnosis and Fixes
The database's fine such as CPU is low, queries are fast- yet requests time out. Here's why PostgreSQL connection pools exhaust in Kubernetes, how to diagnose it fast, and how to fix it for good.
- Observability
How to Choose an Observability Platform: A Growth-Stage Framework
A practical framework for choosing an observability platform as you scale like maturity levels, growth-stage requirements, hidden costs, and a buyer's evaluation checklist.
- GCP Monitoring
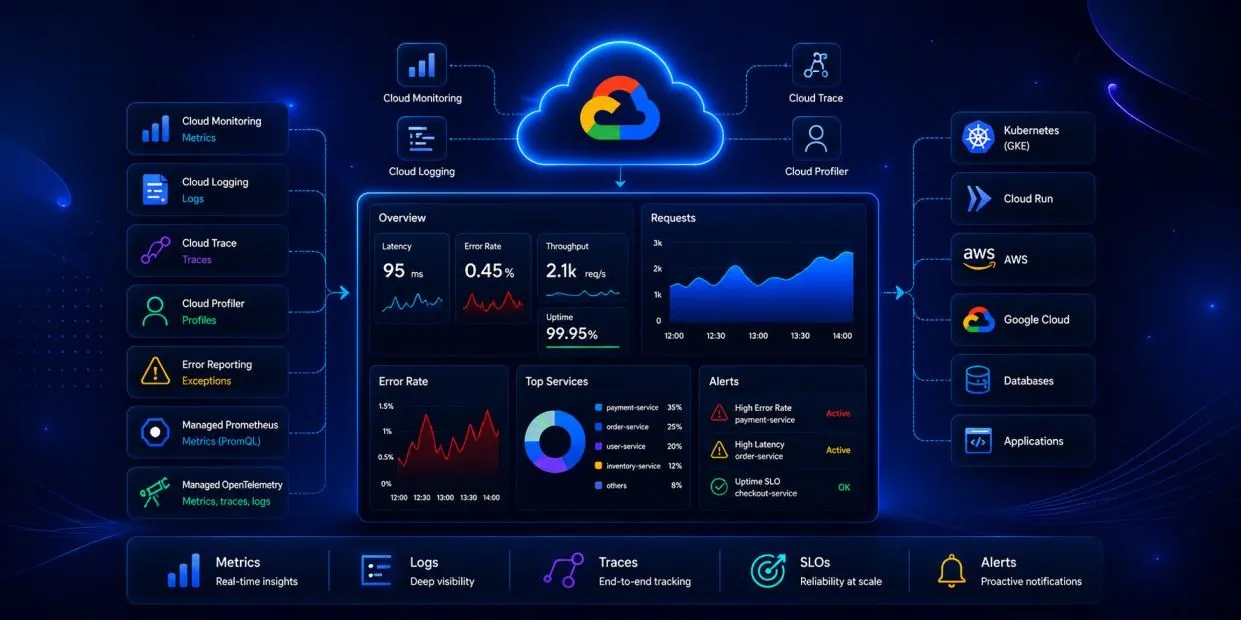
GCP Monitoring: A Complete Guide to Monitoring Google Cloud Applications and Infrastructure
A field guide to Google Cloud Monitoring, Cloud Logging, Cloud Trace, and the rest of the Google Cloud Operations Suite - what to instrument, how to alert without burning out your on-call rotation, and when native tooling stops being enough.
- Observability
Powerful On-Premises Observability: A Complete Guide for Modern Enterprise Applications
A complete guide to on-premises observability for enterprises: architecture, compliance, must-have features, and how to evaluate a self-hosted monitoring platform that scales.
- Blog
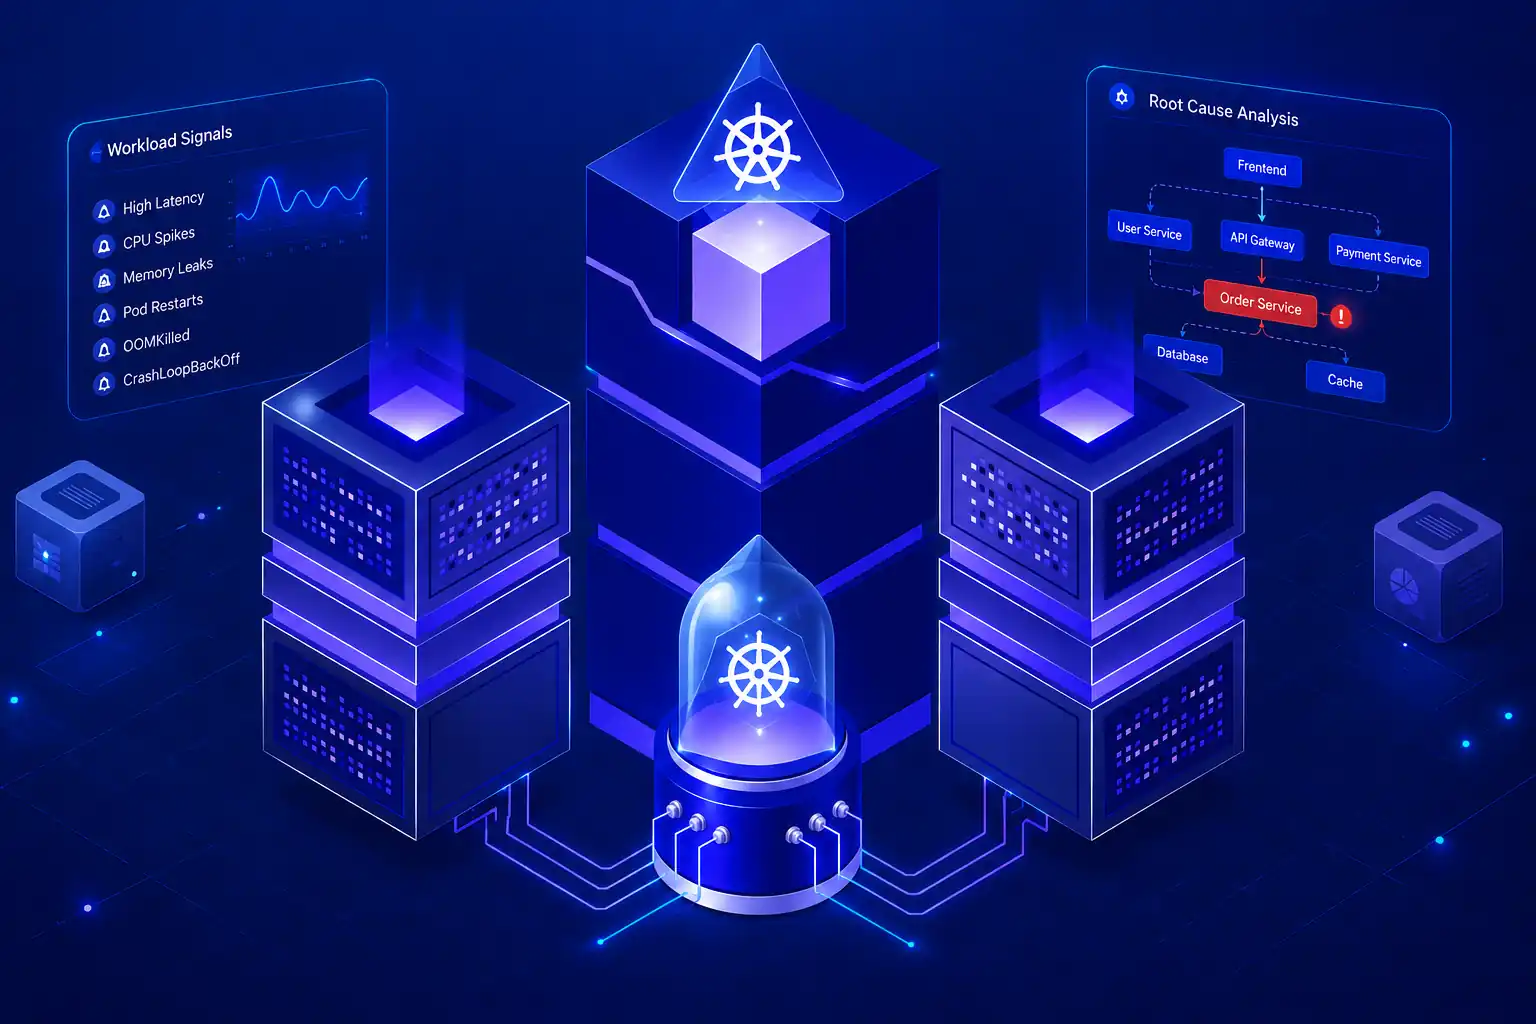
How to Diagnose Abnormal Kubernetes Workload Behavior (Step-by-Step)
It's 2:14 AM. CPU usage is normal. Memory looks stable. No pods are in CrashLoopBackOff. Every dashboard is green. And yet API latency has doubled, checkout requests are timing out, and your on-call phone won't stop buzzing. This is the defining trait of abnormal Kubernetes workload behavior: it rarely announces itself through the metrics you already watch. Kubernetes is exceptionally good at reporting whether a pod is running. It is far less good at telling you whether a pod is doing its job
- ai observability
Introducing AI-Powered Incident Correlation & Root Cause Detection
An API latency spike triggers 40 alerts, none tell you the cause. Atatus Problems groups them into one AI-correlated incident with automatic root cause detection. See how it works.