Java articles
Guides on JVM garbage collection tuning, heap dump analysis, thread contention, JDBC query profiling and Spring Boot observability for enterprise Java applications.
- Java
13 Best Performance Monitoring Tools for Java in 2026
For efficient Java performance tuning, it's critical to monitor the proper aspects and use the right tools. The following is a list of our top Java performance monitoring tools.
- Java
How to Detect Memory Leaks in Java
In Java, memory leaks are a real issue. We'll look at what causes memory leaks, how to spot them at runtime, and how to deal with them in our application.
- Java
Top 7 Java Performance Metrics to Monitor
Java's functionality and programming flexibility increased concurrently with technological advancement. A top 7 list of performance metrics to measure when evaluating the health of Java applications.
- Java
Best Practices in Java Logging for Better Application Logging
Java logs are the best source for locating application issues. You can use these best practices in Java logging to troubleshoot before your users are affected.
- Garbage collection
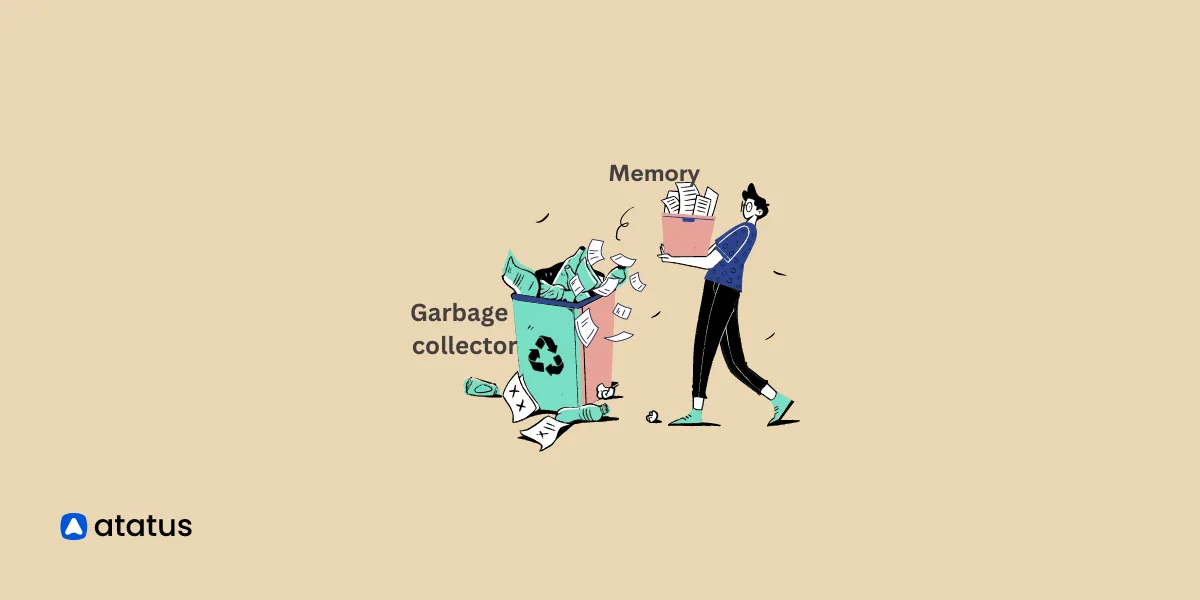
Java Garbage Collection - Manage your system's memory effectively
Discover the role of Java Garbage Collection in enhancing your application's memory management by automating memory cleanup and performance optimization.
- Java
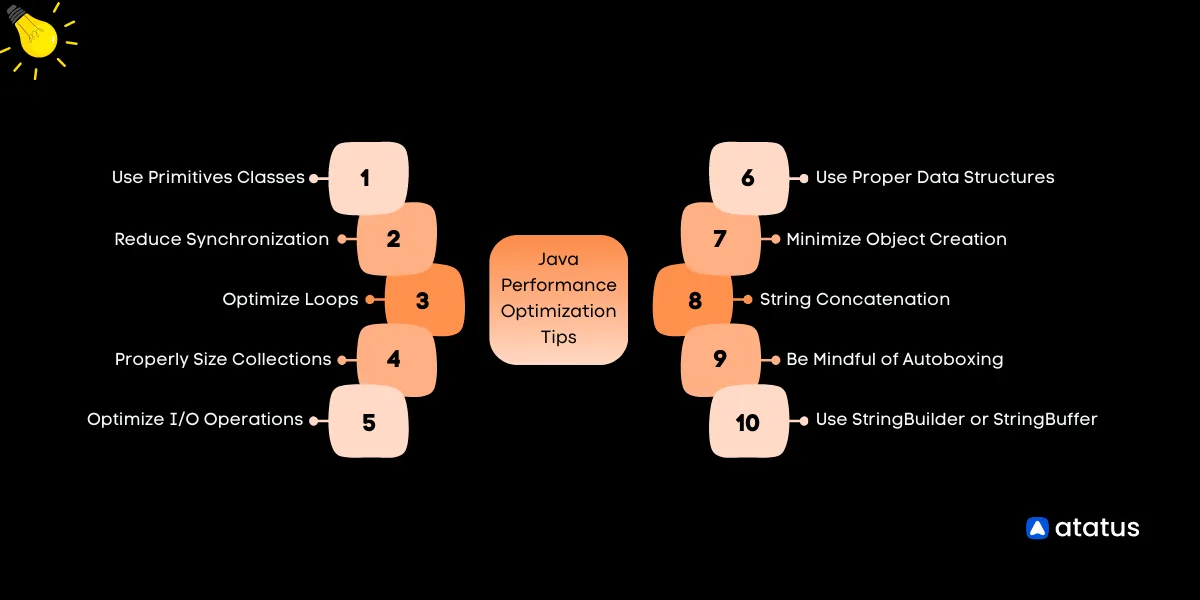
Java Performance Optimization Tips
Boost Java app speed with expert tips: data structures, object reuse, string handling, loop efficiency, threading, I/O, and more for optimal performance.
- Java
Profiling Java Applications with Java Agents: A Practical Guide
Java agents let you profile CPU, memory, and method execution without touching your source code. Here's how to build one from scratch, and when to reach for a full profiler instead.
- Java
Java Profiling Essentials: A Guide to Different Java Profilers
From Java Flight Recorder to async-profiler to full APM. Here's how the major Java profiling tools differ, and which one actually fits your dev, staging, or production environment.