Purpose-built Observability for Microservices Engineering Teams
One unified observability layer across infrastructure, services, logs, traces, and deployments, so your team ships faster and debugs in minutes, not hours.
73%
Faster mean-time-to-repair
4x
Reduction in service deploy issues
91%
Customer retention rate
8mins
Average time-to-onboard an agent
Connect deploys, metrics, traces, and logs instantly
From Signal to Root Cause in One Place. Atatus automatically correlates every metric, trace, rootcause event, and deployment so your team has full context at the moment of truth.
Distributed Tracing: Trace every request end-to-end across all services with full latency breakdown.
Service Dependency Maps: Live topology maps that show how every service connects and where errors propagate.
APM & Performance: Deep application performance monitoring with transaction-level visibility.
Log Correlation: Logs linked automatically to traces and infrastructure zero manual correlation.
Intelligent Alerts: Context-aware alerting that groups related signals and cuts alert fatigue.
Kubernetes Visibility: Full pod, node, and container observability for containerized workloads.
Built for the problems you're solving today
Every feature is designed around real engineering team workflows, not generic dashboards.
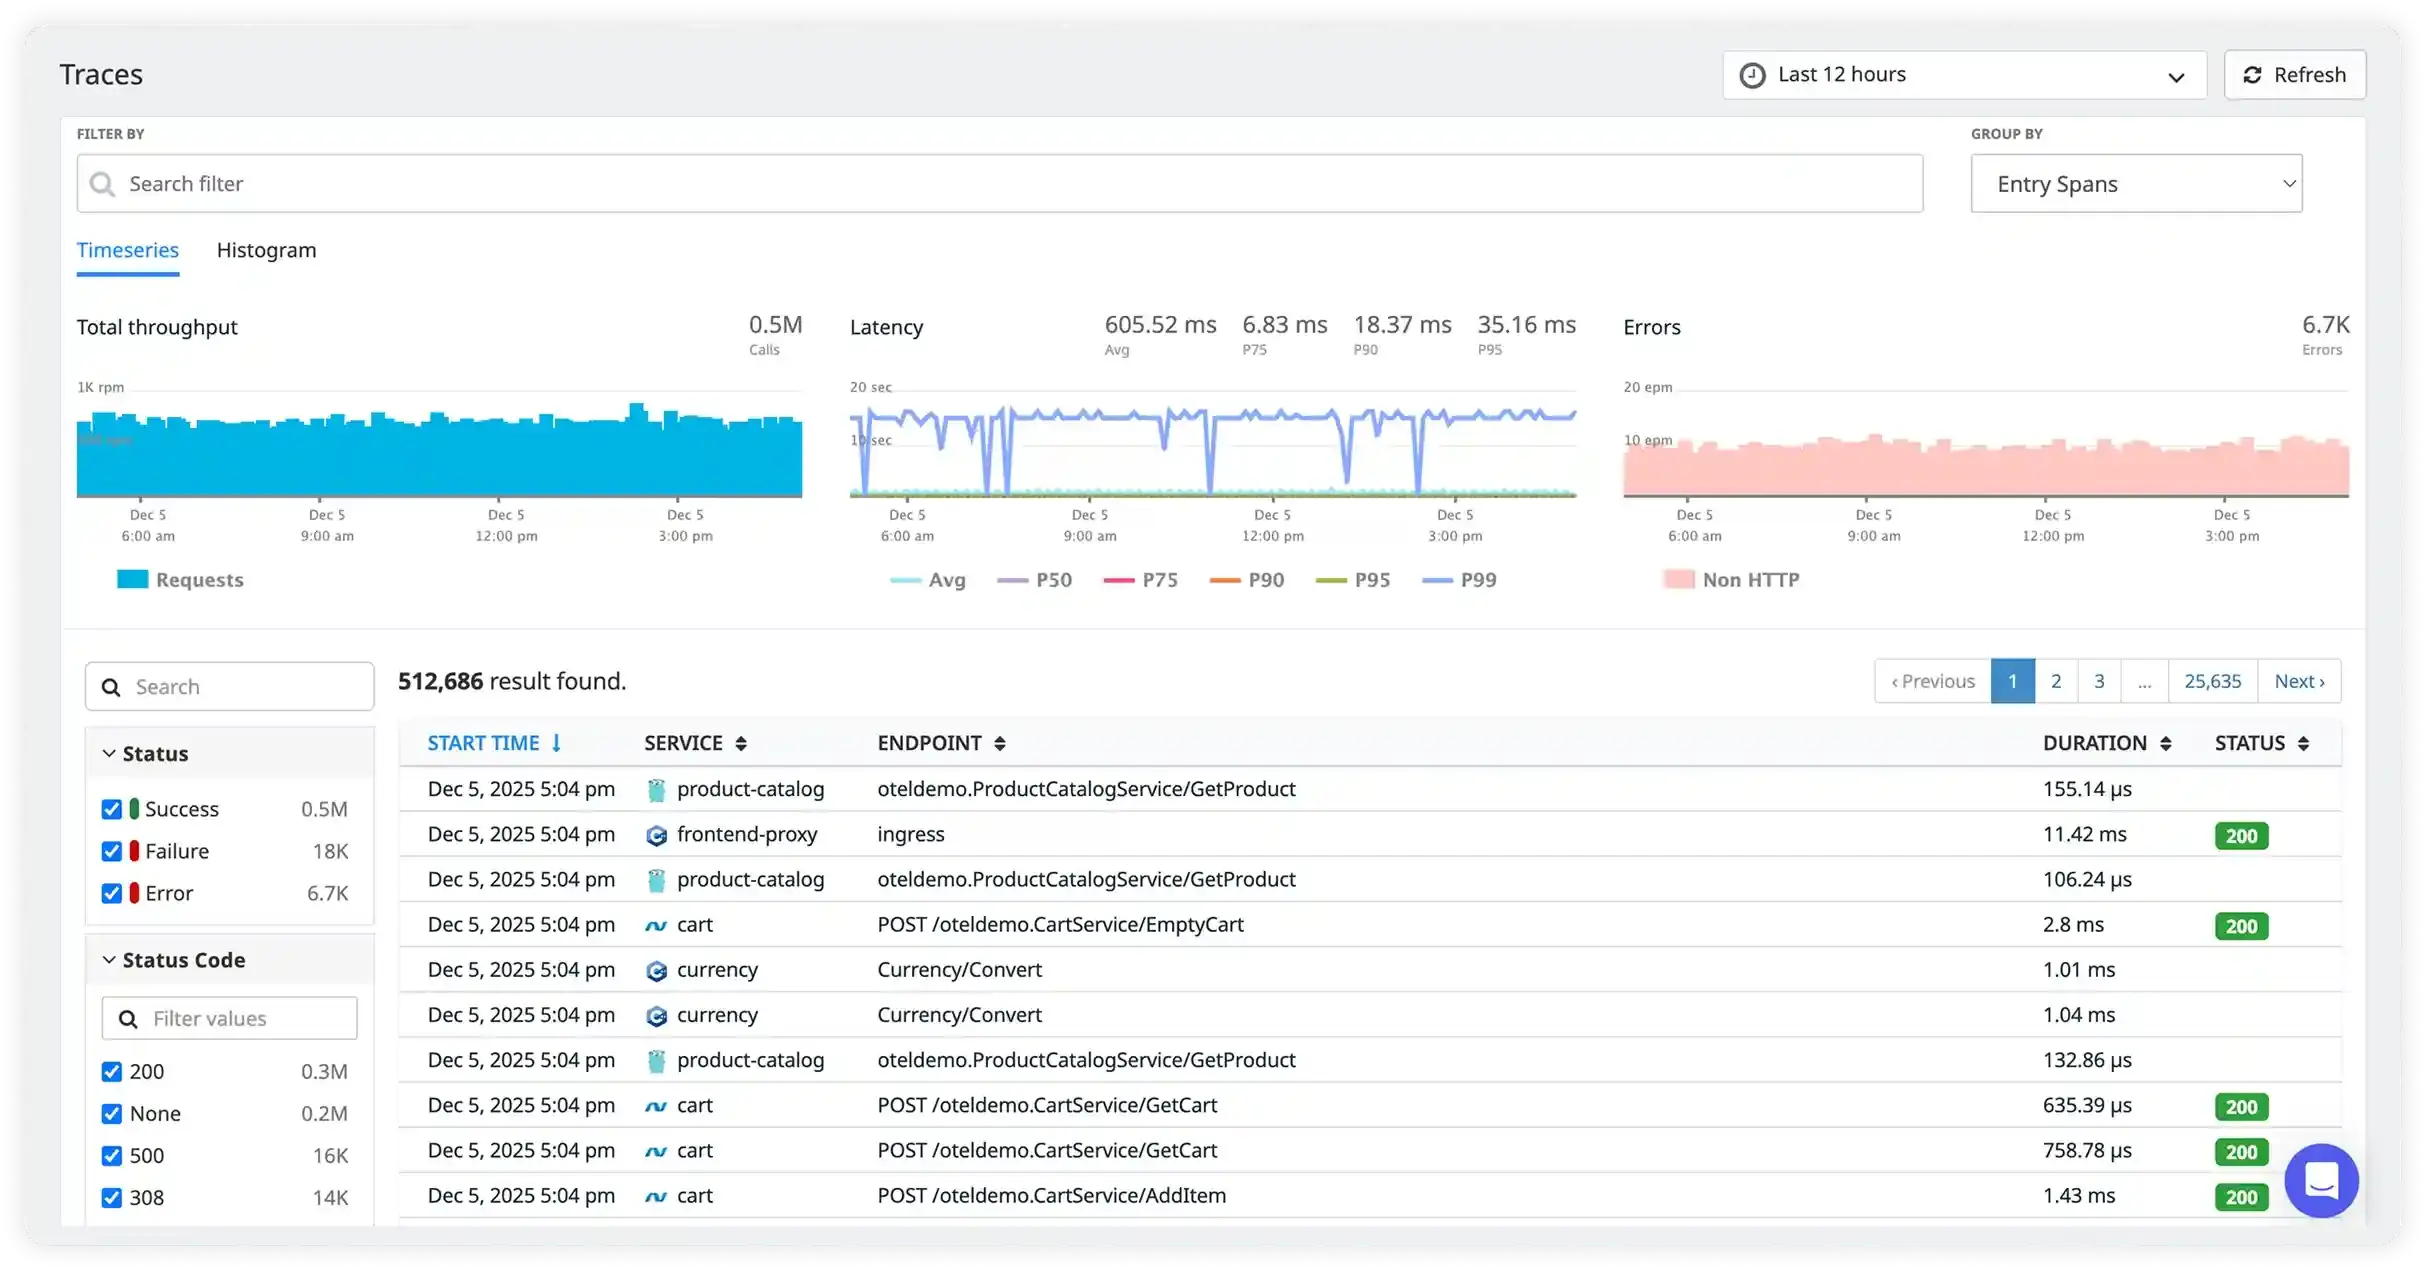
Follow every request across every service boundary
When a transaction slows down or fails, you need to see exactly which service, which call, and which line of code caused it. Atatus distributed tracing gives you a complete waterfall view across all your microservices without any manual instrumentation work.
- Automatic trace context propagation across HTTP, gRPC, and messaging queues
- Latency breakdown by service with p50/p95/p99 percentiles
- Error attribution at the exact span that failed
- OpenTelemetry-native that works with your existing instrumentation

See your entire microservices architecture at a glance
Atatus automatically discovers and maps every service-to-service relationship in your environment. When something breaks, you instantly see the blast radius which services are affected and which upstream caller caused it.
- Auto-discovered service topology, no manual configuration
- Real-time health status on every node and edge
- Traffic flow and error rate overlaid on the map
- Click any service to drill into its traces, logs, and metrics
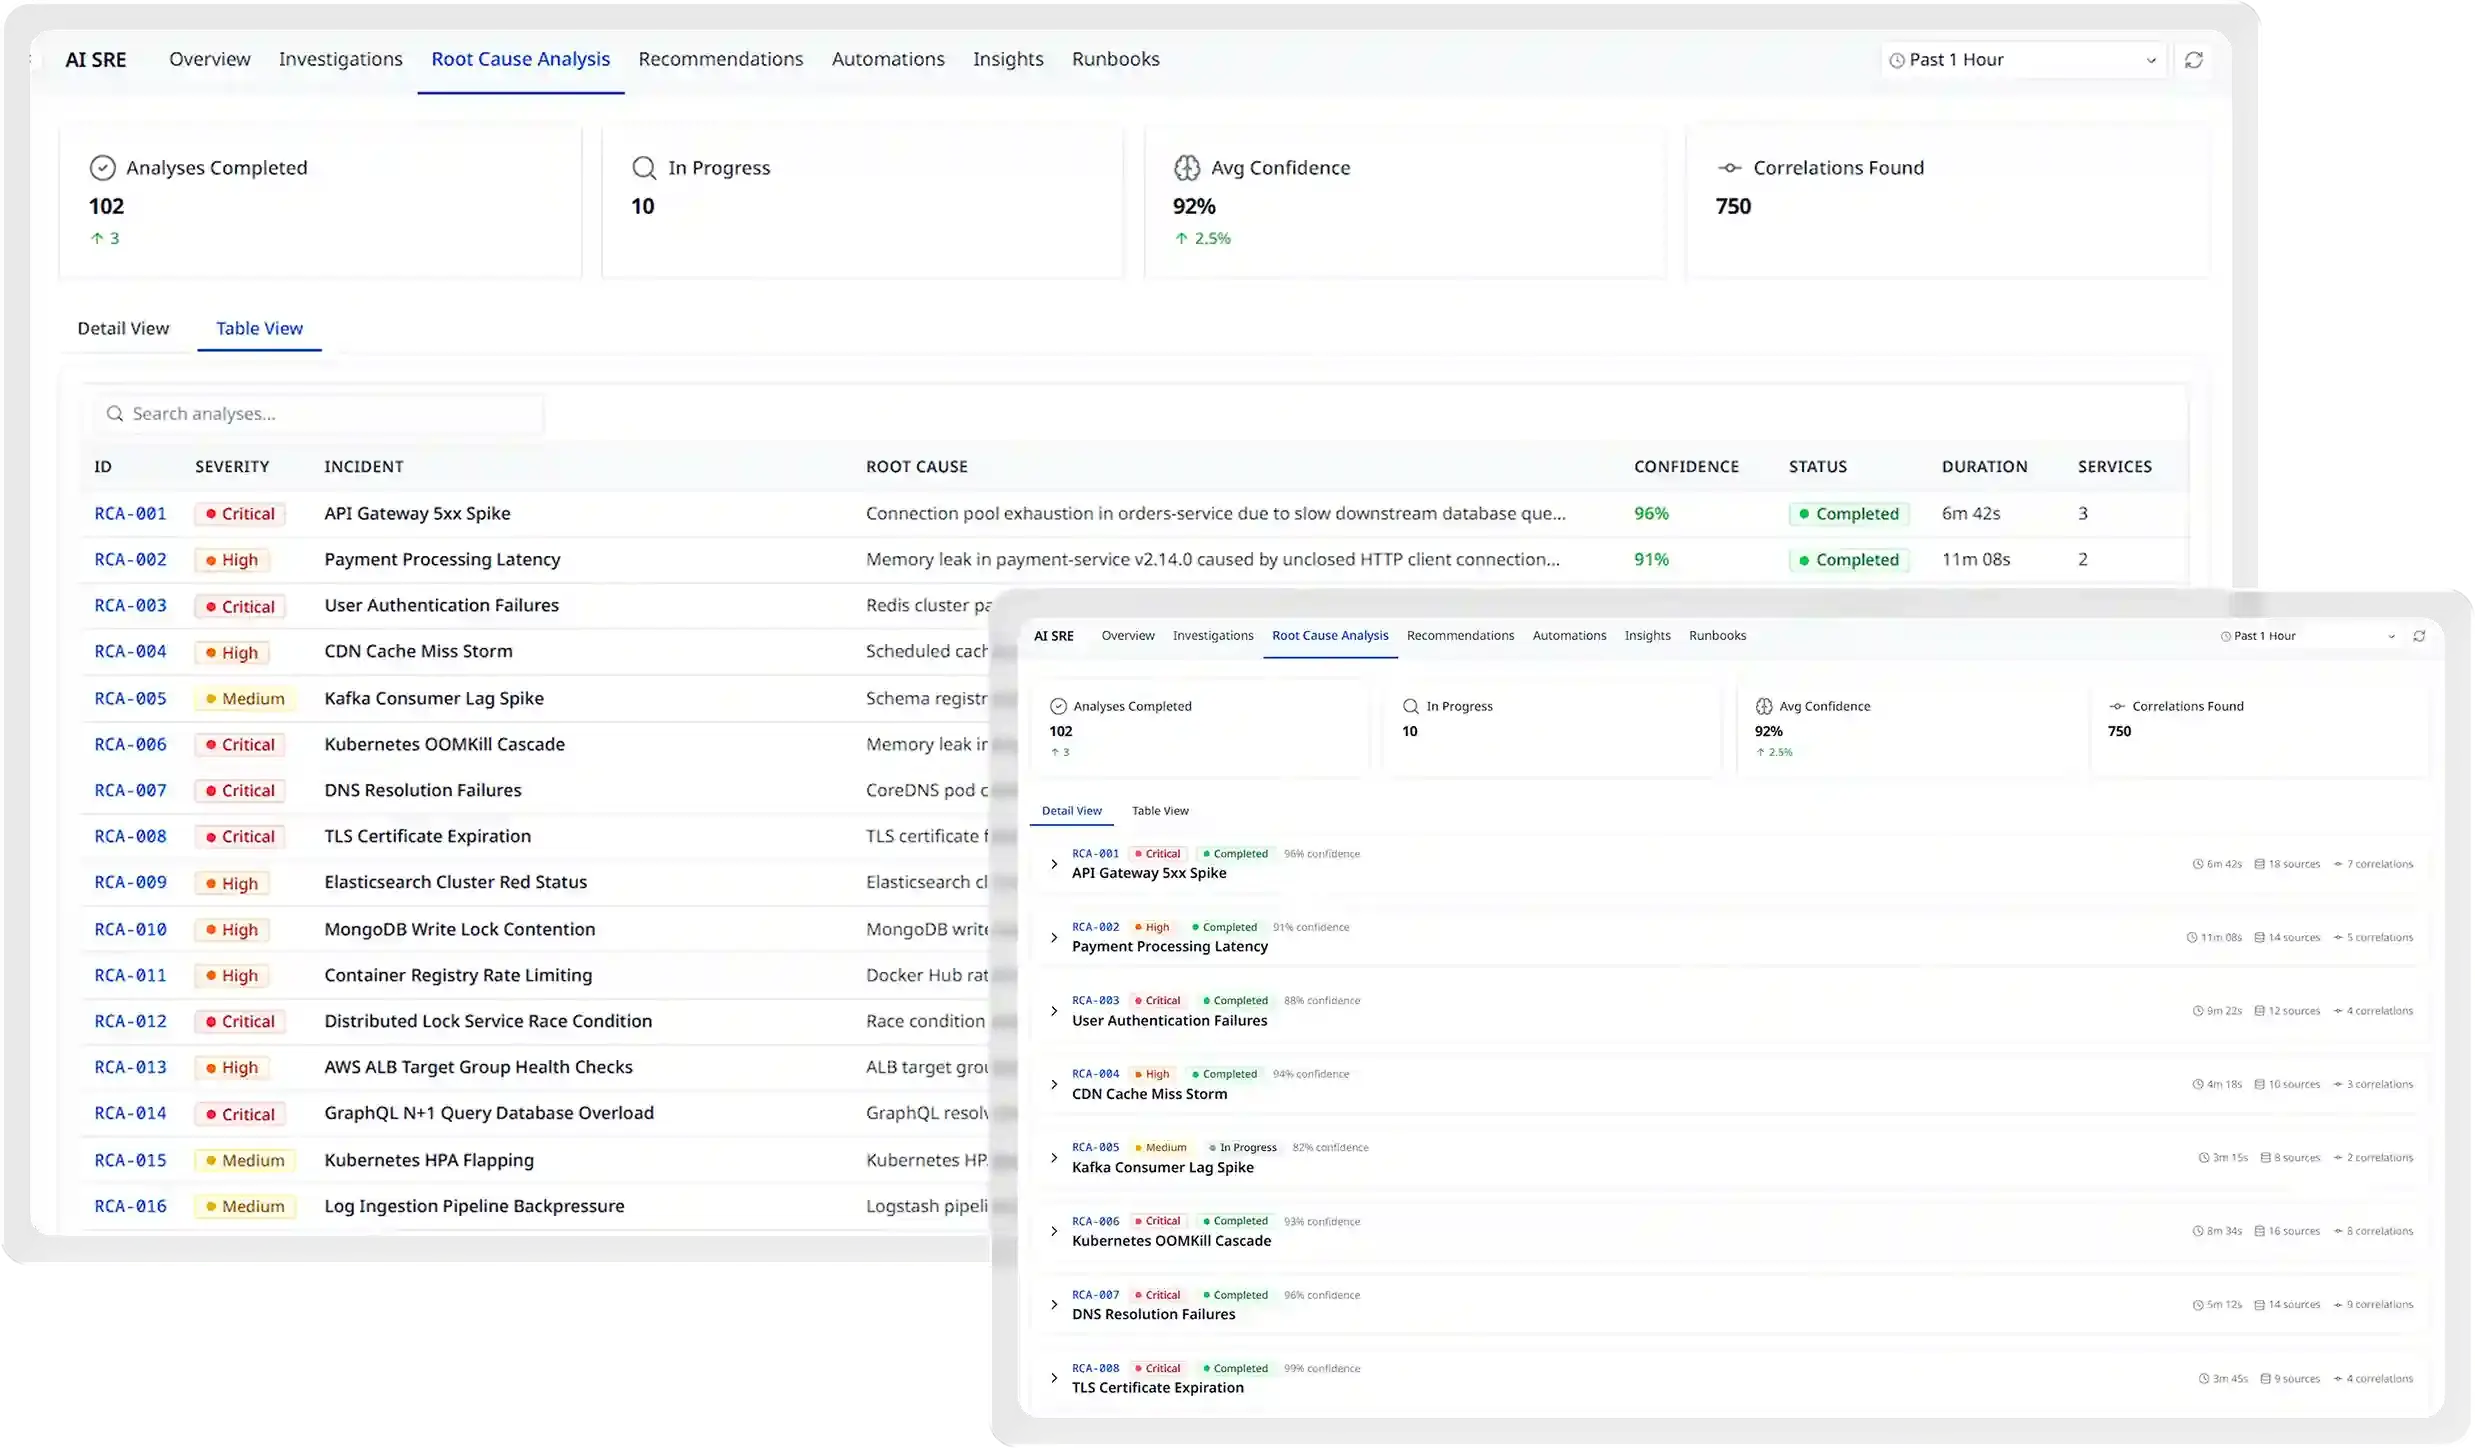
Cut MTTR from hours to minutes
Atatus correlates traces, logs, metrics, and deployment history automatically so your team arrives at the root cause in minutes, not after an hours-long investigation across multiple tools.
- Automated anomaly detection flags issues before users notice
- Deployment correlation links performance regressions to the exact release
- Related events grouped into a single incident timeline
- Suggested fixes powered by historical pattern matching
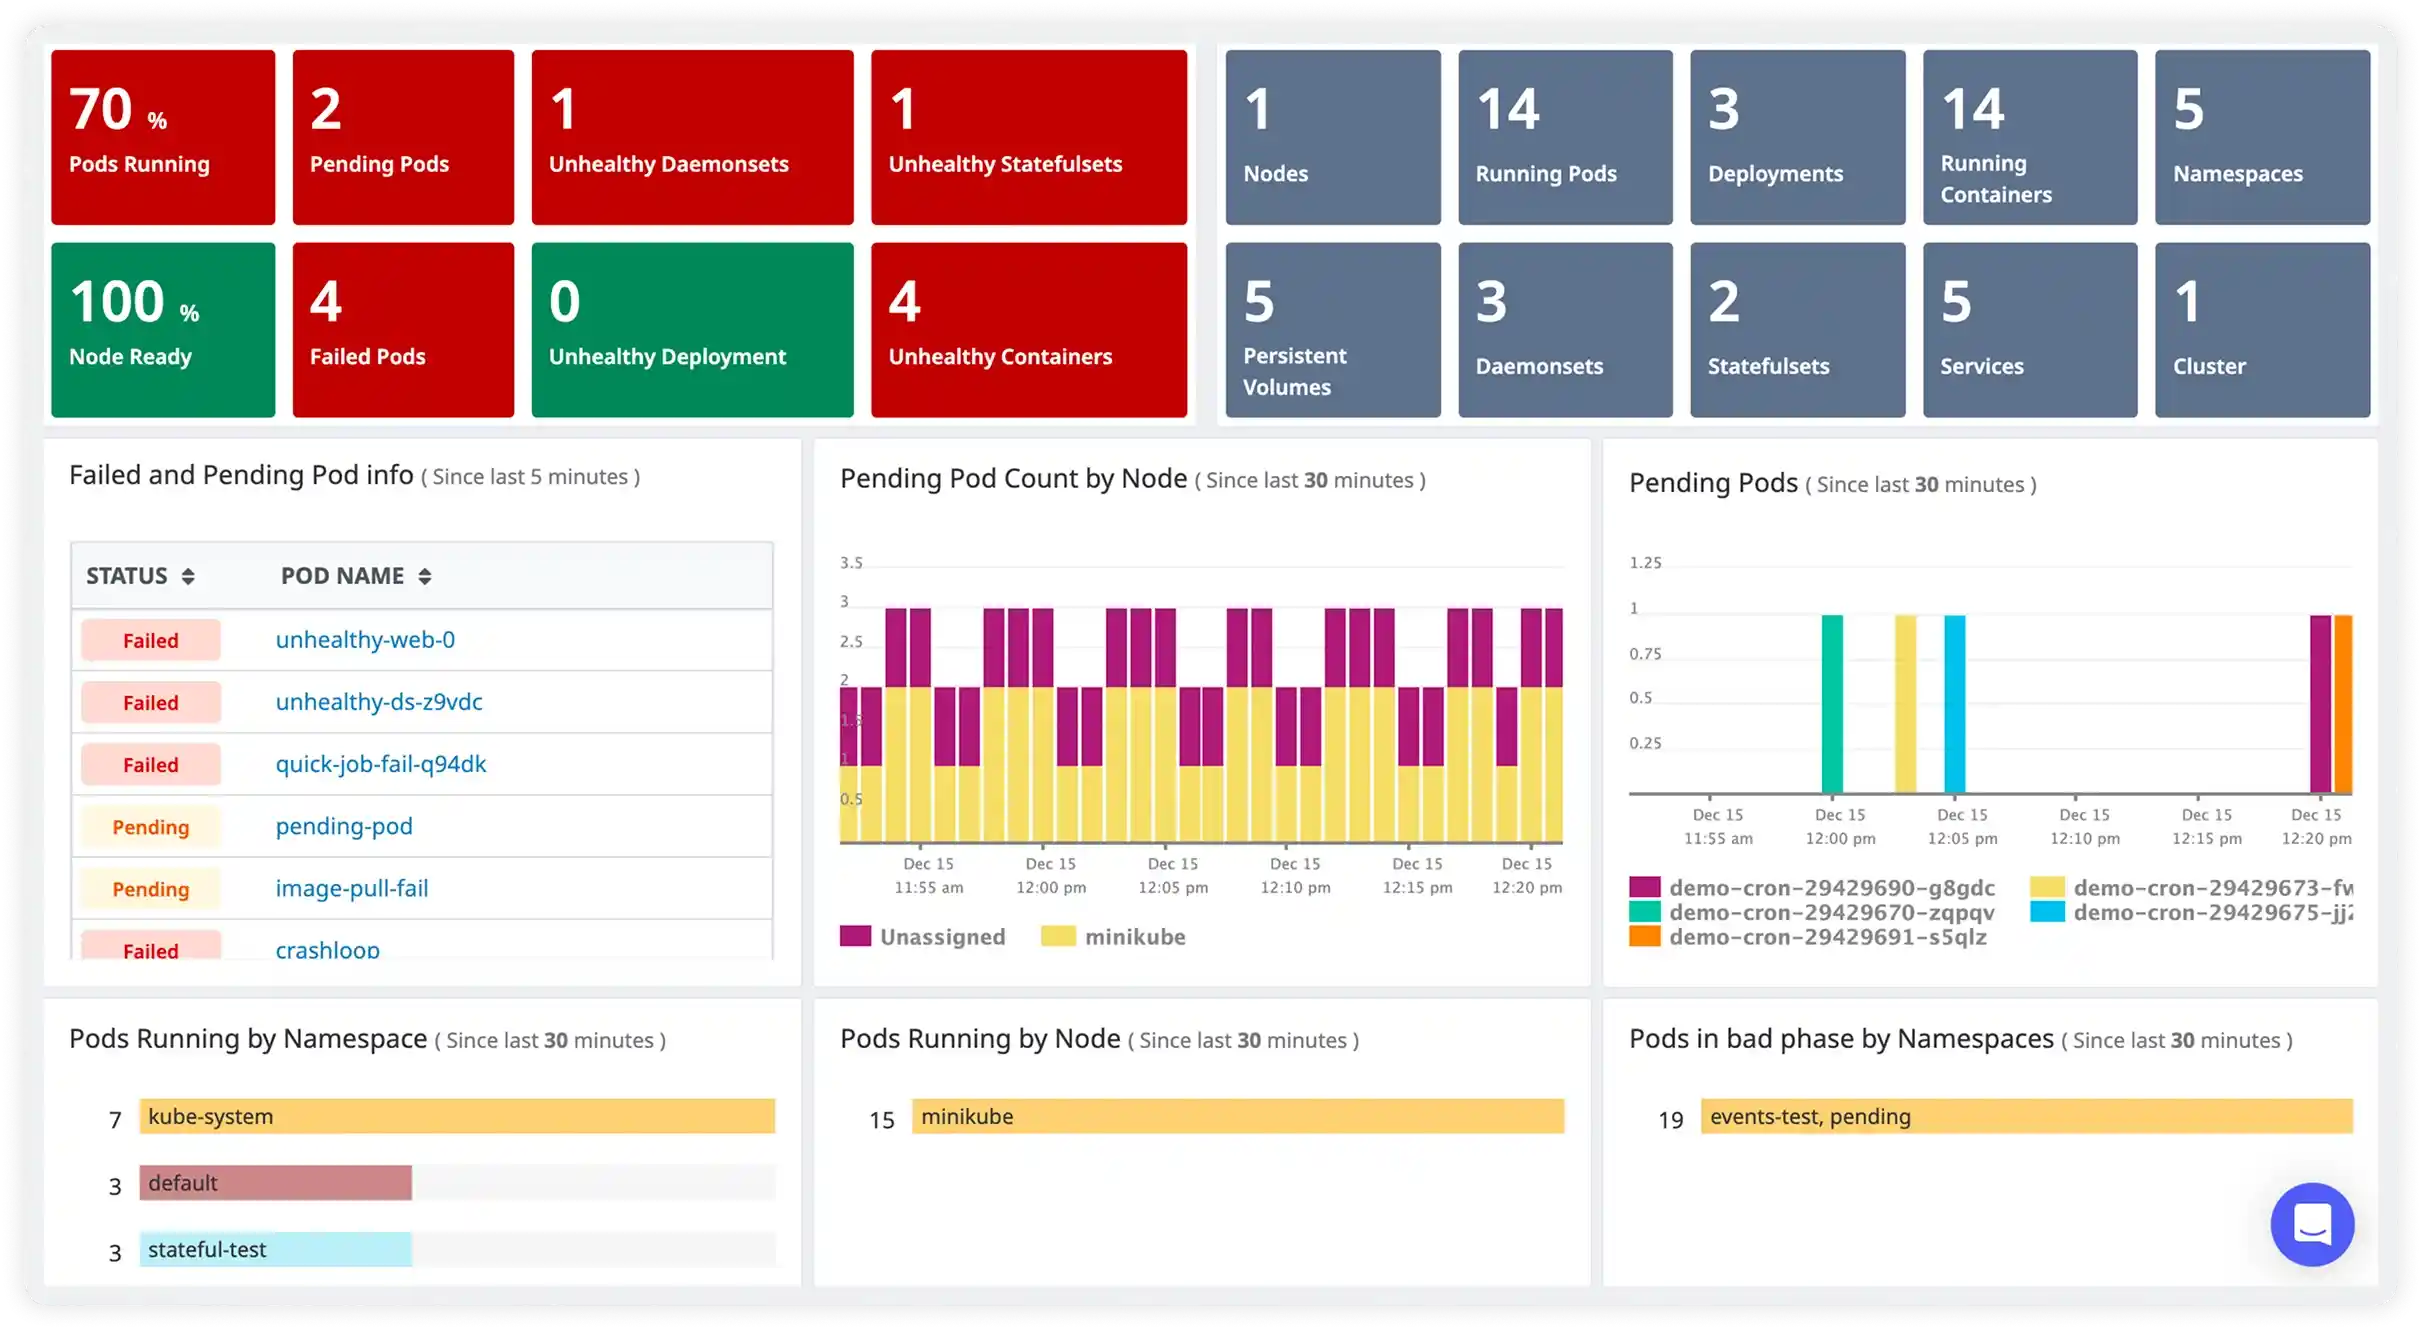
Full observability for every pod, node, and namespace
Atatus goes beyond surface-level Kubernetes metrics. Every pod event, resource pressure, and OOMKill is automatically linked to the traces and logs happening inside those containers, giving your team context that K8s dashboards alone can never provide.
- Pod, node, deployment, and namespace-level metrics
- Automatic correlation of K8s events to application traces
- Container resource saturation alerts before crashes
- Works with EKS, GKE, AKS, and self-managed Kubernetes
Observability that moves business metrics
Atatus customers don't just get better dashboards. They get measurable engineering and business outcomes.
Faster MTTR
Teams using Atatus resolve incidents in minutes, not hours, thanks to automated root cause correlation.
Fewer Alert Fatigue Events
Intelligent alert grouping reduces noise so on-call engineers focus only on signals that matter.
Faster Deployments
Unified deployment tracking and real-time performance feedback shortens release cycles.
Application Reliability
Proactive alerting and anomaly detection help teams maintain high availability across all services.
Reduced Cloud Waste
Infrastructure correlations surface over-provisioned resources and help right-size your Kubernetes clusters.
Instant Onboard
Install the Atatus agent and have your first traces and metrics flowing in under 10 minutes.
Everything enterprise-grade tools offer. None of the enterprise-grade friction.
Faster Deployment
Install the agent, get your first trace. No professional services engagement, no 30-day onboarding project.
Transparent Pricing
Predictable, volume-based pricing with no hidden data ingestion fees or per-seat penalties for large teams.
OpenTelemetry-Native
Built on open standards. Your existing OTel instrumentation works out of the box.
Full-Stack in One UI
APM, infrastructure, logs, traces, and real user monitoring correlated in a single pane of glass.
On-Prem Available
For teams with strict data residency or compliance requirements, Atatus offers full on-premises deployment.
Actionable Insights
Atatus doesn't just show you what happened. It tells you why, and suggests what to do next.
Plugs into your existing stack
Pre-built integrations for tools your team already uses. Connect in minutes, not days.
Unified Observability for Every Engineering Team
Atatus adapts to how engineering teams work across development, operations, and reliability.
Developers
Trace requests, debug errors, and identify performance issues at the code level with clear context.
DevOps
Track deployments, monitor infrastructure impact, and understand how releases affect application stability.
Release Engineer
Measure service health, latency, and error rates to maintain reliability and reduce production risk.
Powering better performance
for modern teams
Feedback from teams improving monitoring and debugging workflows
"Solid Product even better support", The integration path is incredibly simple/easy and the overall interface is very intuitive. That said, I had a handful of odd use cases that the support team was incredibly responsive in helping me work through.

Wes D
Site Reliability Engineer