Jump from Log Line → Full Trace in One Click
Click any log error and see the complete distributed trace it belongs to - spans across every service, DB queries, external calls, and the exact line of code. No copy-pasting trace IDs between tabs.
Atatus unifies logs, traces, and metrics into a single correlated timeline, so your team diagnoses incidents in minutes, not hours, regardless of how many services are involved.
Bring logs, traces, and metrics together in a single view to understand system behavior, investigate issues faster, and gain the context needed to resolve incidents with confidence.
Atatus automatically parses logs in JSON, syslog, Apache, NGINX, and 300+ other formats out of the box. No pipelines to manage, no parsing rules to maintain. Send logs and start querying immediately.
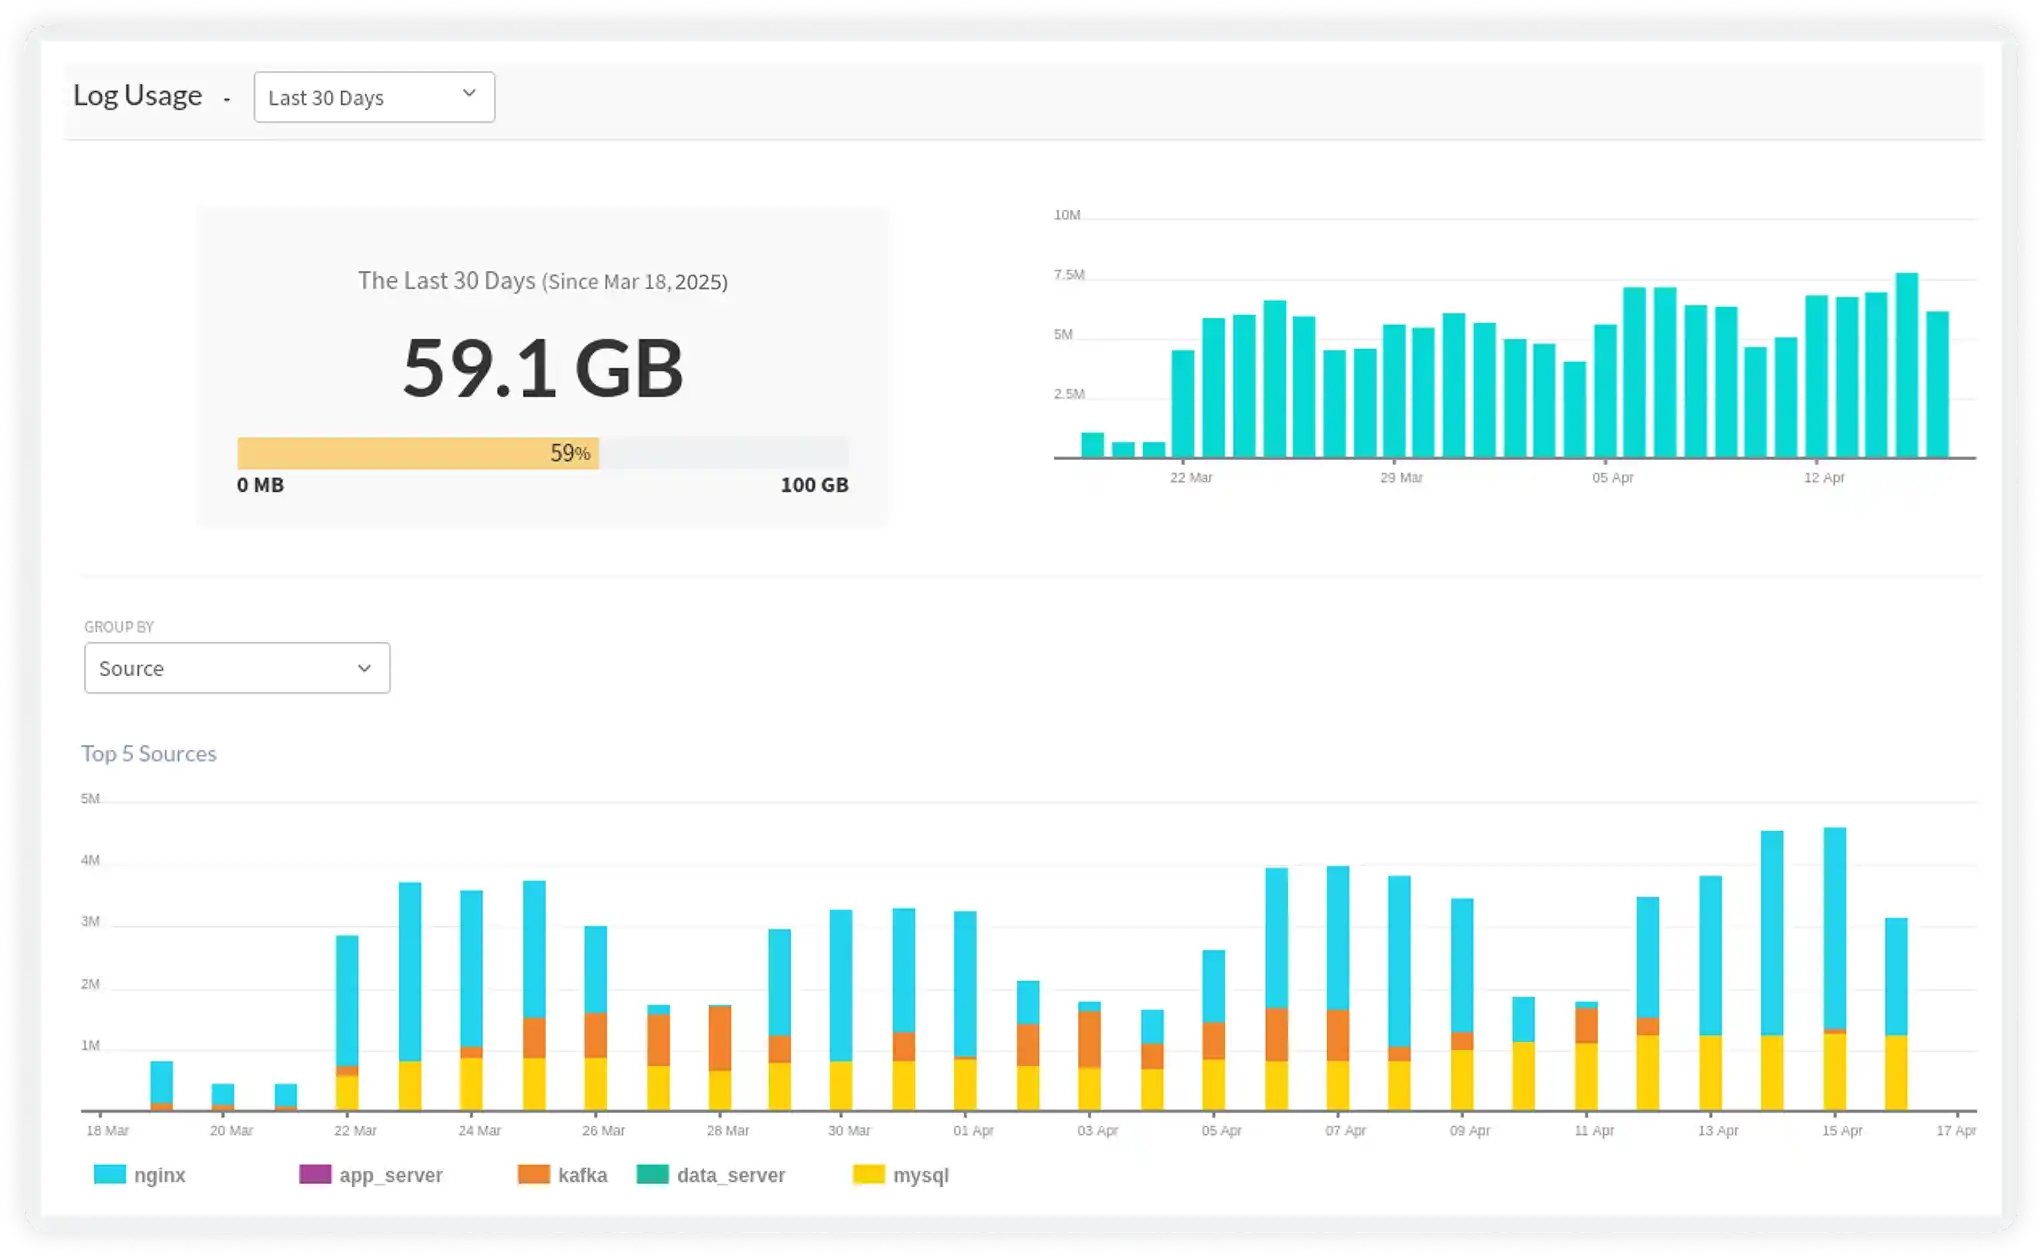
Atatus Log Explorer gives every engineer, not just the ones who know the query syntax. The ability to slice, filter, and investigate at any scale. No indexes to pre-build, no cluster to tune.
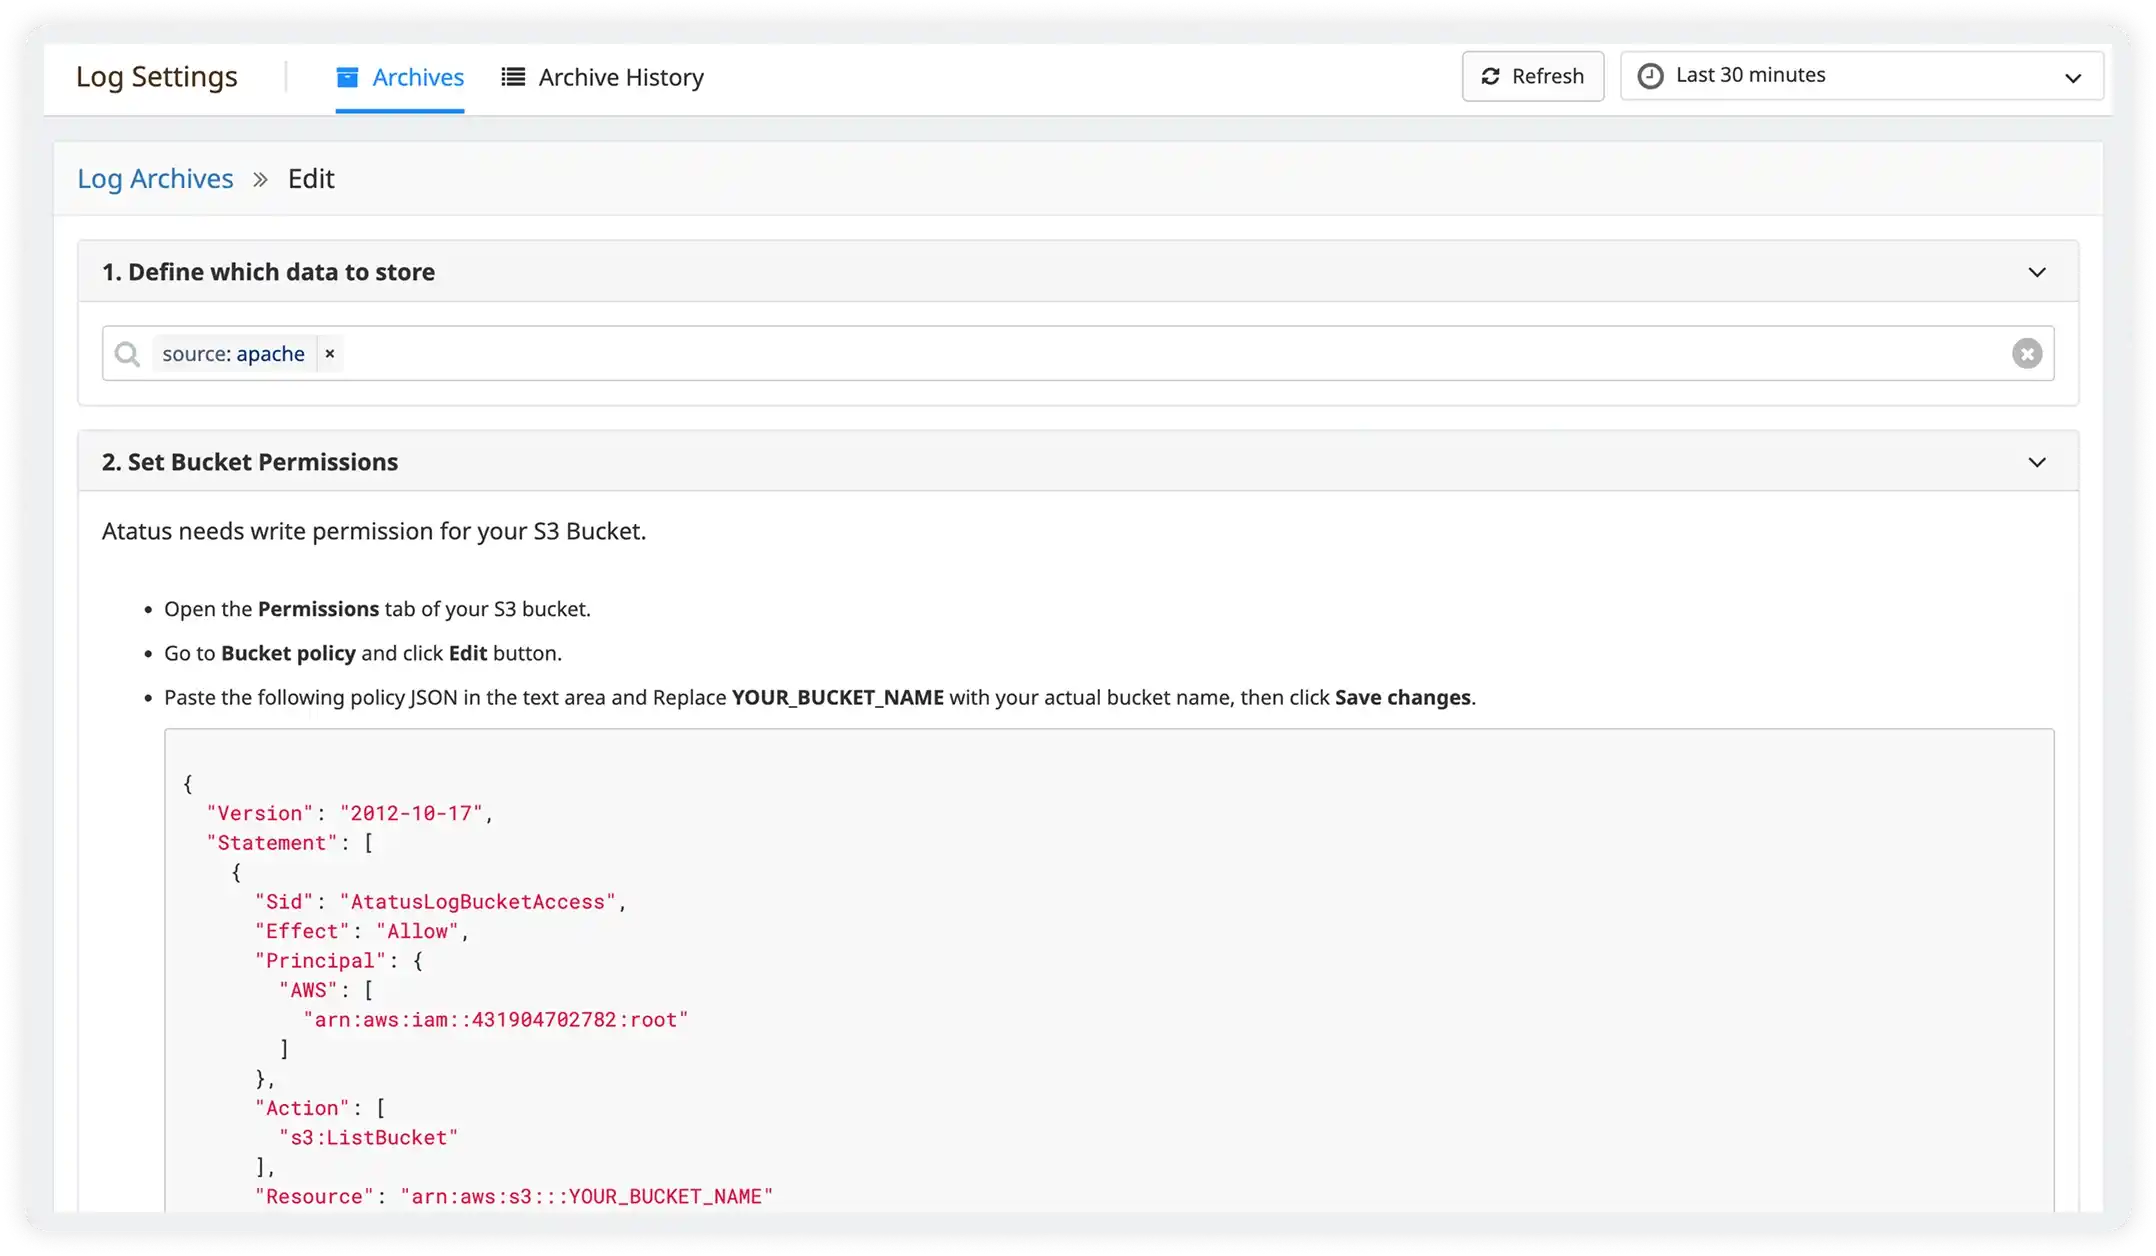
Atatus automatically links log lines, traces, and metrics that share a common trace ID, request ID, or user session, so the full chain of events is one click away, not one hour away.
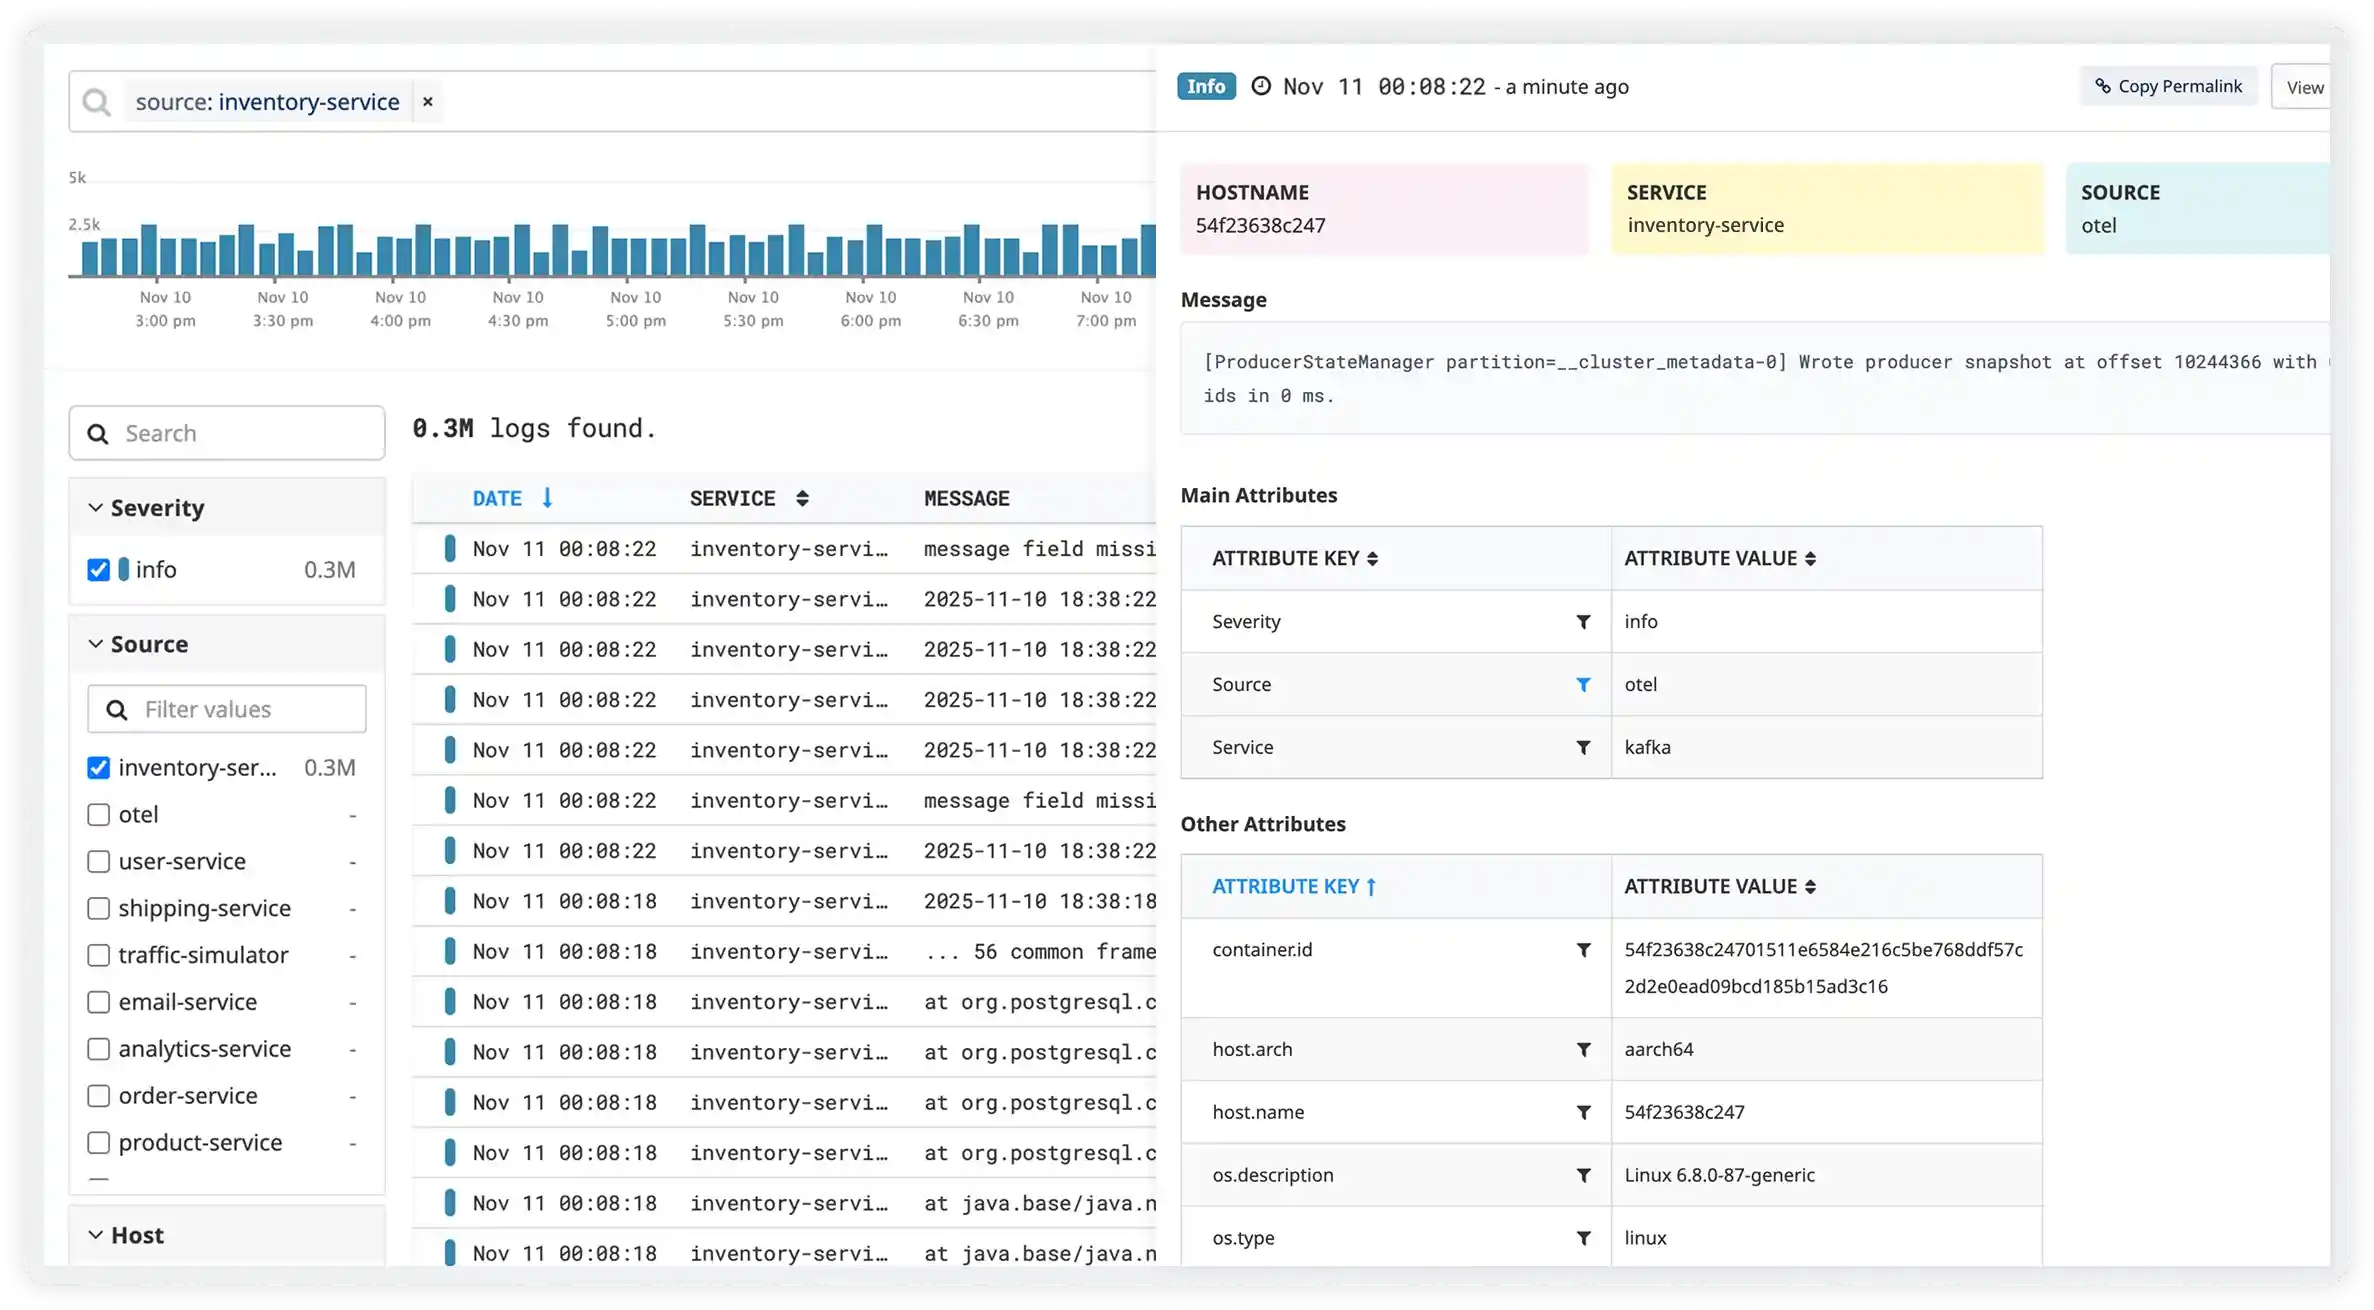
Click any log error and see the complete distributed trace it belongs to - spans across every service, DB queries, external calls, and the exact line of code. No copy-pasting trace IDs between tabs.
Atatus clusters log lines by structure, not keyword. During an incident you see 40 distinct patterns ranked by volume and error rate, not a raw firehose you have to scroll through manually.
Every deployment, config change, and auto-scaling event is overlaid directly on your log volume and error rate graphs. Spot the correlation between a deploy and an error spike in seconds, not by asking in Slack.
Group all logs for a single checkout, API call, or background job across every service it touched, ordered by timestamp. See exactly where it spent time, where it errored, and what the state was at each step.
Stream logs live with real-time filters on any field: user_id, order_id, http.status >= 500. Watch exactly what a specific user or request is doing right now, without spinning up a terminal session.
Define a metric from any log query. e.g., count of checkout_success events per minute and track it as a time-series. Build SLO dashboards directly from logs without a separate metrics pipeline.
Atatus adapts to how engineering teams work across development, operations, and reliability.
Debug errors and slow paths with the full context of what happened.
Atatus for developersTrack deployments and see how each release affects stability.
Atatus for DevOpsWatch latency and error rates to ship with less production risk.
Atatus for release engineers"Solid Product even better support." The integration path is incredibly simple/easy and the overall interface is very intuitive. That said, I had a handful of odd use cases that the support team was incredibly responsive in helping me work through.
Pricing, deployment, data and the agent. If something is missing, a person will answer it on a demo call.
Very low disruption. Atatus has a native Elasticsearch-compatible endpoint, so you can add Atatus as a second output to your existing pipeline without touching your log agents. Most teams run both in parallel for 2–4 weeks, validate parity, then cut over. Total migration time for a 20-service stack is typically under a day of engineering effort.
Atatus automatically picks up W3C traceparent headers and OpenTelemetry context if you're already using distributed tracing — zero code changes. If your services don't emit trace IDs yet, Atatus can correlate via shared request IDs, session tokens, or user IDs that already appear in your logs. For full end-to-end correlation we recommend the Atatus APM agent (15-minute install), but partial correlation works from day one.
Atatus pricing is based on your average daily ingestion volume, not peak. We handle burst ingest transparently — you won't get throttled or lose data during traffic spikes. If a peak consistently becomes your new baseline, we'll discuss a plan adjustment. No surprise bills for a Black Friday event or a viral launch moment.
Yes. Atatus has an in-pipeline PII scrubbing processor that redacts emails, SSNs, credit cards, phone numbers, and custom regex patterns before logs hit storage — not after. We're SOC 2 Type II certified and support HIPAA Business Associate Agreements. Data residency options (US, EU, APAC) are available on our Enterprise plan. We can walk through your specific compliance requirements on a call.
At equivalent log volume (typically 50–500GB/day), Atatus customers report 40–60% lower total cost compared to Datadog, primarily because Datadog charges for both ingestion and indexing as separate line items. Atatus includes both in a single volume-based price. Our free trial includes a cost comparison worksheet — plug in your current volume and Datadog bill, and we'll show you the exact delta. We also don't charge per user seat.
Yes — Atatus is designed for hybrid environments. The lightweight Atatus agent runs on bare metal, VMs, and Kubernetes equally. Logs from on-prem services are shipped over a secure, compressed connection to Atatus's SaaS platform and correlated with cloud logs in the same timeline and query interface. If your compliance requirements prevent sending logs off-prem, ask us about Atatus On-Premises deployment.
Typical time-to-first-value is under 30 minutes: install the agent, point your log shipper, and you'll be querying live logs in your first session. Most teams have their first saved alert and dashboard within the first week — no professional services engagement required. We offer a free onboarding call for teams with 10+ services to walk through best practices for your specific stack.
Start free and send your first trace with OpenTelemetry or the Atatus agents. APM, logs, RUM, infrastructure and SIEM, all on one timeline.