API performance issues that you should know
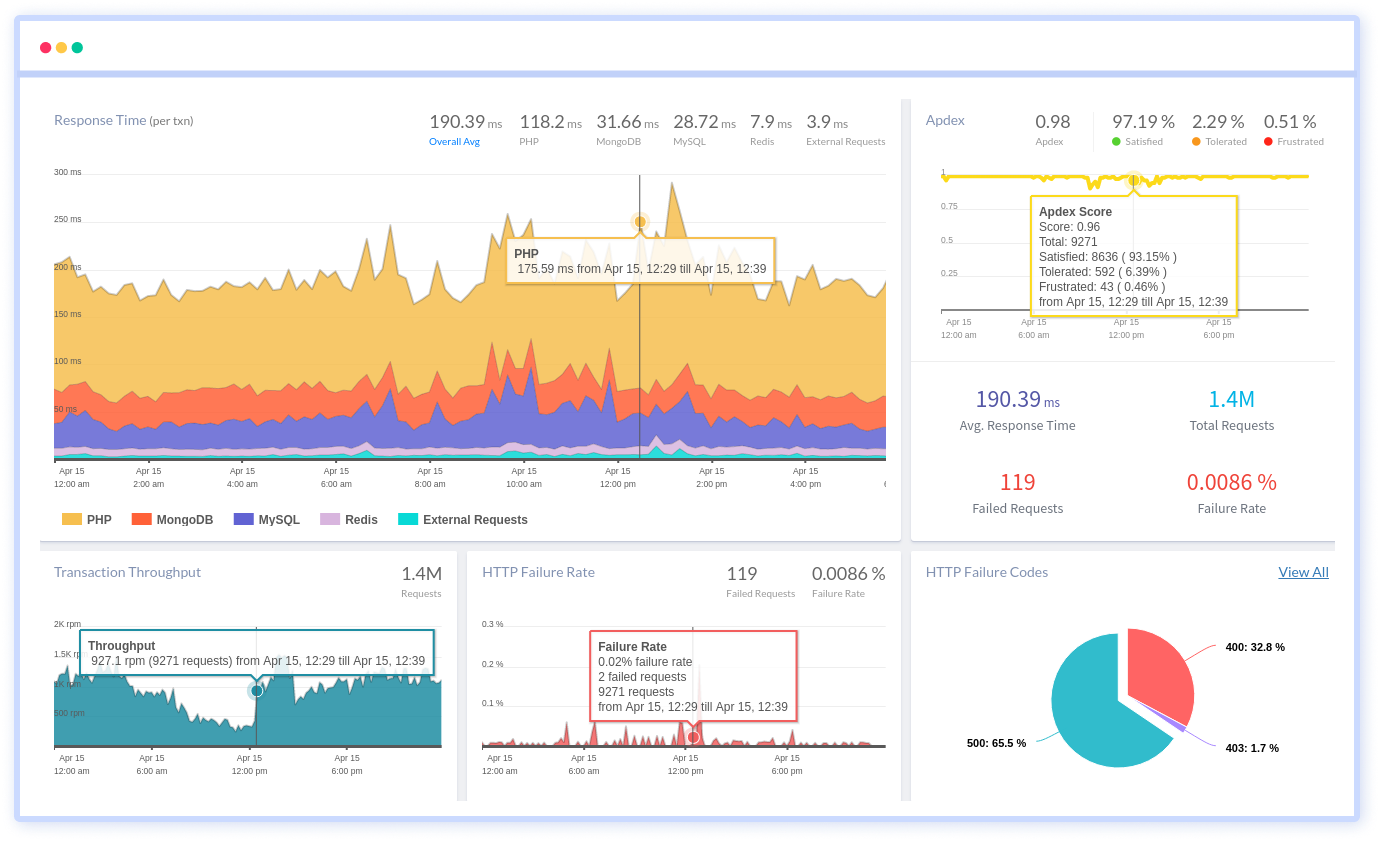
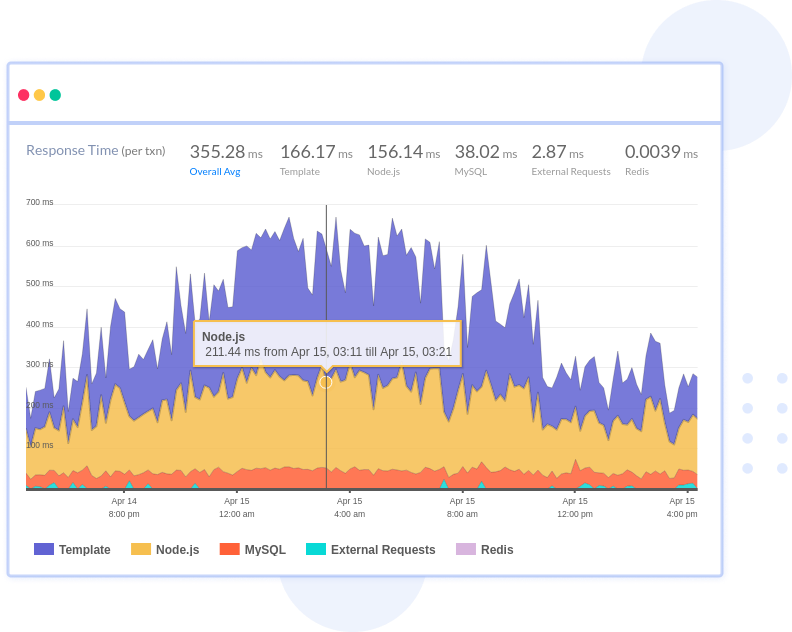
What's the request and response time of each API endpoints?
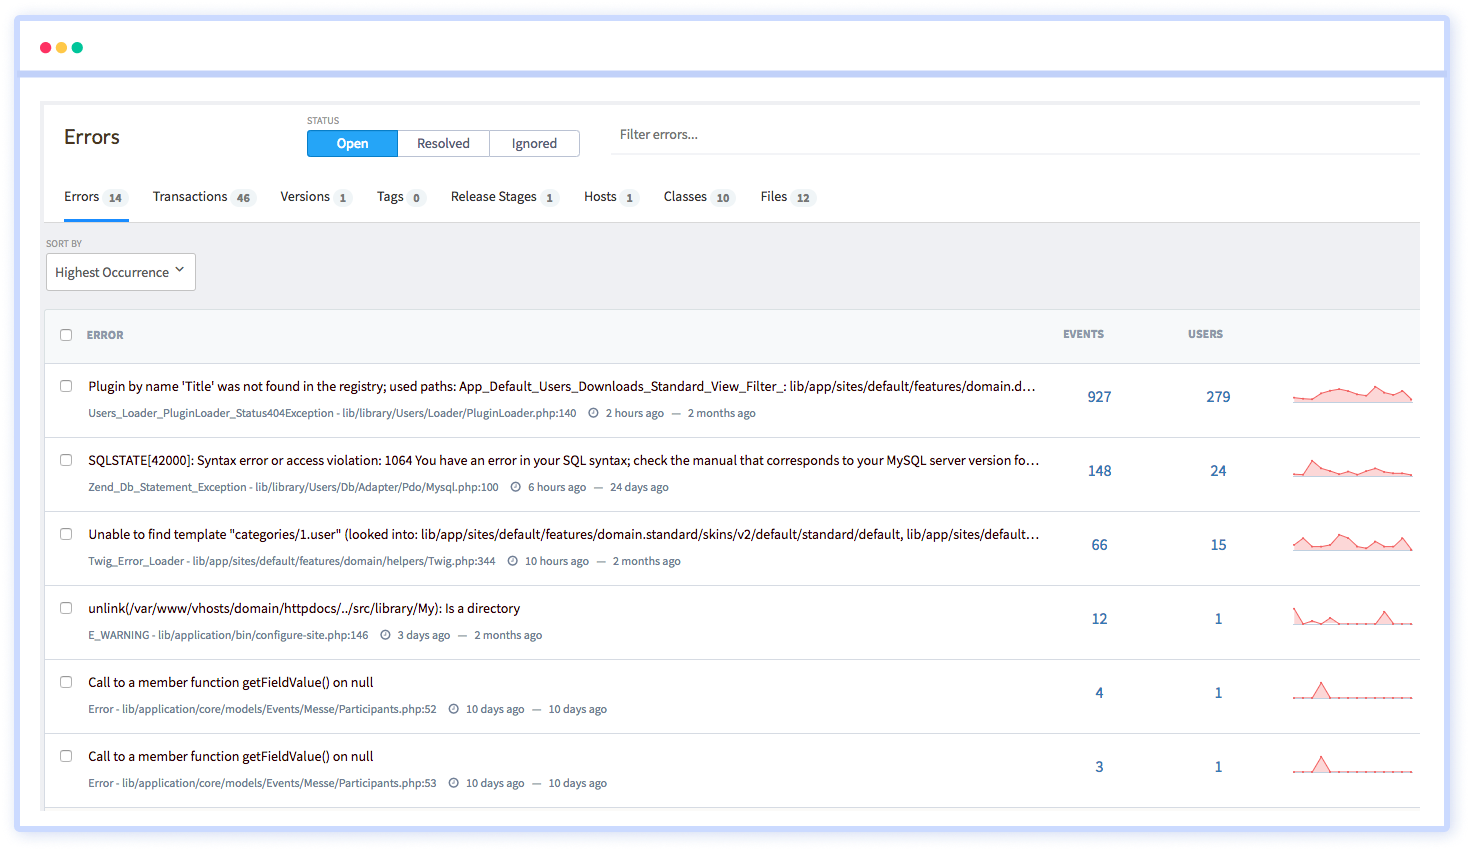
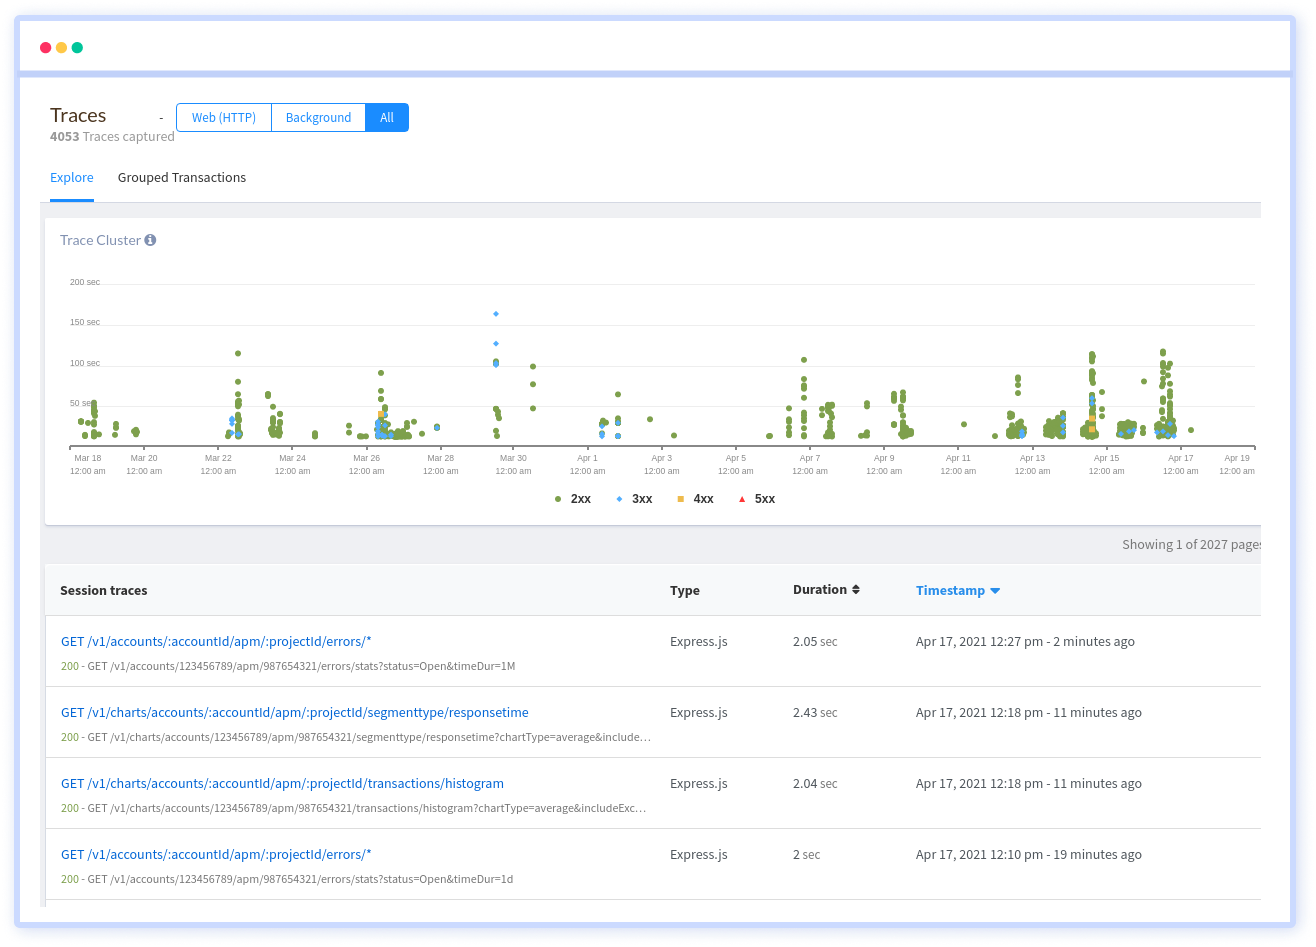
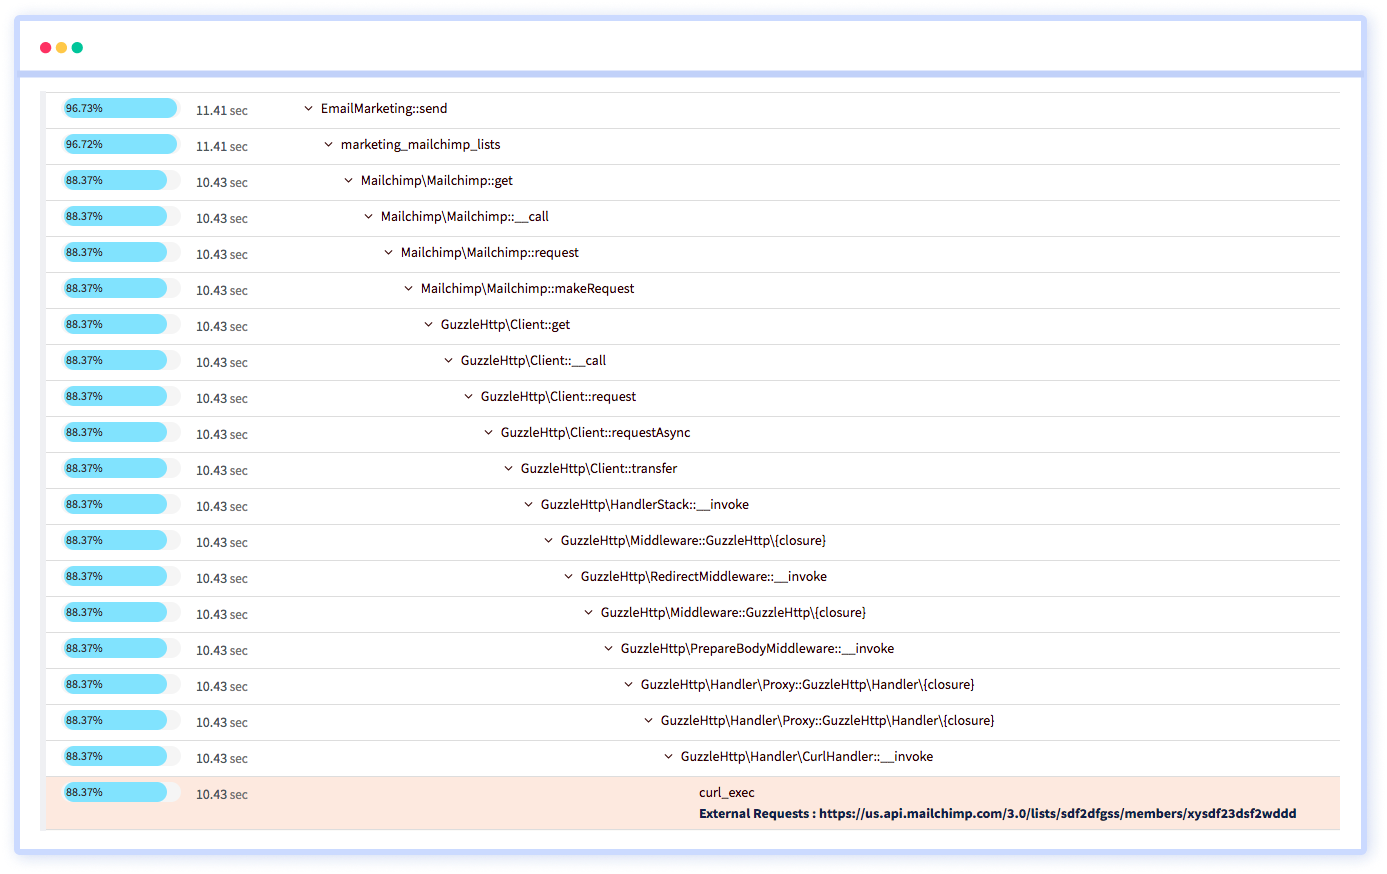
What's the sequence of transactions leading to errors?
What are the slowest db queries that are affecting your application?
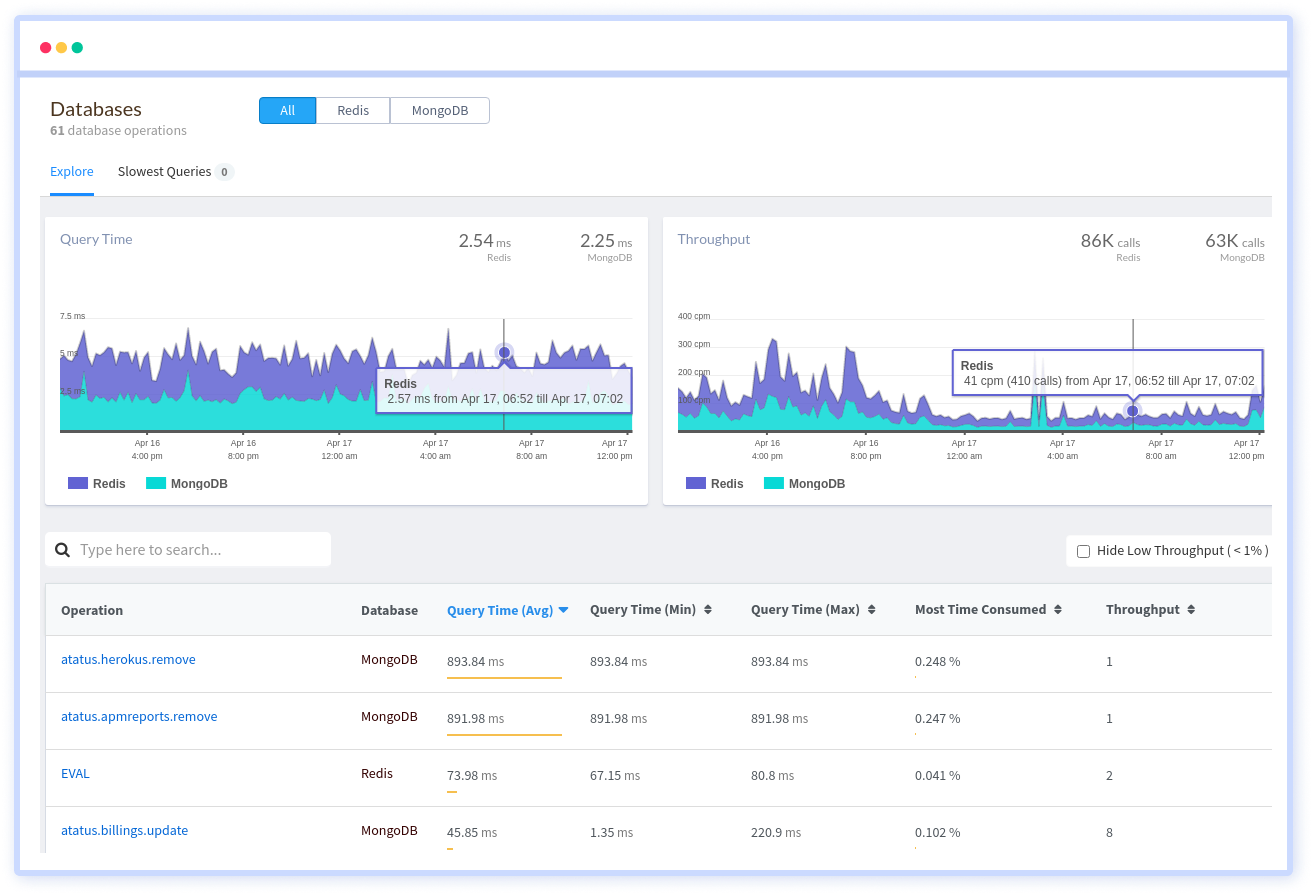
What are the top most time consuming transactions?
Where is my API experiencing higher latency?
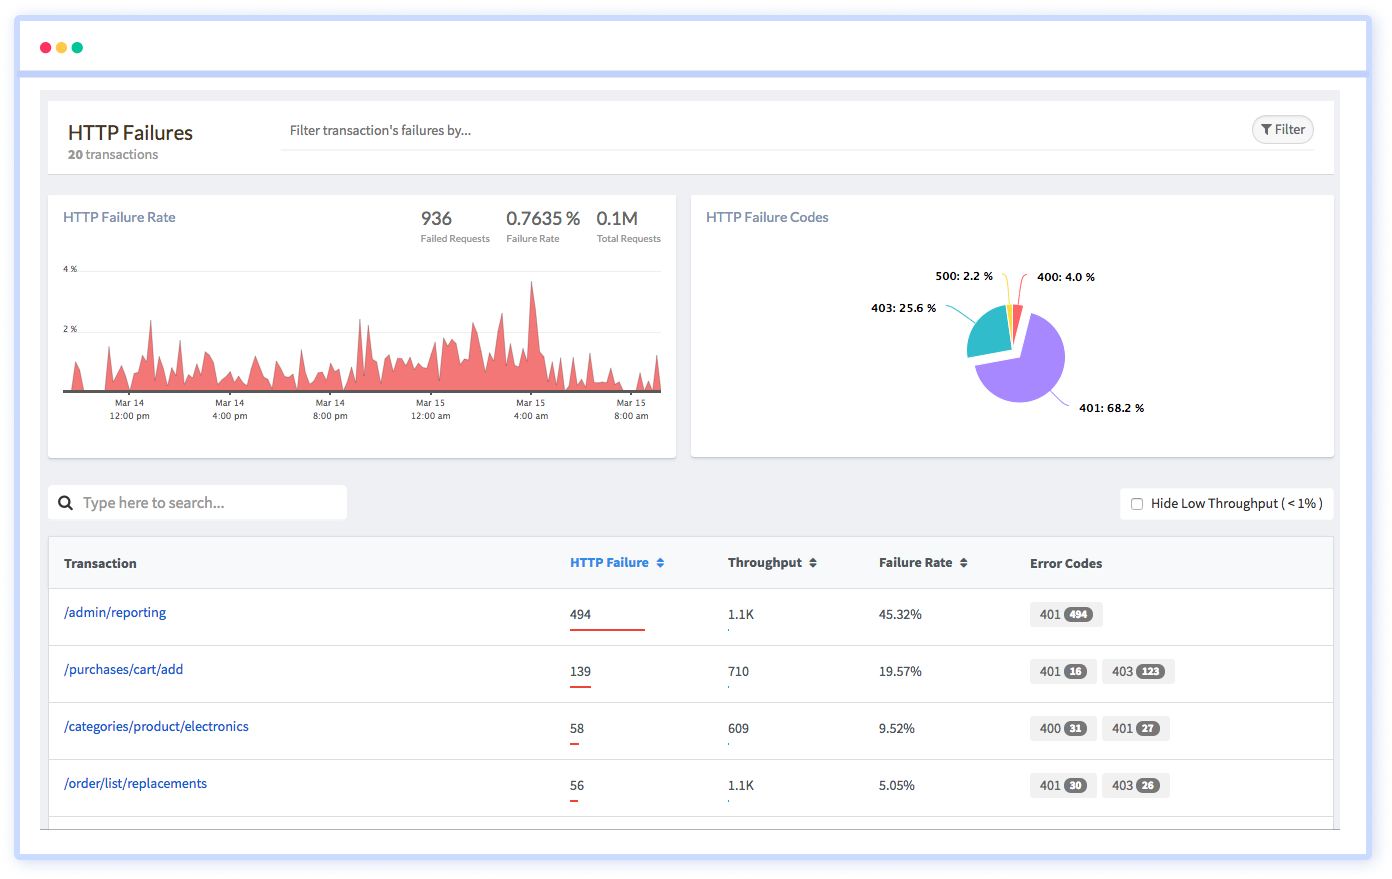
What's the status code of your each request?


 +1-760-465-2330


