CatchJS Alternative at a Lower Cost
CatchJS stops at reporting issues, leaving gaps in understanding the root cause. Atatus provides deep observability by correlating logs, metrics, and traces, giving you complete context for faster diagnosis and resolution.
Free Sign Up. No Credit Card Required. Cancel Anytime.
Why Atatus is the Best Alternative to CatchJS?
Tired of extra costs? Switch to Atatus - a cheaper alternative to CatchJS that helps you save and perform better.
CatchJS
High Costs & Unpredictable Pricing
User-based pricing models lead to unpredictable bills with hidden fees and overage charges that can quickly escalate.
Complex Setup & Steep Learning Curve
Time-consuming deployment processes require significant technical resources and extensive training for teams.
High Infrastructure Overhead
Resource-intensive installations increase infrastructure costs and maintenance burden on your systems.
Atatus Advantages
Save up to 4x on Costs
Transparent host-based pricing without hidden fees or overage charges. Budget-friendly for startups and growing teams.
Quick Setup & Easy to Use
Straightforward deployment process gets you up and running quickly. Intuitive interface requires minimal training.
Minimum Overhead
Lightweight agent with minimal resource footprint reduces infrastructure requirements and operational costs.
Transparent Pricing
Clear, predictable pricing based on actual usage. No surprises, no user limits, just fair pricing that scales with you.
Free 24/7 Support
Unlike competitors, we provide round-the-clock support at no extra cost to help you maximize your ROI.
Enterprise-Grade Security
Industry-standard encryption for data in transit and at rest, ensuring your sensitive information stays protected.
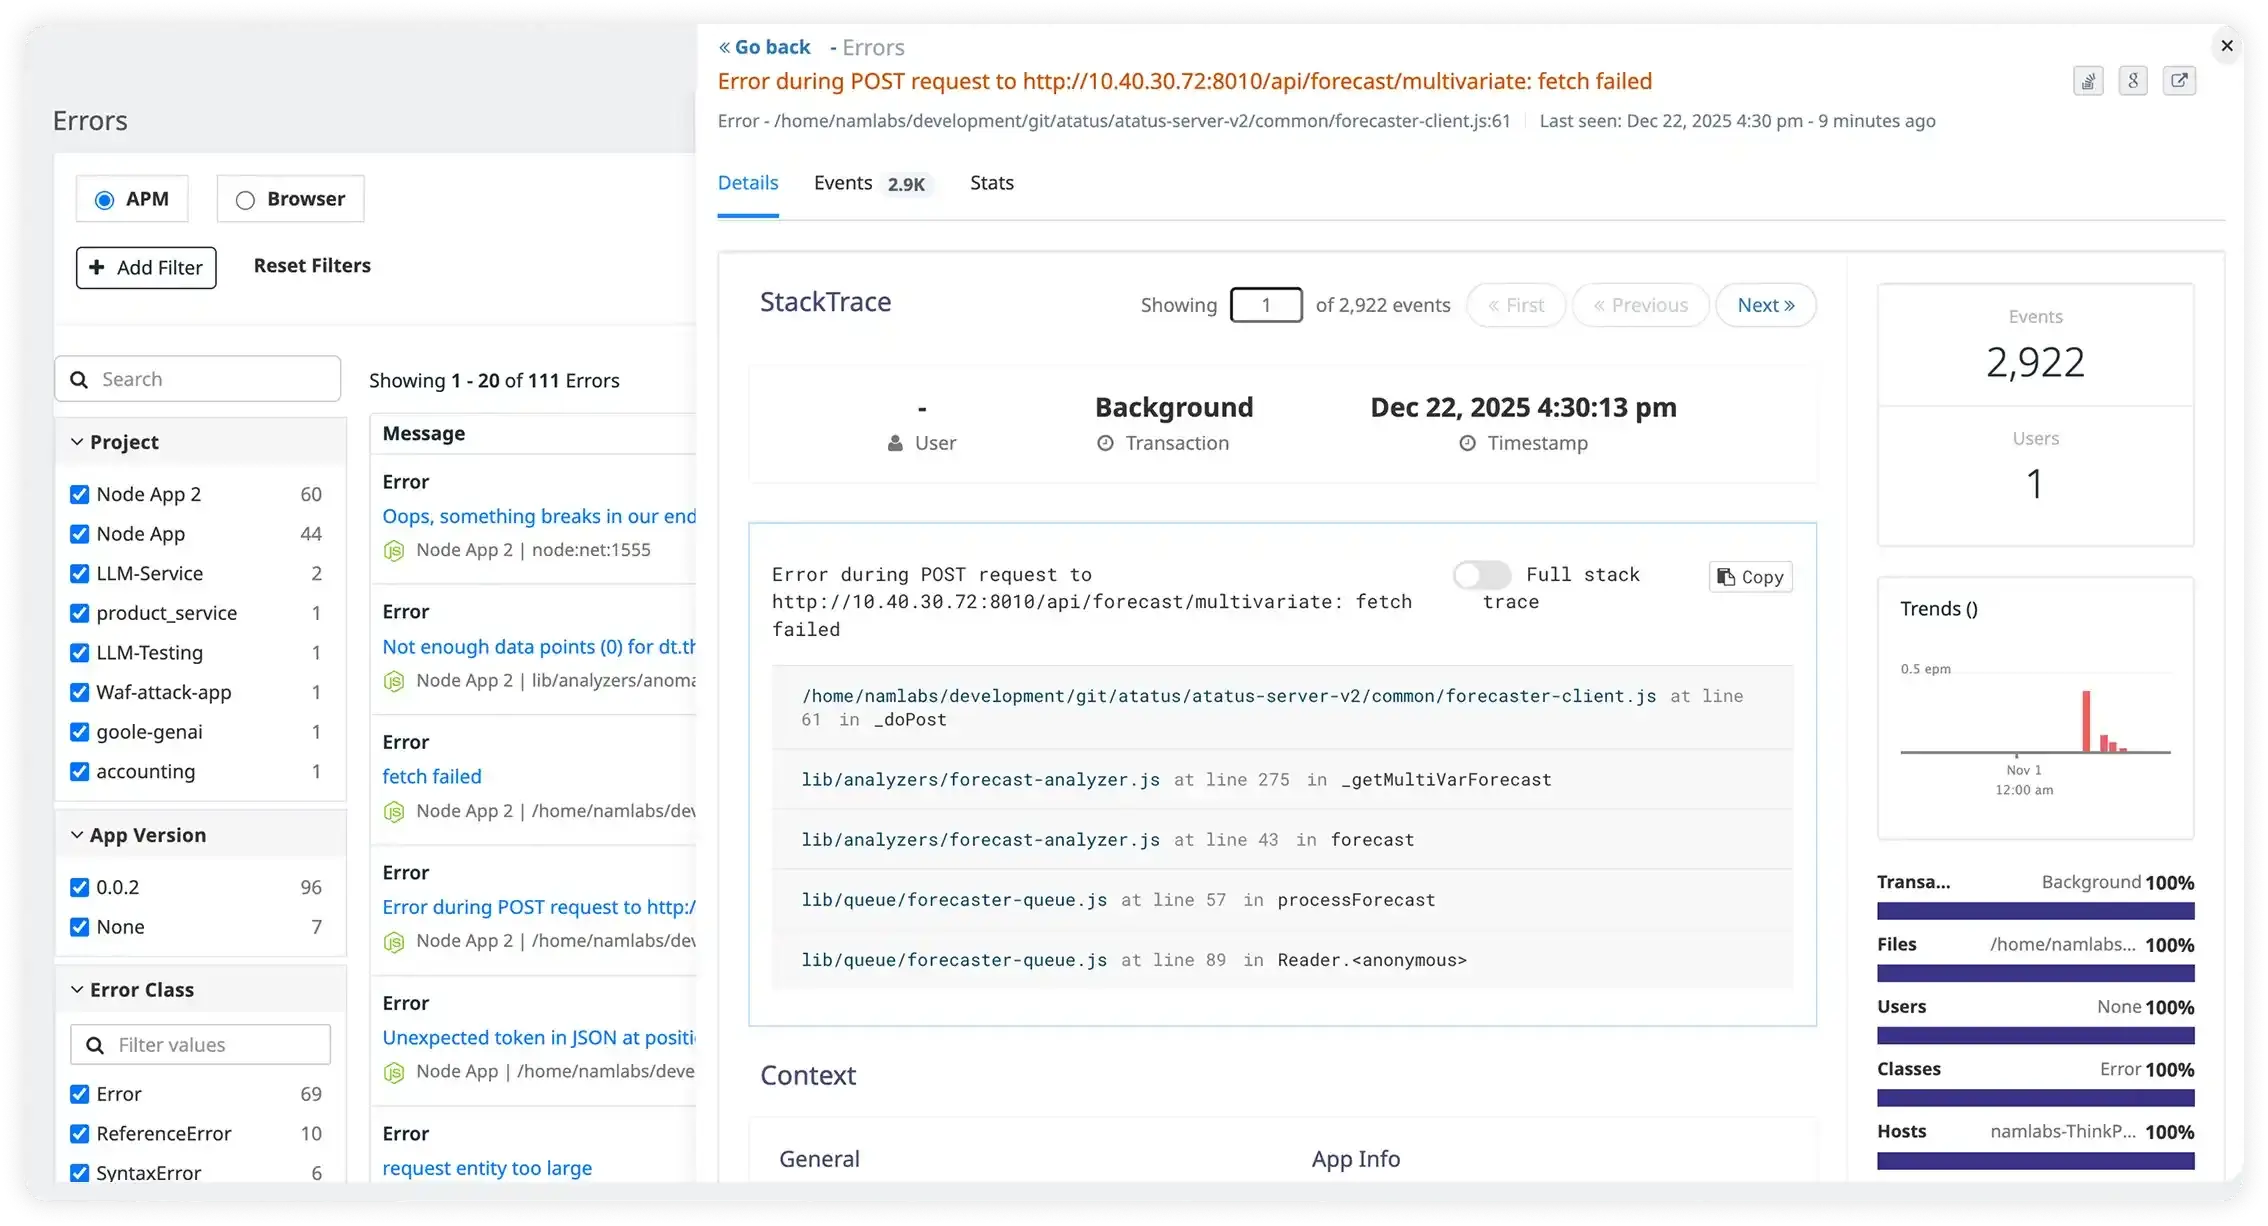
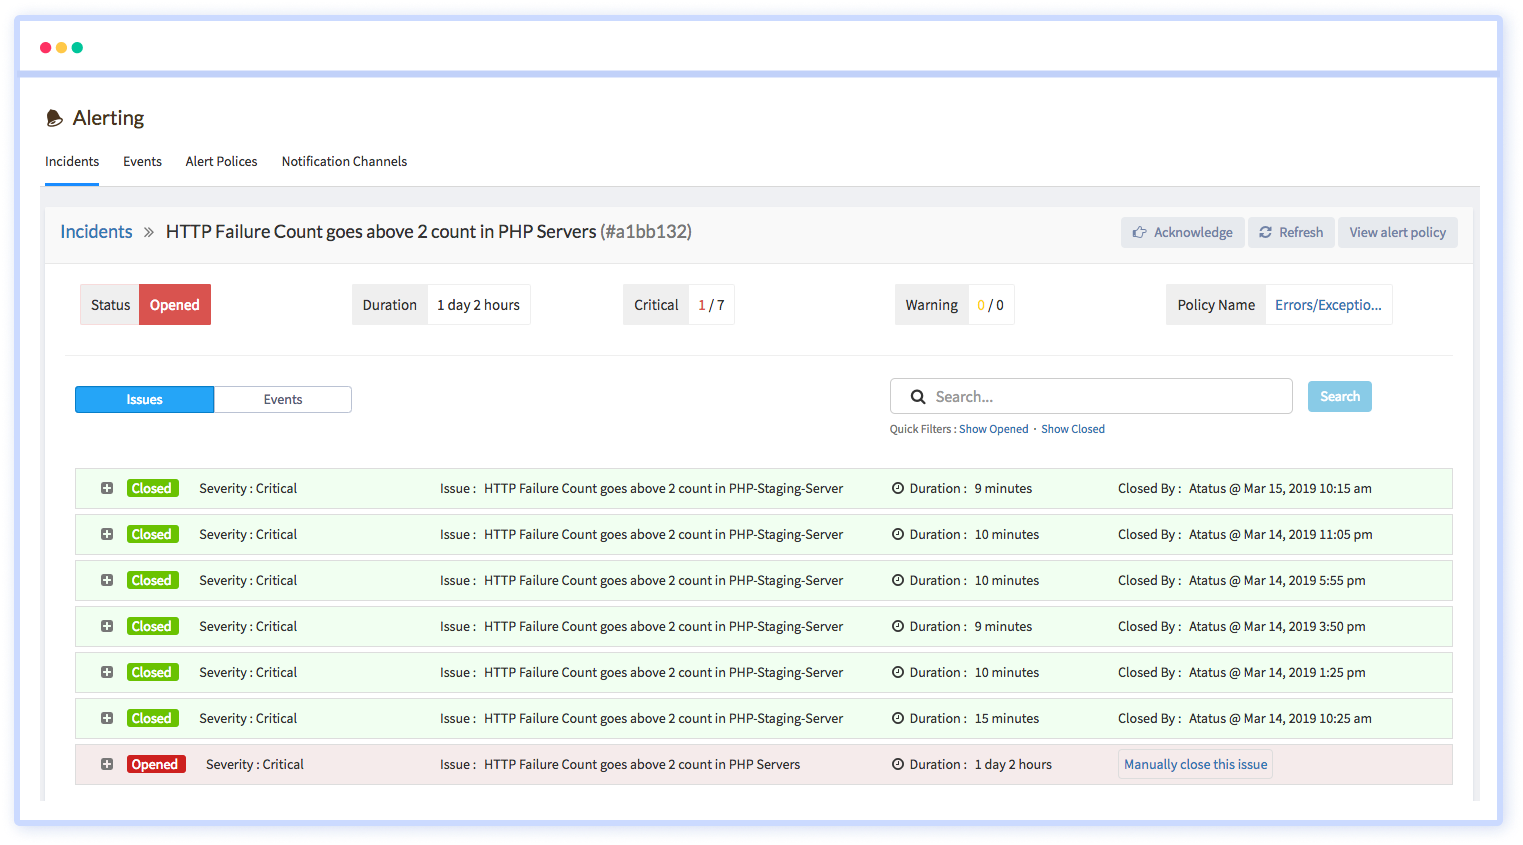
Where and Why Errors Occur
With the best CatchJS alternative Atatus, you can gain deep insights into where and why errors occur. It monitors error trends over time, helping you identify recurring problems before they escalate. With detailed stack traces and execution flow analysis, you can trace errors back to the exact line of code causing failures. Unlike CatchJS, which provides only a basic error snapshot, Atatus delivers a complete breakdown, ensuring you have full context for faster debugging and resolution.
Beyond Errors: A Complete Picture of Every Failure
Atatus goes beyond just showing stack traces, it captures the entire context of each error. It reveals who was affected, what actions led to the failure, and which request triggered it, giving teams a 360-degree view of the issue. By correlating error data with request details, database queries, external requests, and application performance, Atatus ensures teams understand not just where an error happened, but why it occurred and how it impacted users.
Smarter Alerts and Seamless Issue Resolution
Atatus doesn’t just notify, it assigns issues to the right team members for quick action. Customizable alerts notify teams based on severity and frequency, helping them focus on critical problems. With integrations into Slack, Teams, Jira, and GitHub, Atatus streamlines workflows and keeps issue ownership clear.
Best Among CatchJS Alternatives for Full-Stack Monitoring
Unlike tools that separate error monitoring, session replay, and infrastructure tracking, Atatus provides a unified full-stack monitoring solution. It seamlessly pairs server-side infrastructure monitoring with frontend application performance, ensuring complete visibility into your tech stack. While CatchJS focuses on individual features and lacks built-in logging support, Atatus consolidates error tracking, performance insights, and logging in one place. This allows developers to identify, analyse, and resolve issues faster without juggling multiple tools.
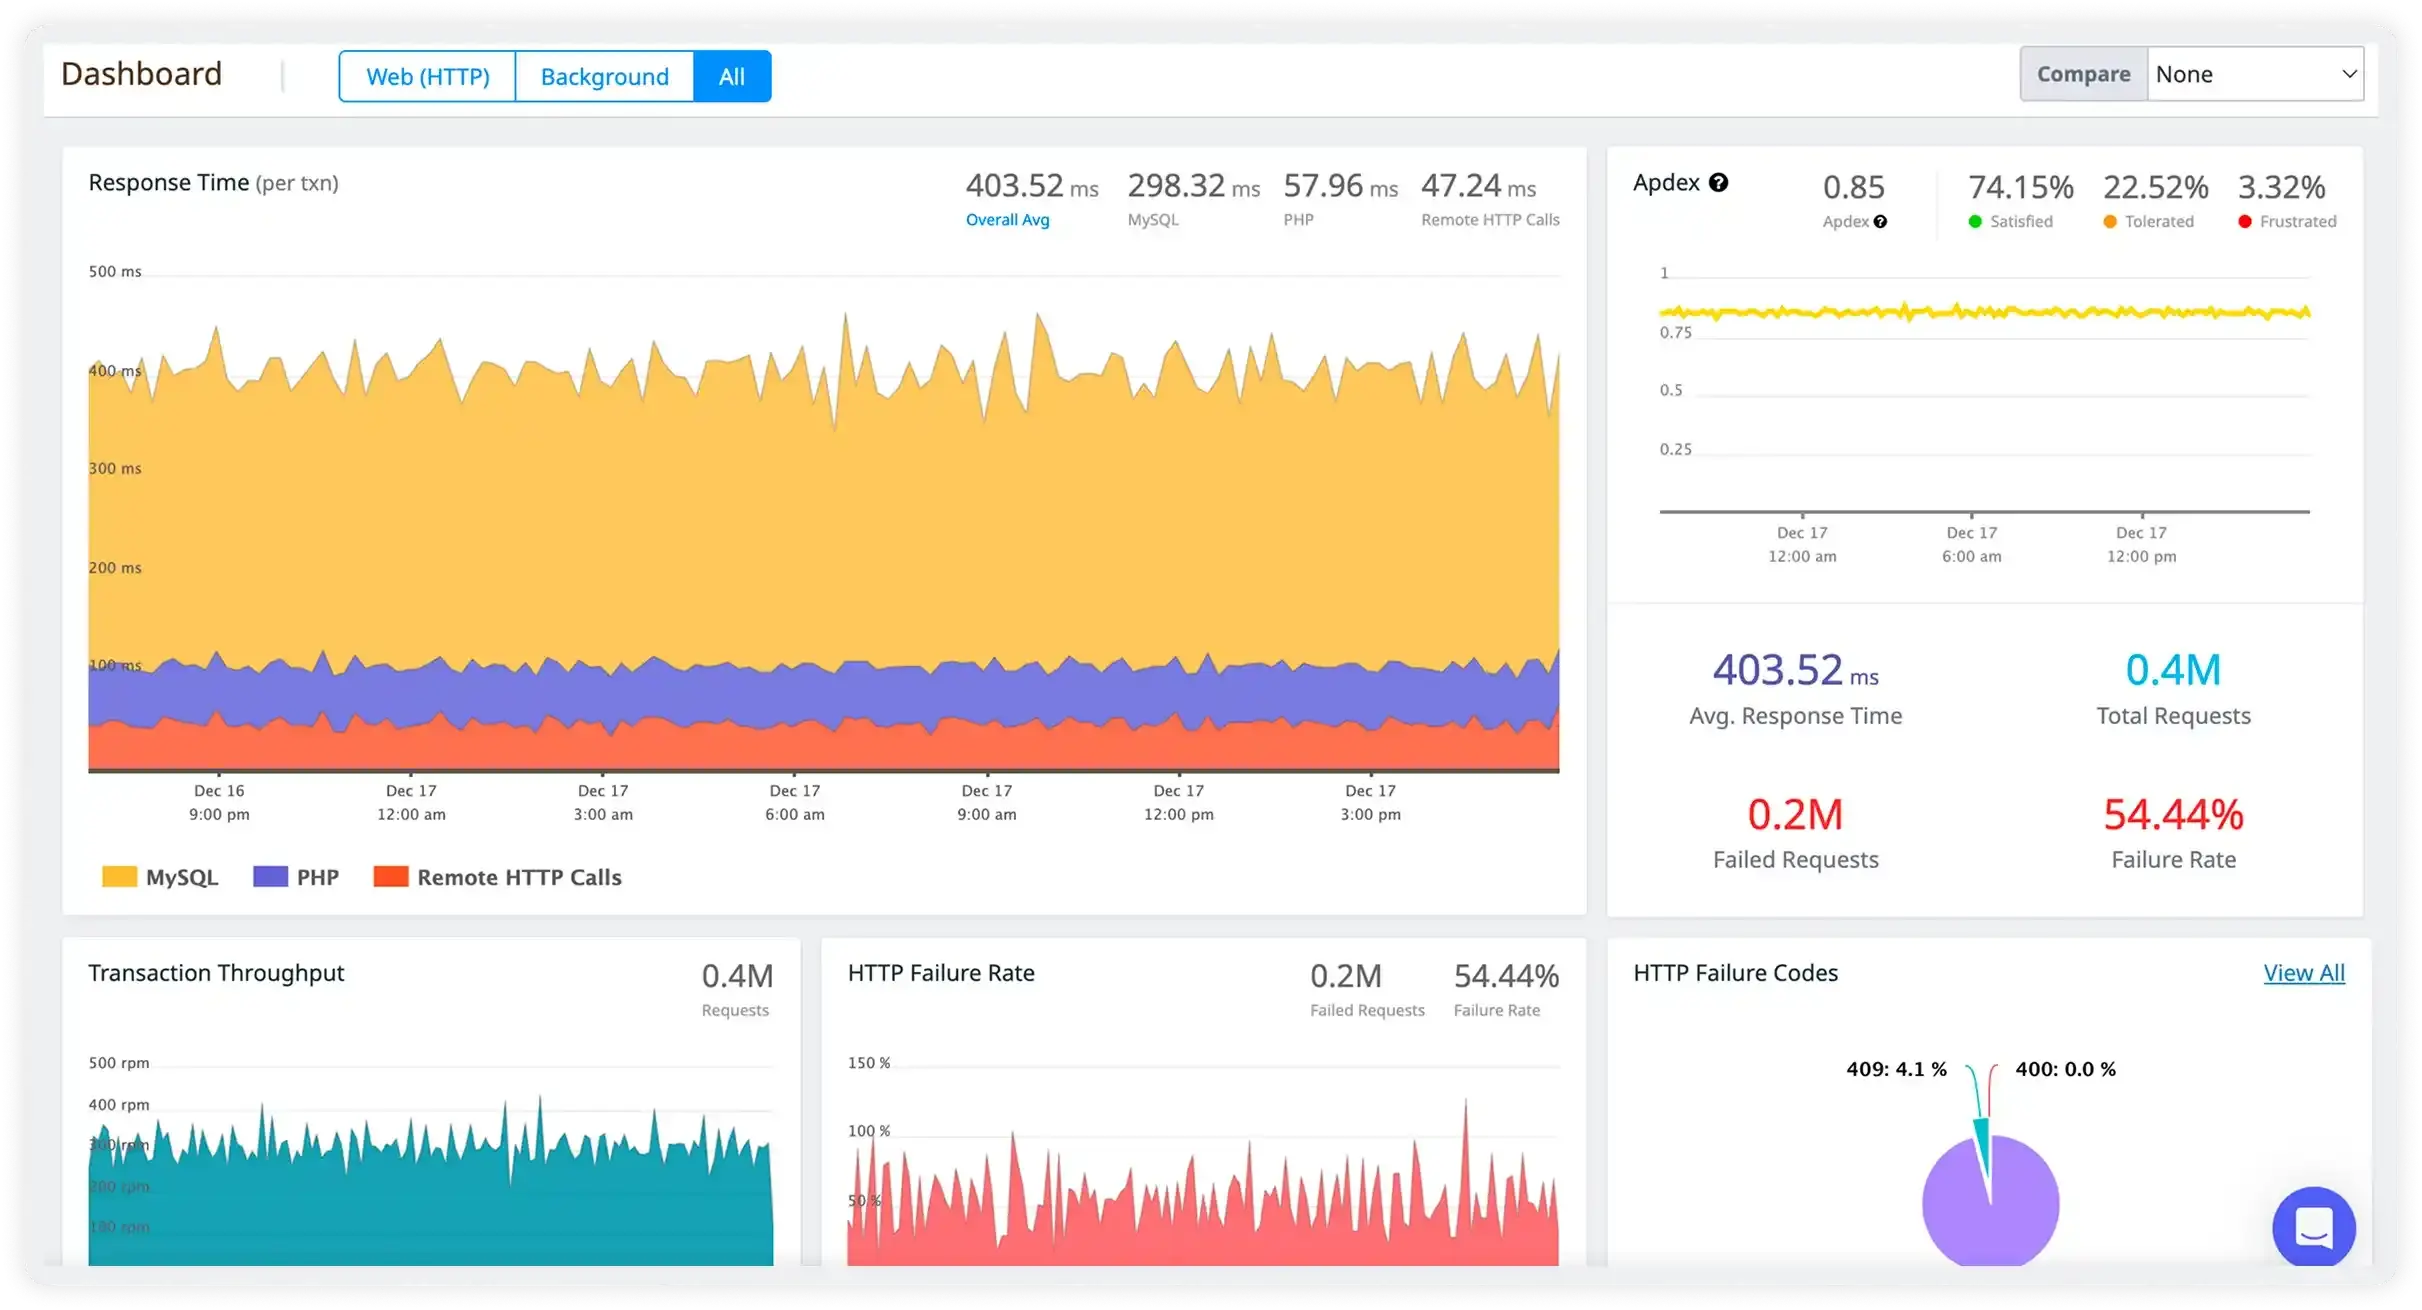
Application Monitoring (APM)
Pro-actively monitor, analyze and optimize the performance-related issues in your back-end apps and databases.
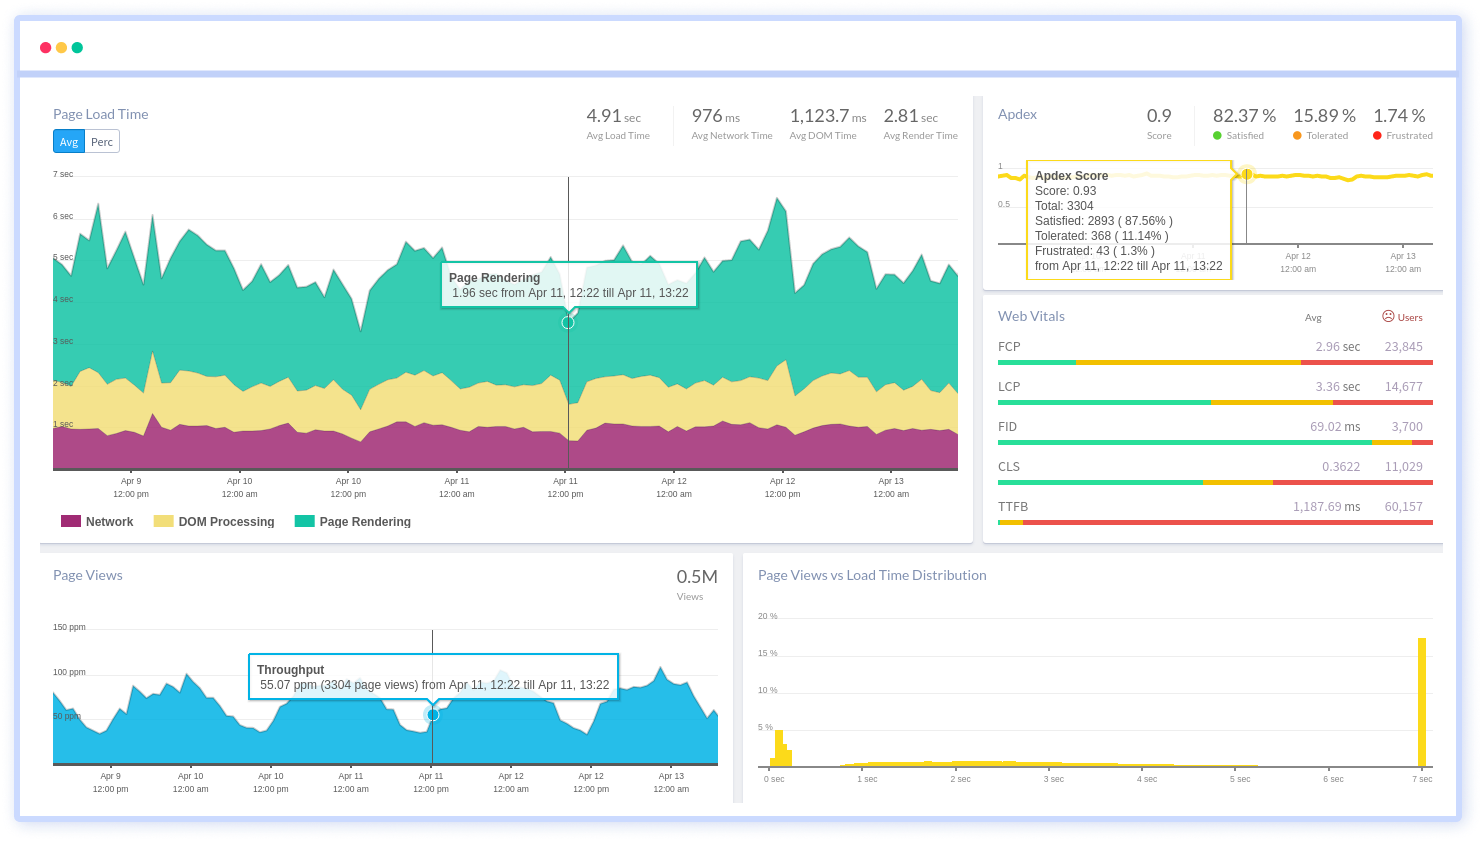
ExploreReal User Monitoring (RUM)
Complete visibility into end-user experience of your website and identify problematic parts of a web page.
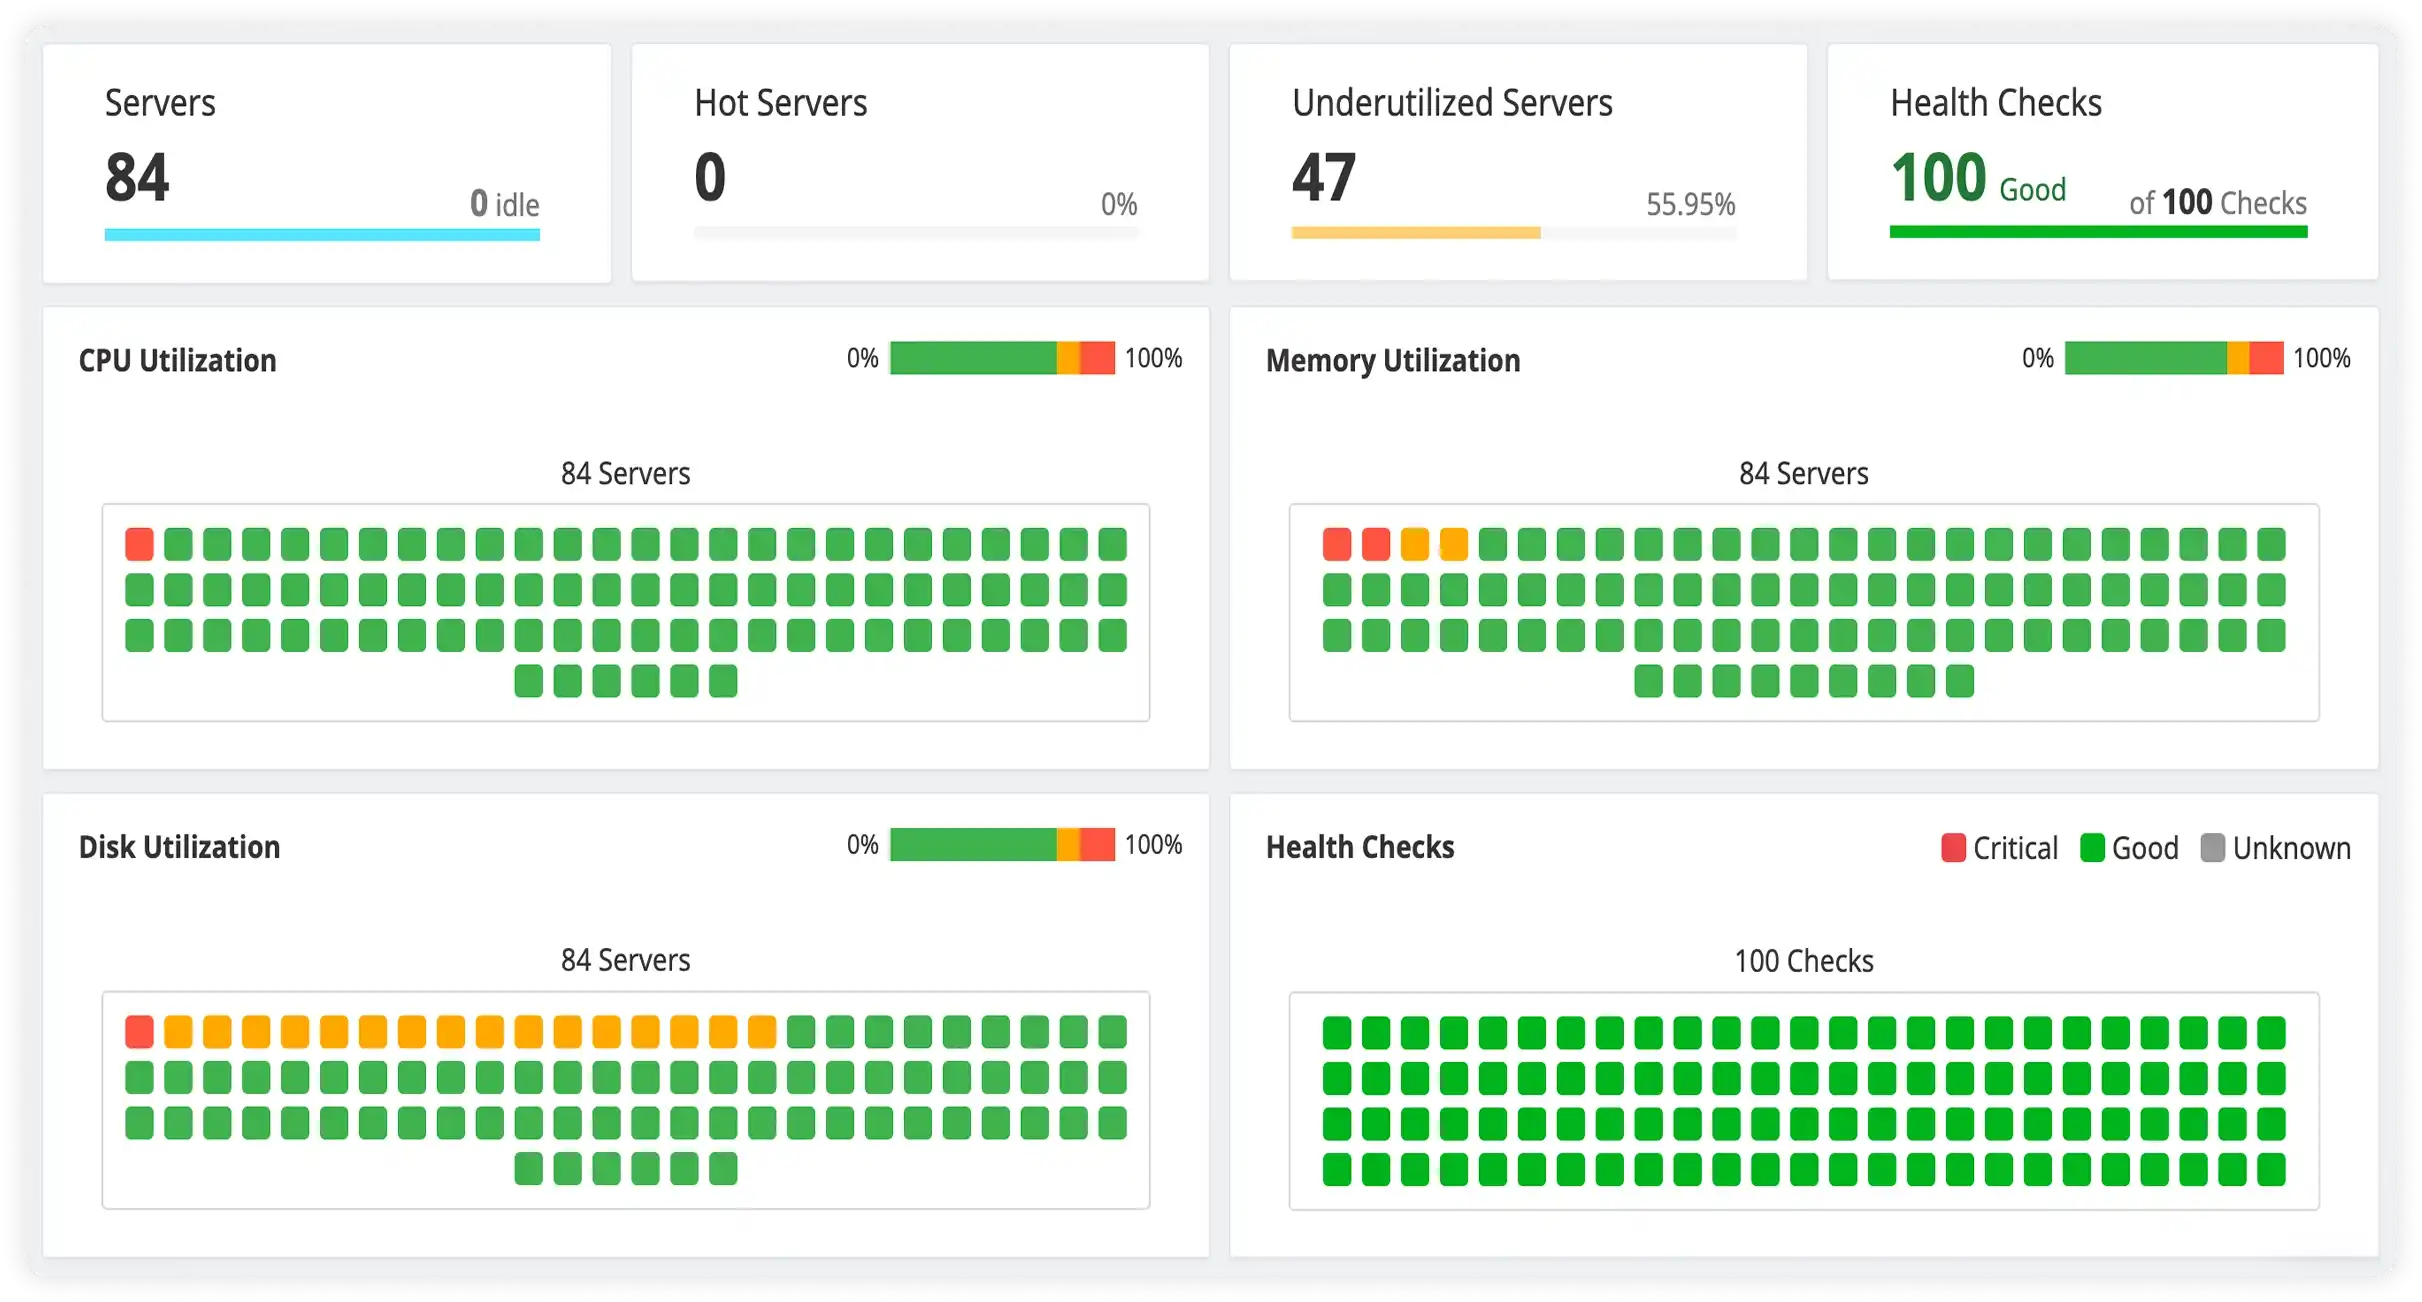
ExploreInfrastructure Monitoring
Get full visibility into your infrastructure performance and availability issues of all your servers and cloud instances.
ExploreLog Management & Analytics
Aggregate, search, filter, sort and analyze all your logs from different sources along APM traces at any scale in real-time.
ExploreSynthetic Monitoring
Continuously monitor the availability of your application, detect and resolve issues before your customers encounter them.
ExploreAPI Analytics
Monitor all your APIs and check how they are used, what payloads are being sent, which users are active, and more.
ExploreFrequently Asked Questions
Find answers to common questions about our platform
Milestones that spark performance excellence
Reflections from clients who've achieved unmatched excellence through innovative strategies.
Read customer stories


