Apache ZooKeeper Monitoring
Unlock the potential of Apache ZooKeeper monitoring with Atatus, your go-to ZooKeeper monitoring tool for seamless performance insights.
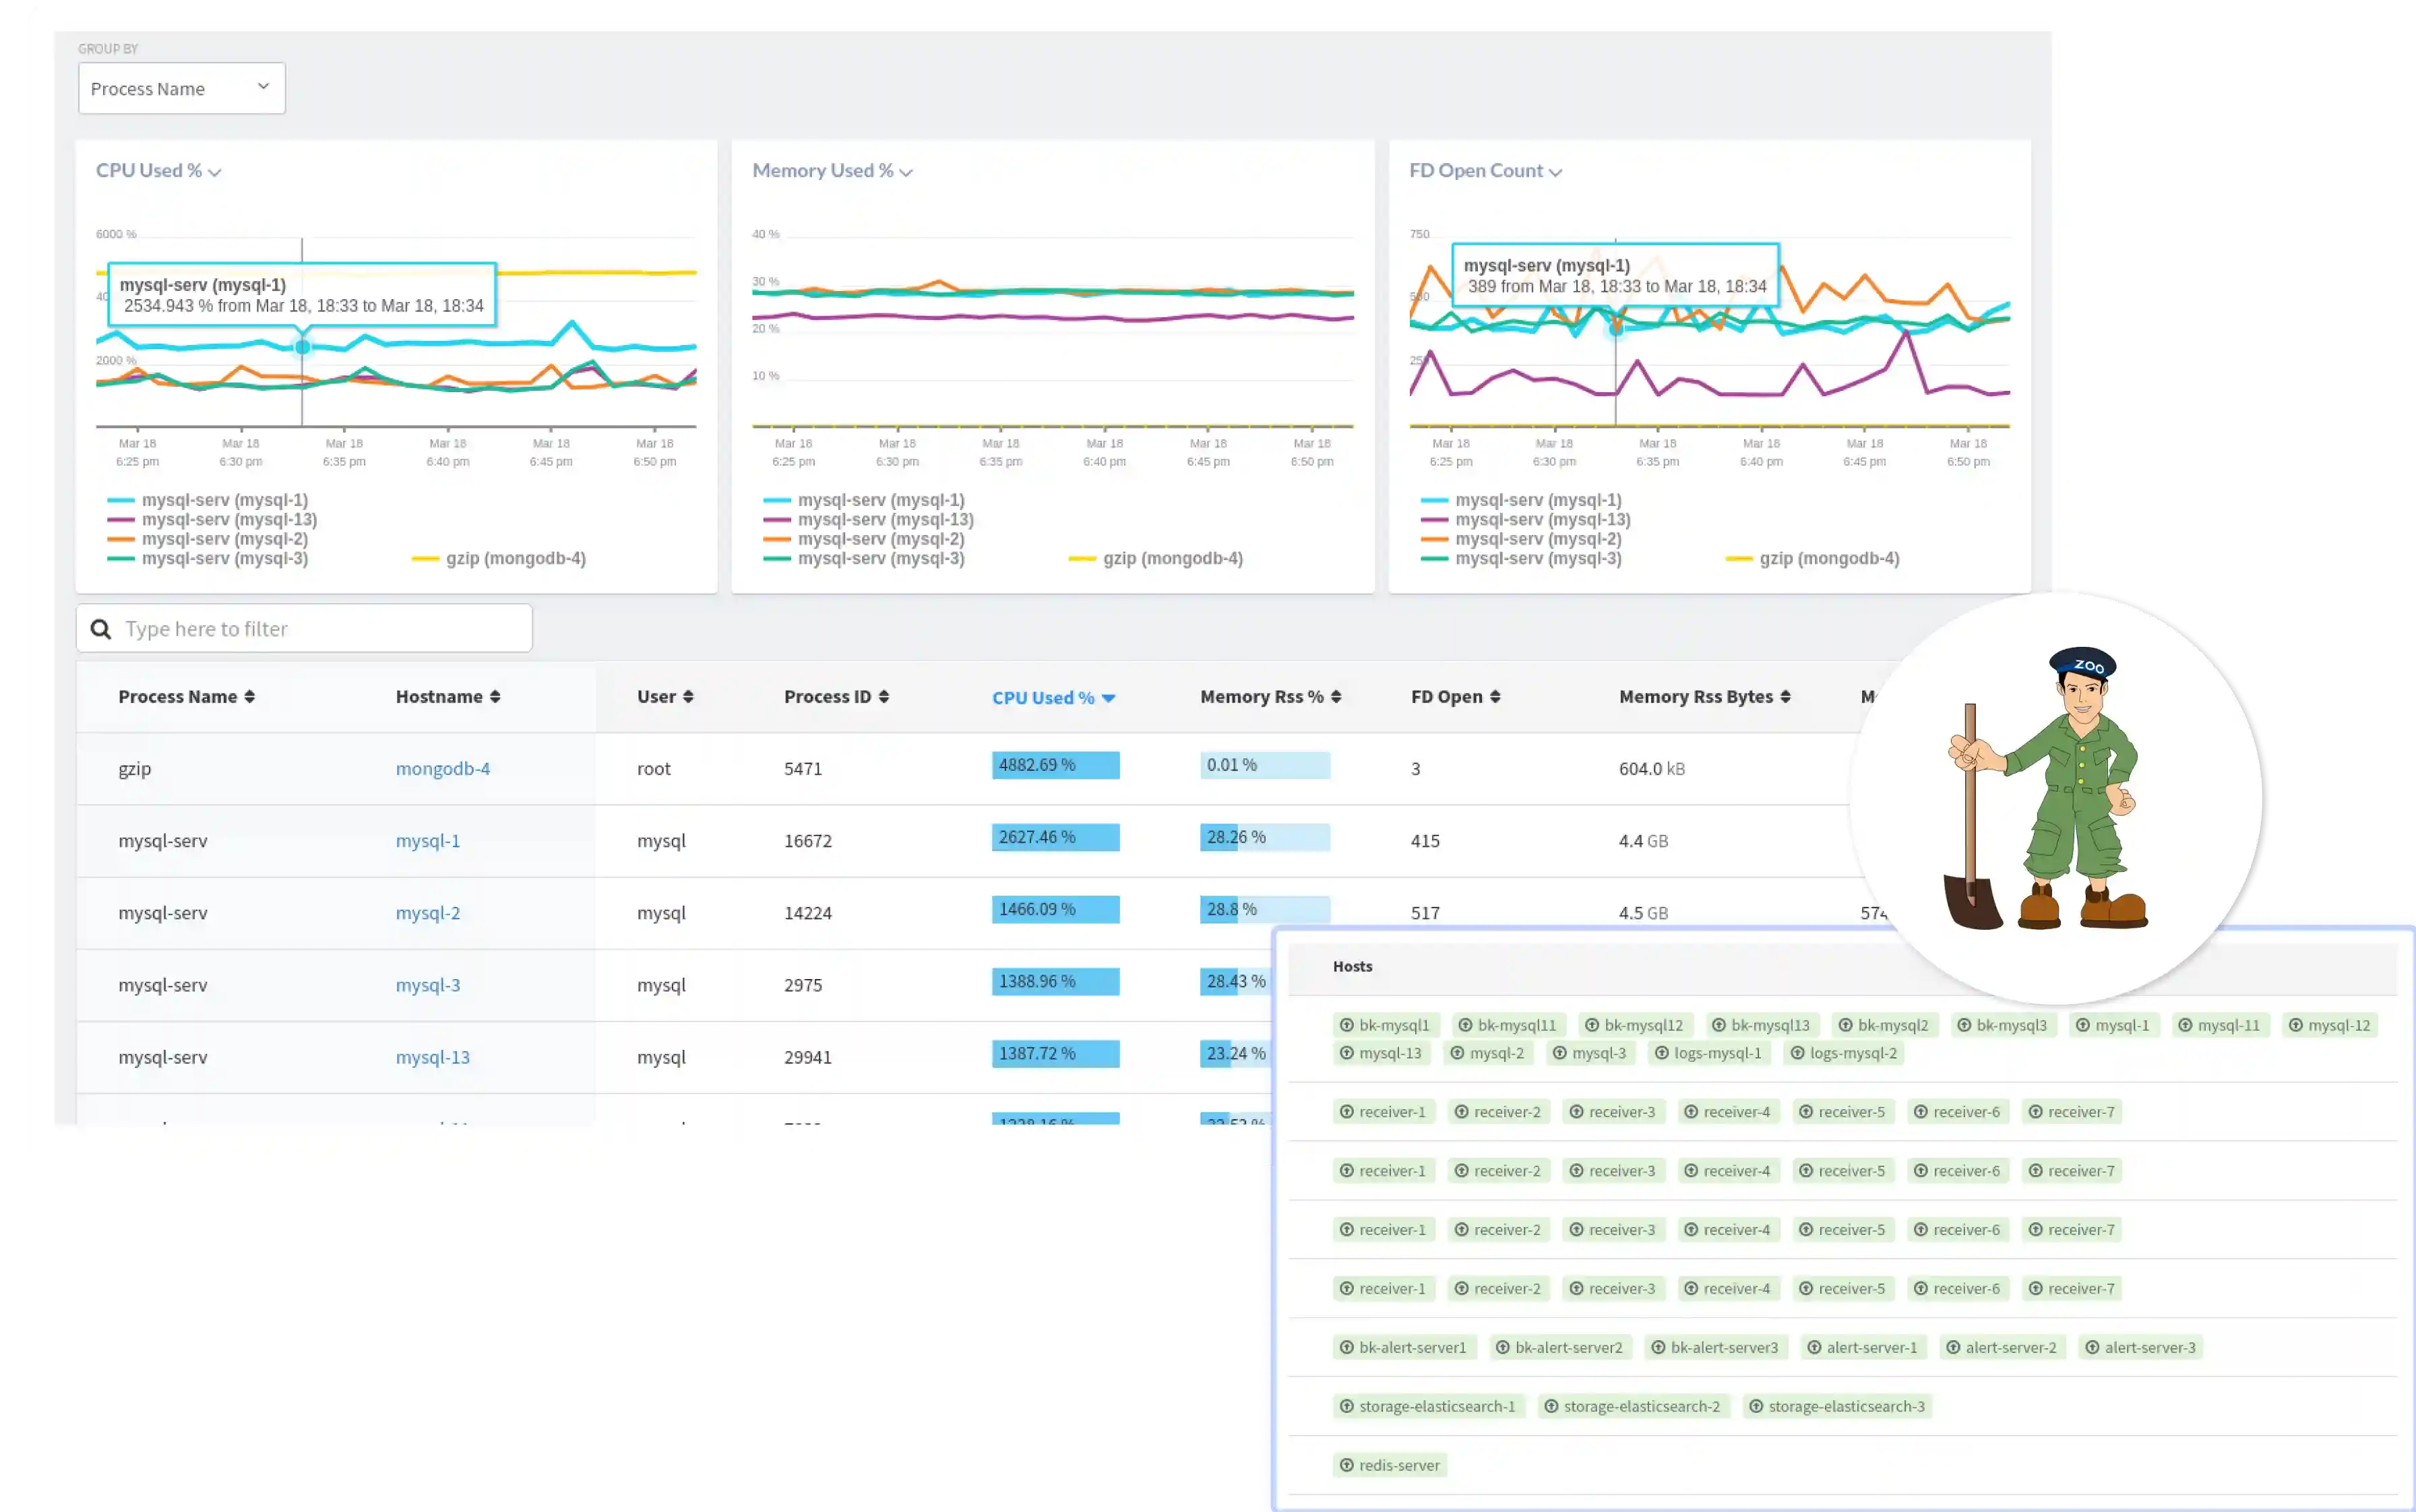
Why apache-zookeeper Performance Breaks Quietly?
Session Timeouts Surge
Ephemeral znodes expire mid-write during GC pauses, orphaning Kafka brokers without heartbeat visibility.
Leader Elections Stall
Follower sync lags trigger repeated elections, halting metadata ops for minutes sans quorum diagnostics.
Follower Sync Lags
Log replay from leader overloads followers, desyncing ensemble state invisibly under write bursts.
Znode Bloat Accumulates
Millions of znodes from topic sprawl exhaust heap, slowing traversals without tree depth metrics.
Watch Notification Overload
Ephemeral watches flood queues on node churn, dropping events without per-path notification counts.
Network Partition Blindness
Split-brain quorums form undetected, duplicating leaders across AZs lacking latency breakdowns.
Disk Snapshot Congestion
Transaction log compaction stalls under I/O saturation, freezing snapshots sans throughput histograms.
Client Connection Floods
Thundering herds exhaust 4MLimit during restarts, blackholing sessions without connection pool stats.
Complete Performance Visibility for
Apache ZooKeeper
Real-time observability for Apache ZooKeeper that helps teams monitor request behavior, track coordination performance, and maintain cluster stability under load.
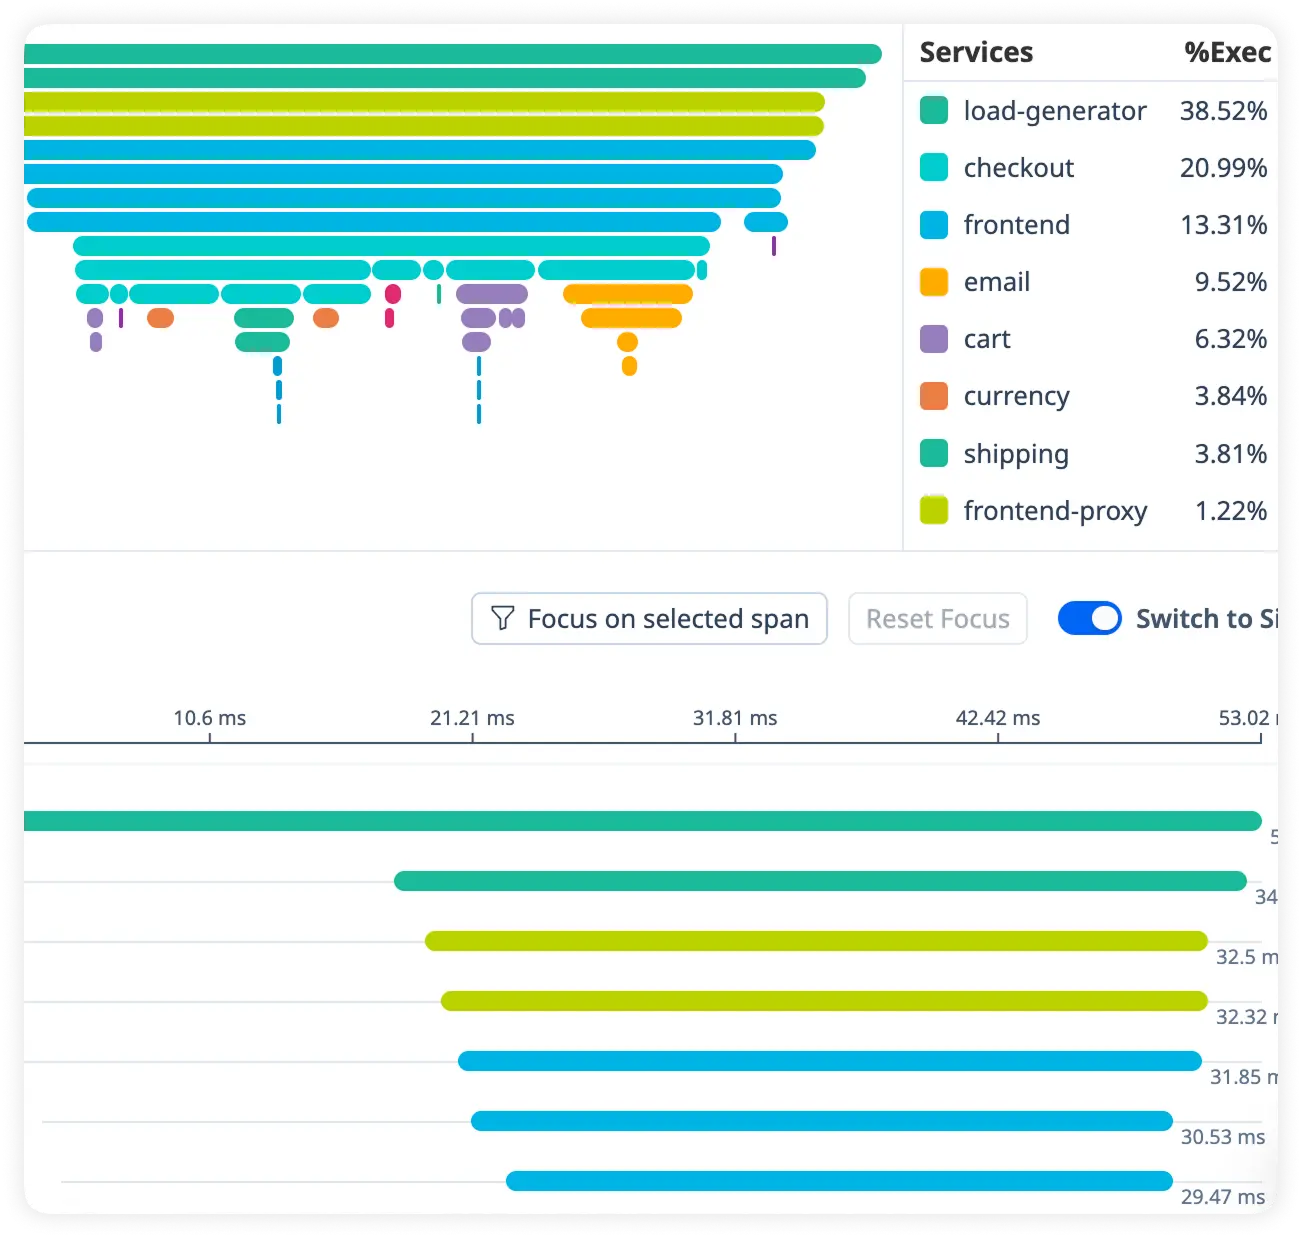
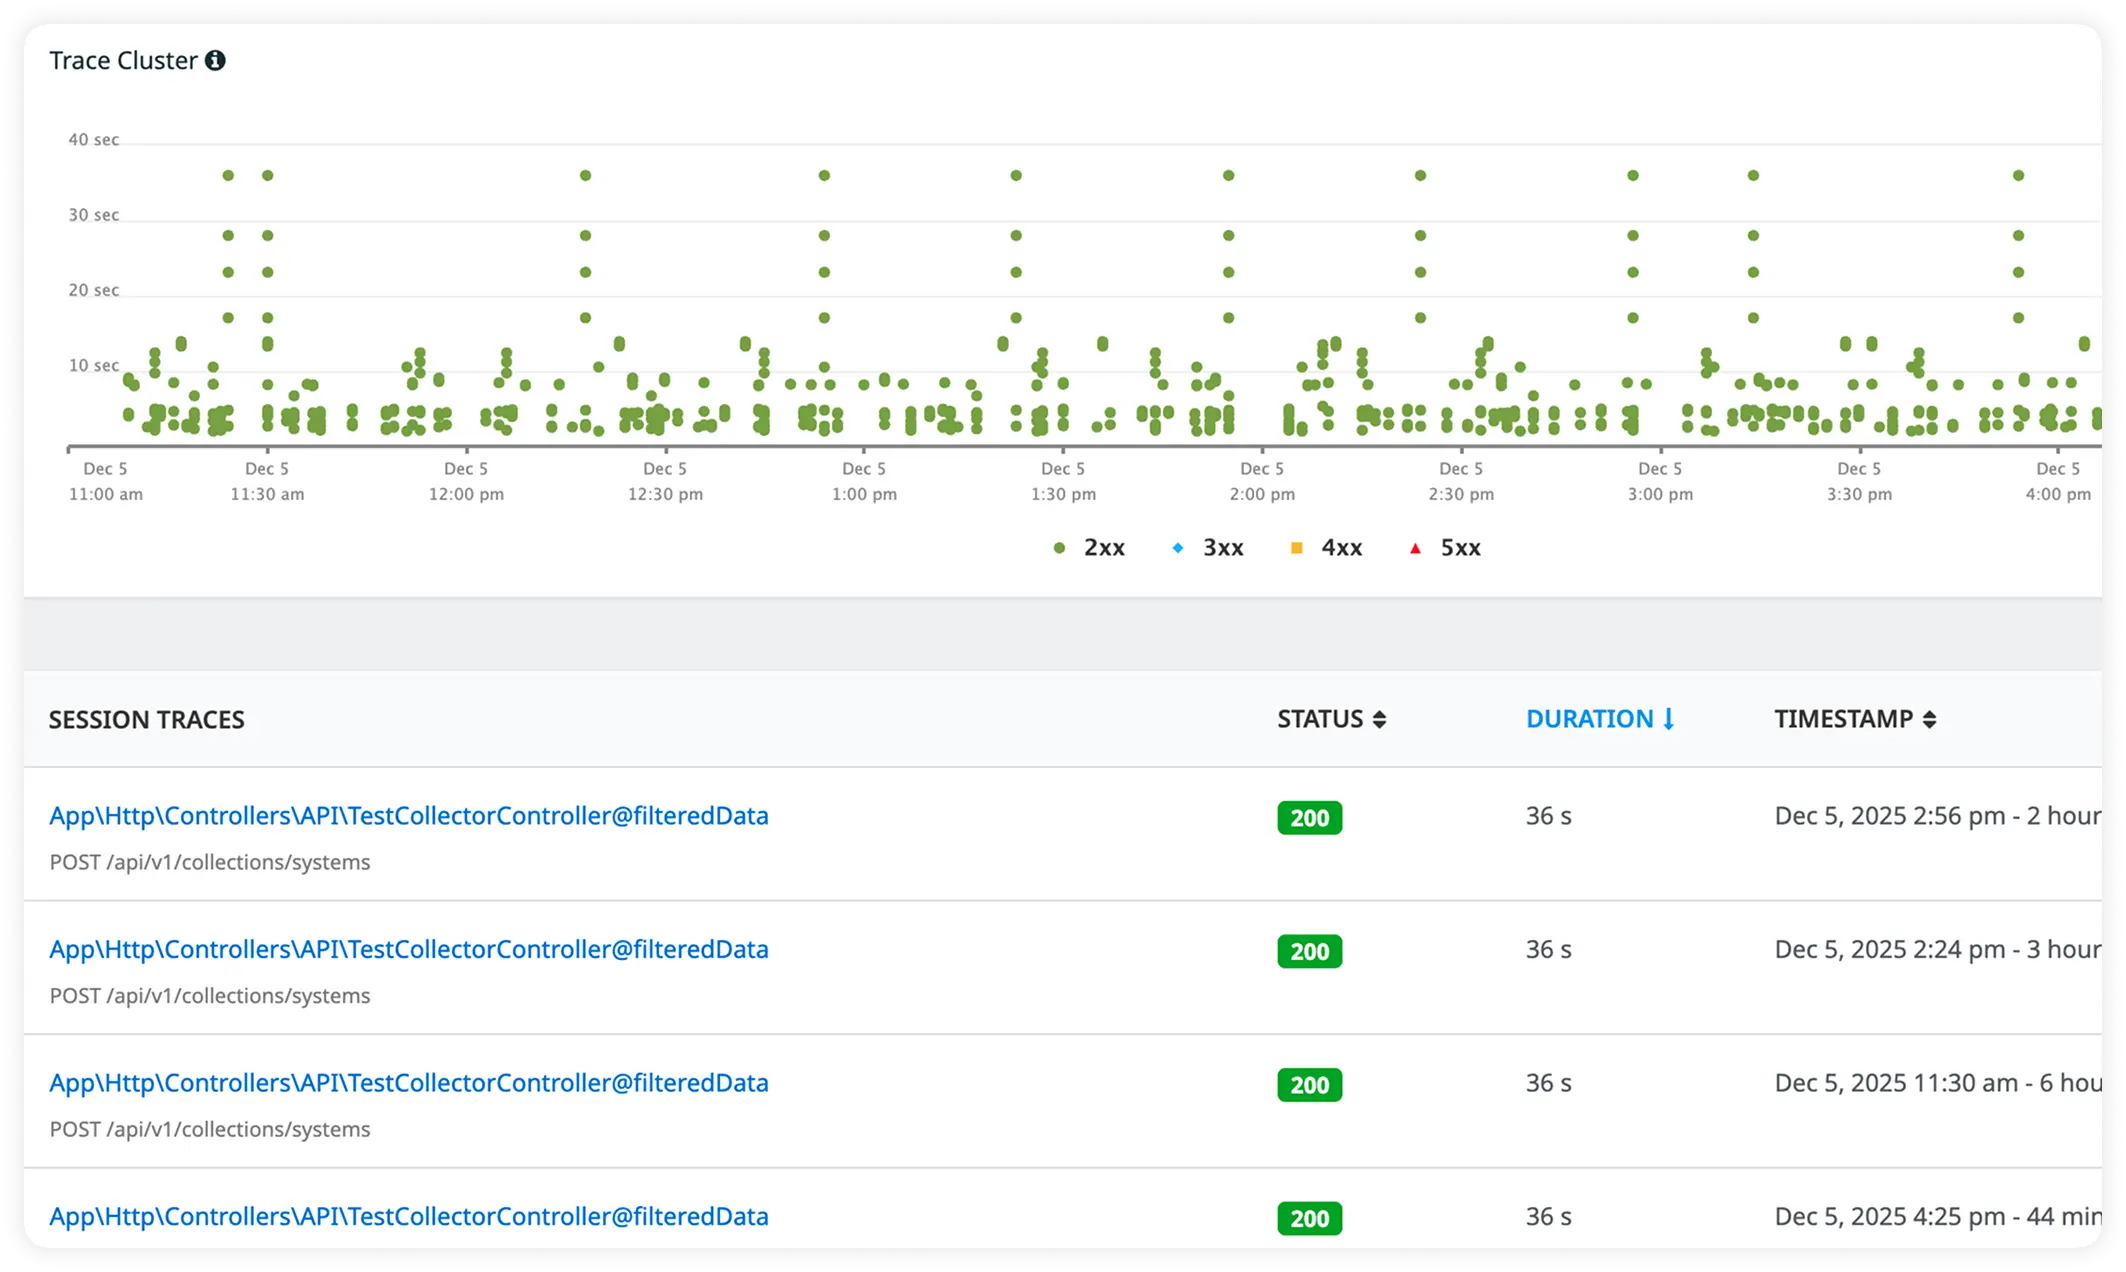
Trace Coordination Requests End-to-End
Monitor how requests flow across ZooKeeper nodes to identify latency spikes, failures, and coordination instability in real time.
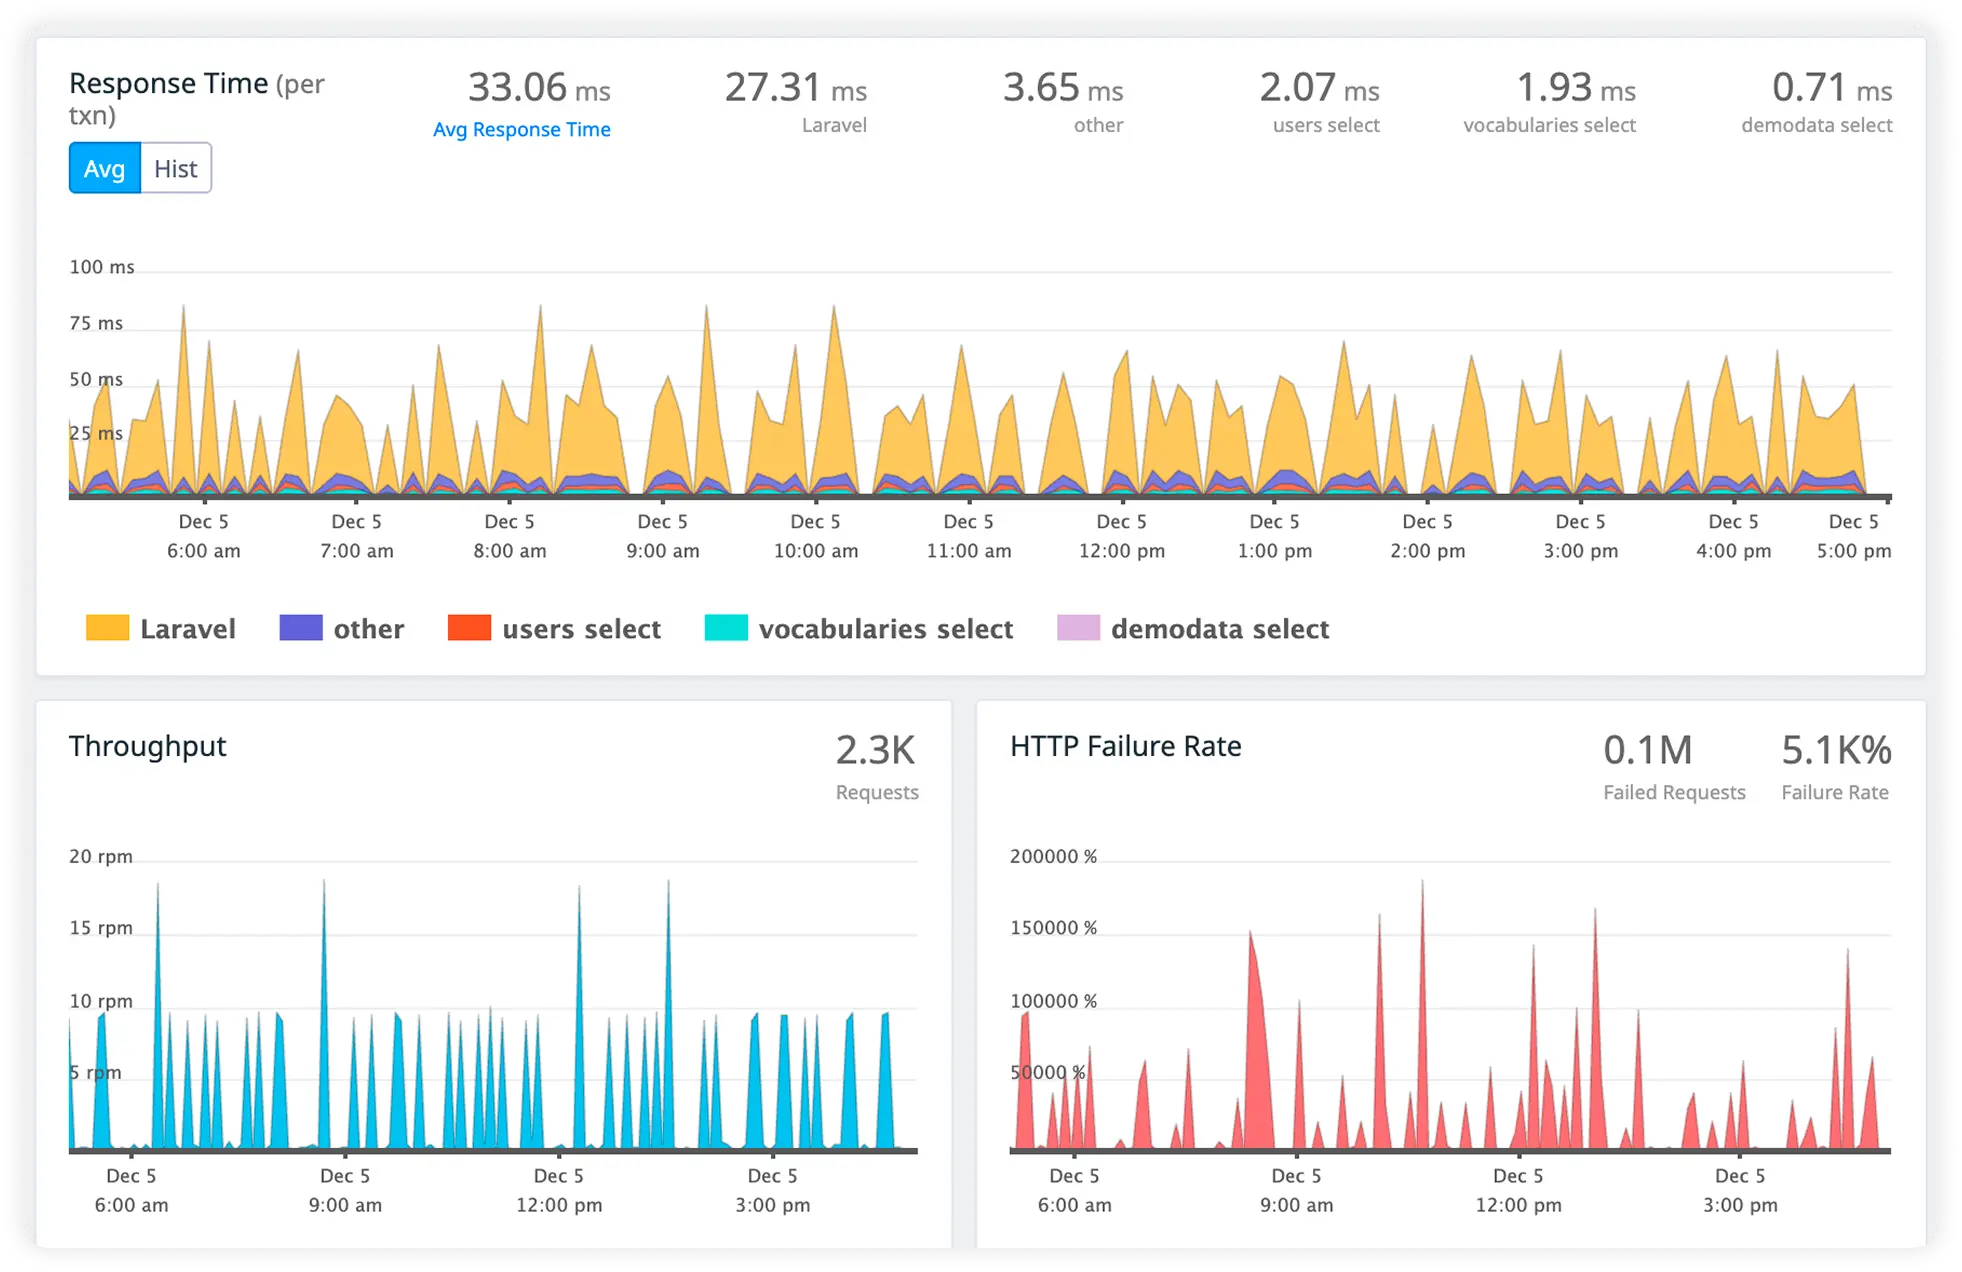
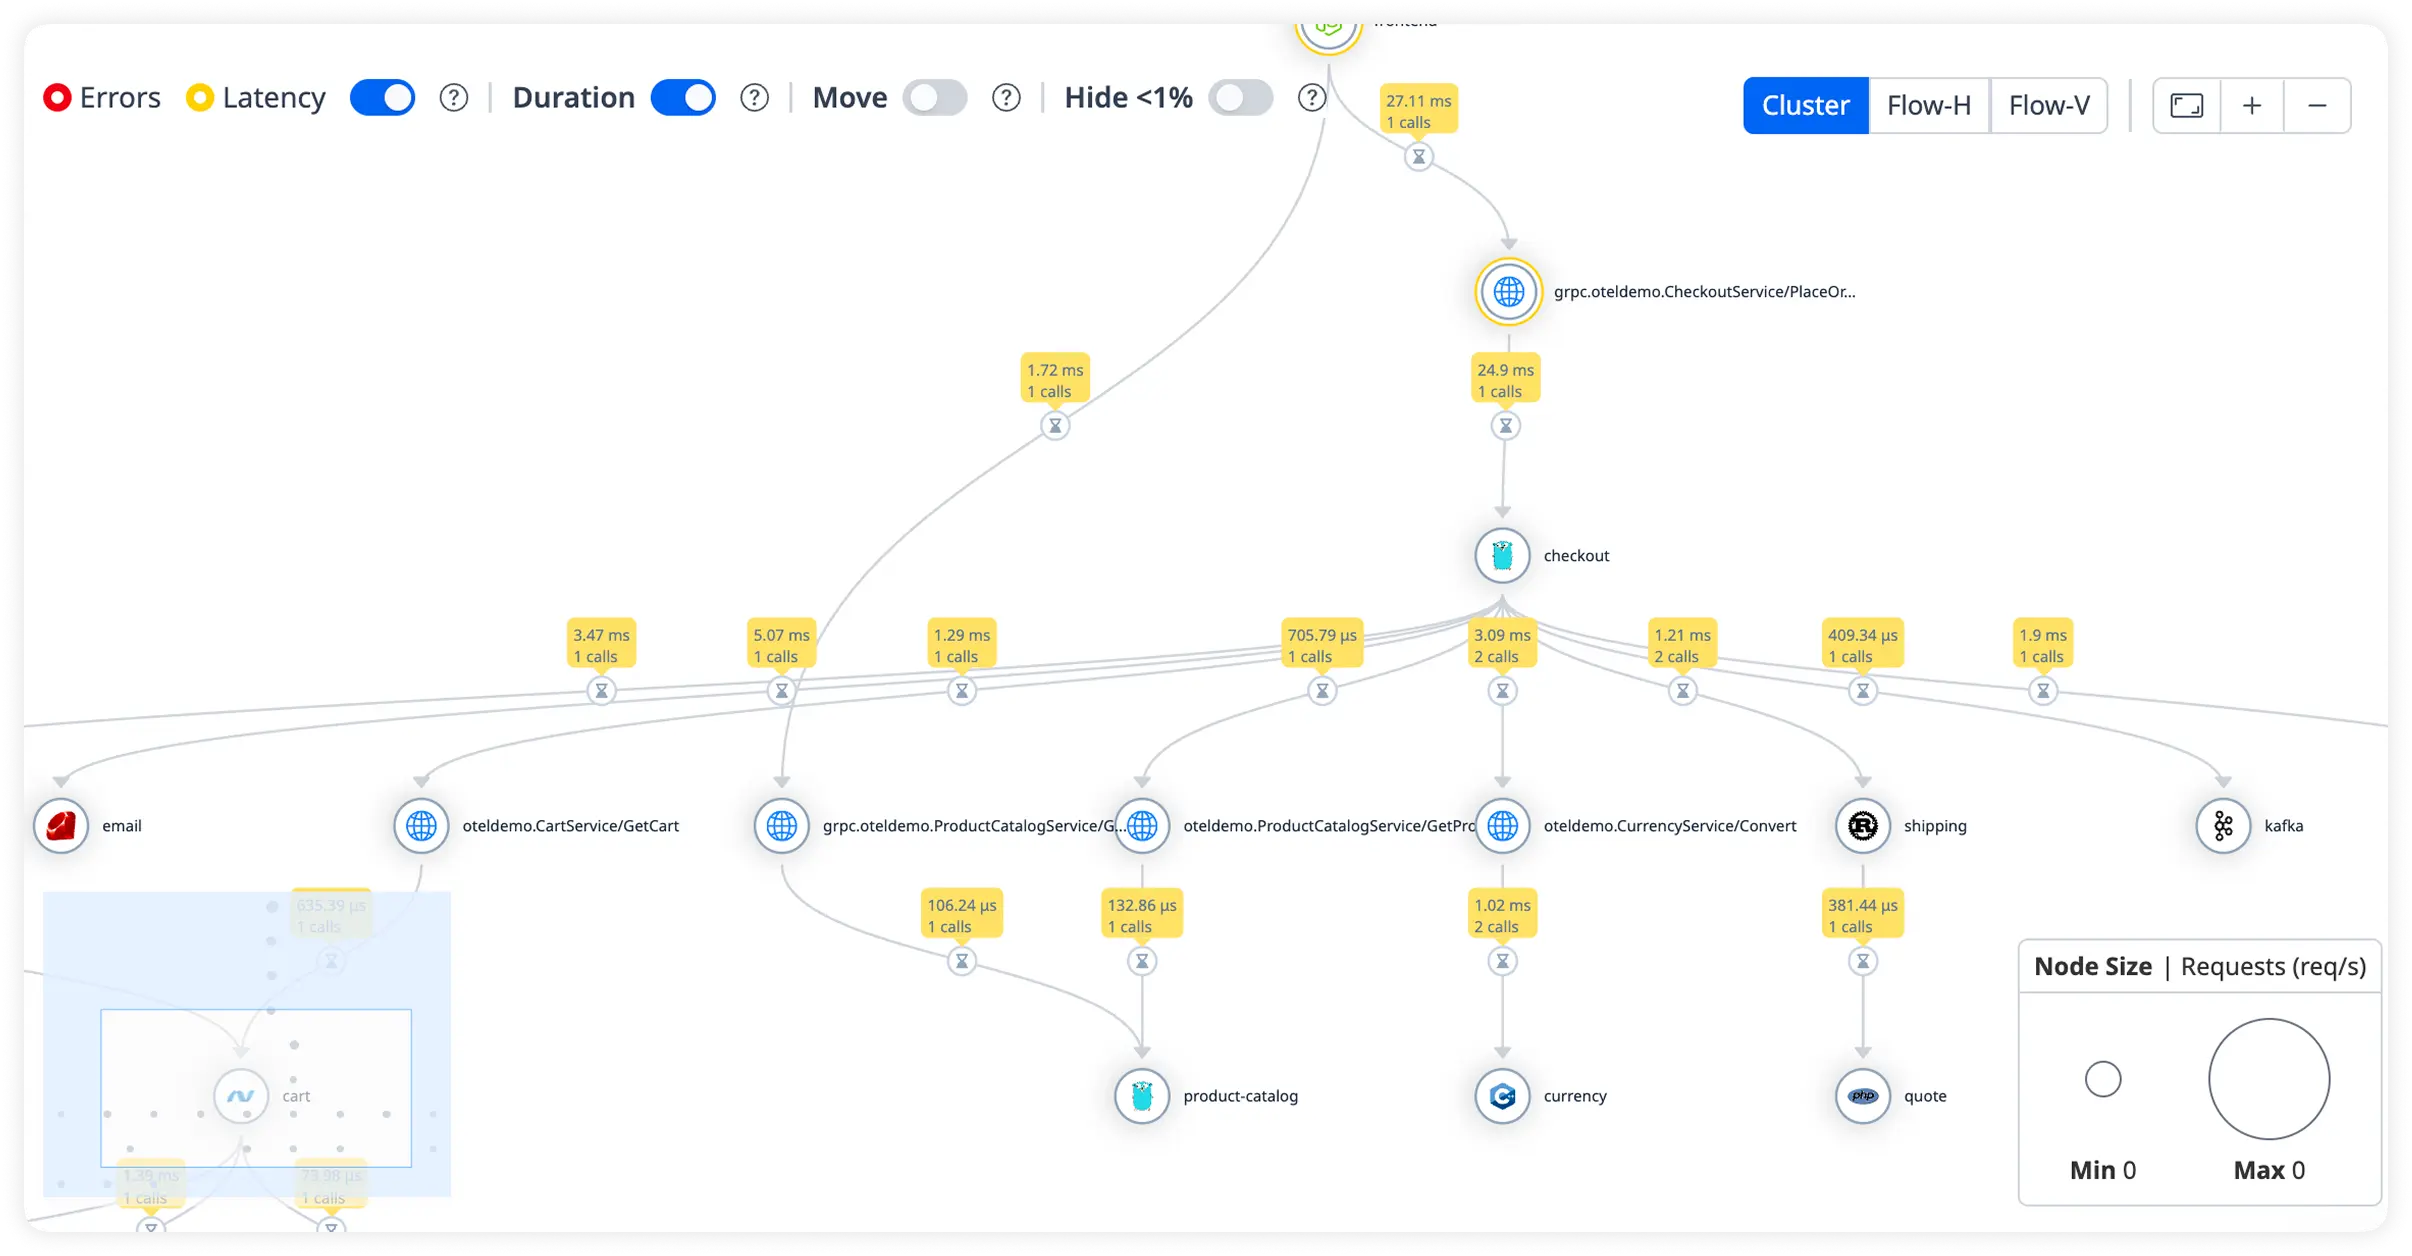
Visualize Cluster Interactions
Understand node communication patterns and performance dependencies using live health and throughput metrics.
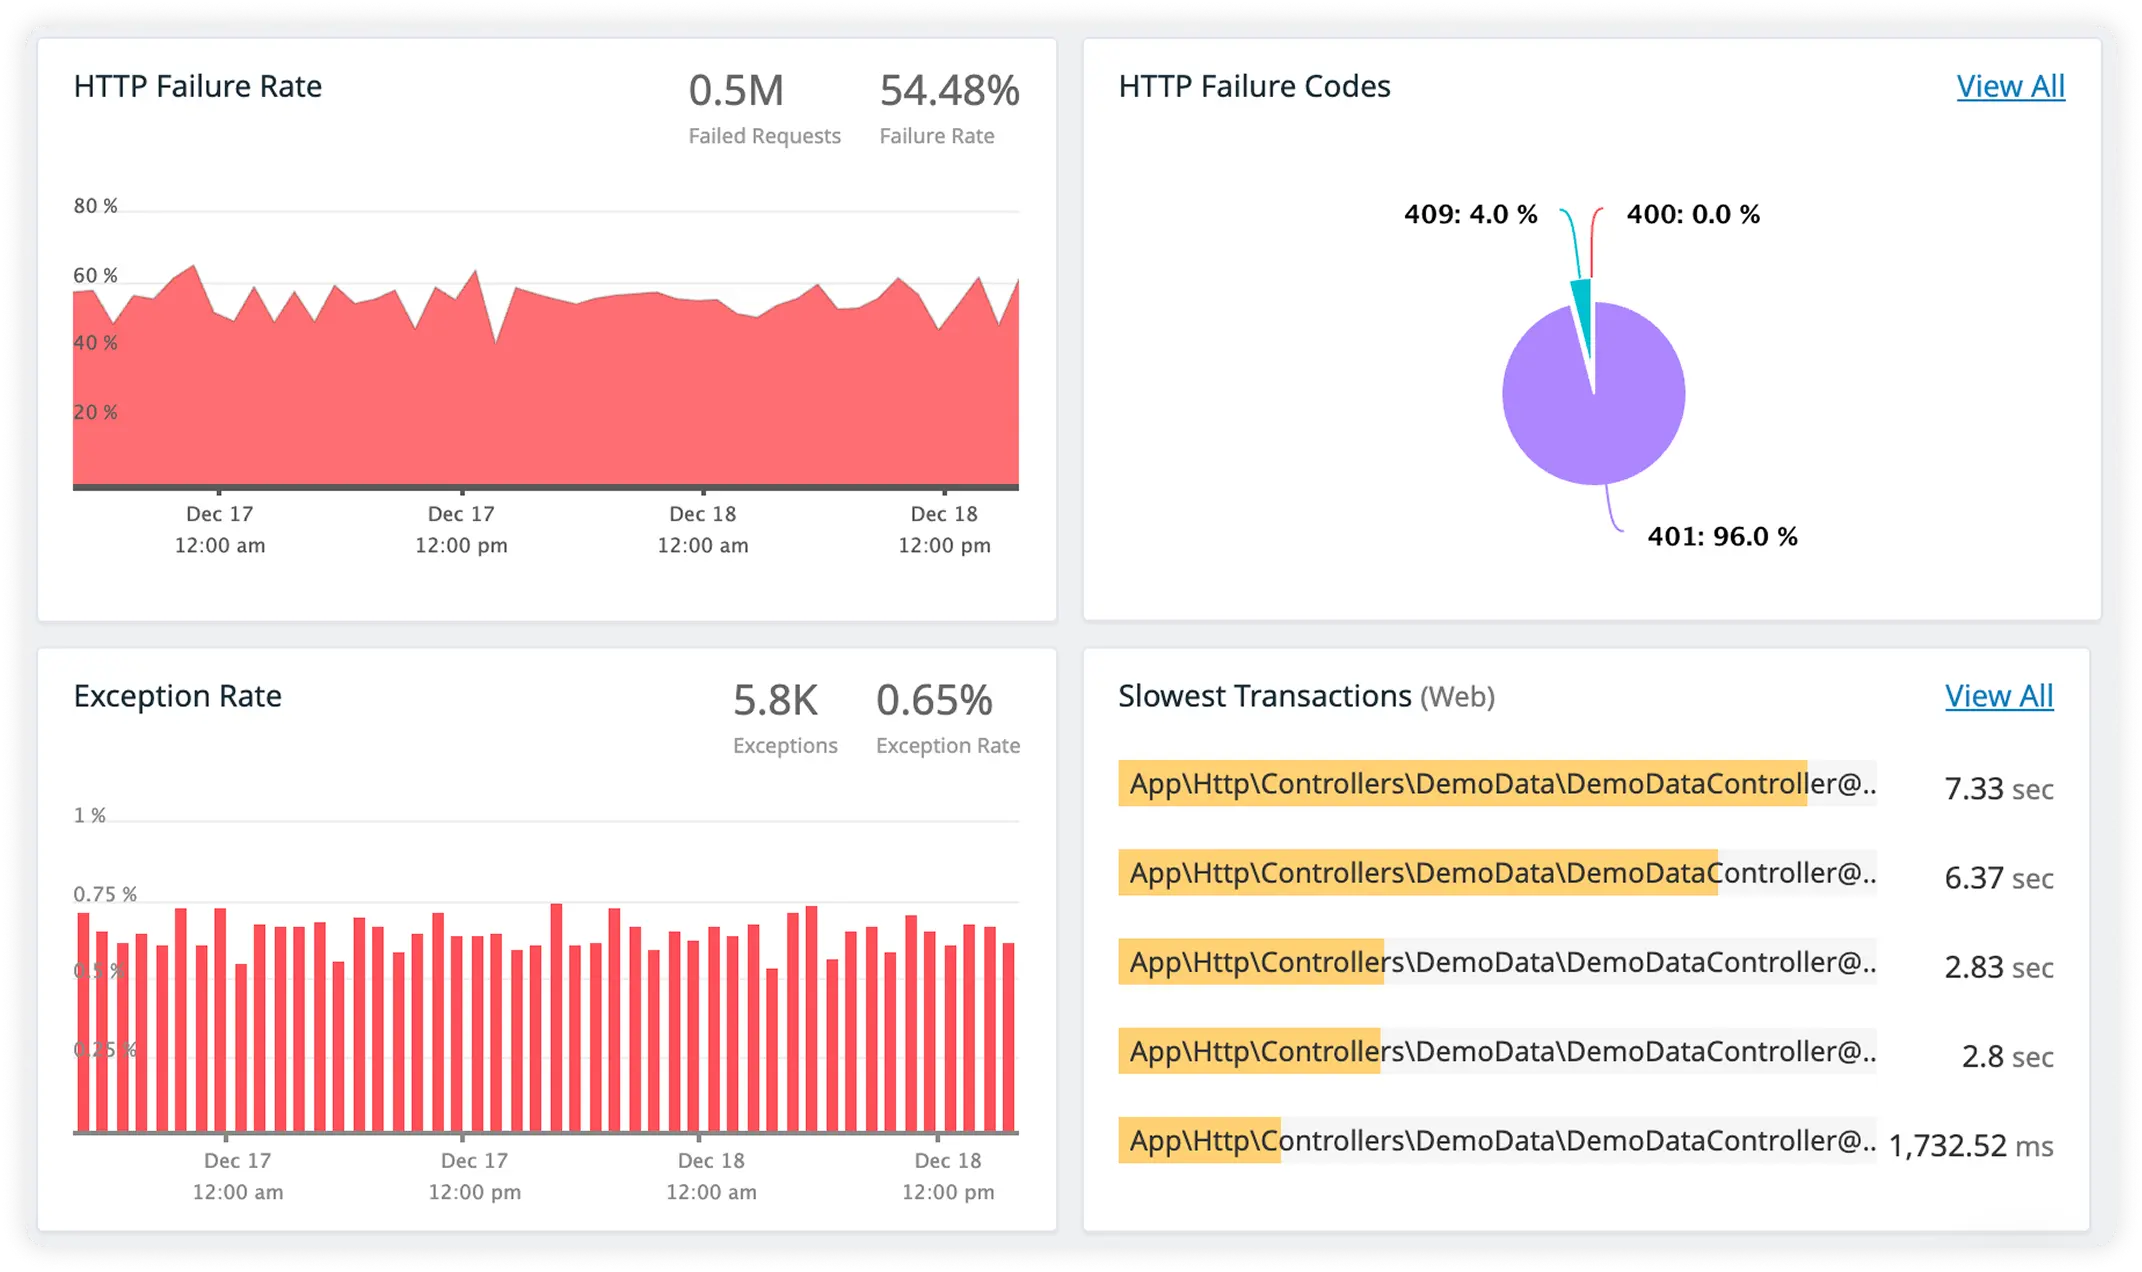
Monitor Critical Operations
Track coordination performance, request volume, and error trends to maintain cluster reliability under load.
Track External Client Requests
See how connected services impact ZooKeeper response times and overall stability continuously.
Why Teams Choose Atatus for Apache Zookeeper Observability?
Teams choose Atatus when ZooKeeper becomes a critical dependency rather than a background service. It supports how distributed coordination systems behave under real-world pressure.
Clear System State
Teams gain a coherent understanding of ensemble behavior without stitching together partial signals.
Fast Production Adoption
Operational insight becomes available quickly without prolonged rollout or risky configuration changes.
Trusted Operational Signals
Engineers rely on the data during incidents because it reflects actual coordination behavior.
Safe Runtime Presence
Runs alongside live ensembles without disrupting quorum stability or timing-sensitive operations.
Incident Ready Evidence
During failures, teams work from concrete system evidence instead of assumptions.
Scale Without Overhead
Observability remains stable as ensemble size, client load, and churn increase.
Low Maintenance Cost
Platform teams avoid maintaining fragile, custom monitoring pipelines for coordination layers.
Unified Incident Understanding
Platform, SRE, and backend teams operate from the same failure context, reducing misalignment during high-severity incidents.
Confident Dependency Trust
Teams depend on ZooKeeper with greater confidence across critical distributed systems.
Unified Observability for Every Engineering Team
Atatus adapts to how engineering teams work across development, operations, and reliability.
Developers
Trace requests, debug errors, and identify performance issues at the code level with clear context.
DevOps
Track deployments, monitor infrastructure impact, and understand how releases affect application stability.
Release Engineer
Measure service health, latency, and error rates to maintain reliability and reduce production risk.