ASP .NET Web forms Monitoring
Deliver fast response times and a seamless user experience in your ASP .NET Web Forms applications with comprehensive monitoring and observability using Atatus.
Where Web Forms production clarity breaks
Event Pipeline Opacity
Page lifecycle events execute conditionally across requests, making it difficult to confirm which stages actually ran in production.
Fragmented Request State
Errors surface without full view state, control state, or request context, forcing engineers to infer runtime conditions.
Slow Root Localization
Identifying whether failures originate in page events, server logic, or data access layers takes longer as execution complexity grows.
Hidden Data Coupling
Data access behavior varies with page state and control interaction, obscuring where latency and errors are introduced.
Async Execution Gaps
Asynchronous handlers and background operations break execution continuity, complicating accurate failure reconstruction.
Noisy Error Signals
Logs and alerts lack lifecycle context, pushing teams to investigate symptoms before identifying causes.
Scaling State Pressure
Growing session and view state increase memory and processing overhead in ways teams cannot easily observe.
Declining Production Trust
Repeated blind investigations reduce confidence in production understanding, slowing response during incidents.
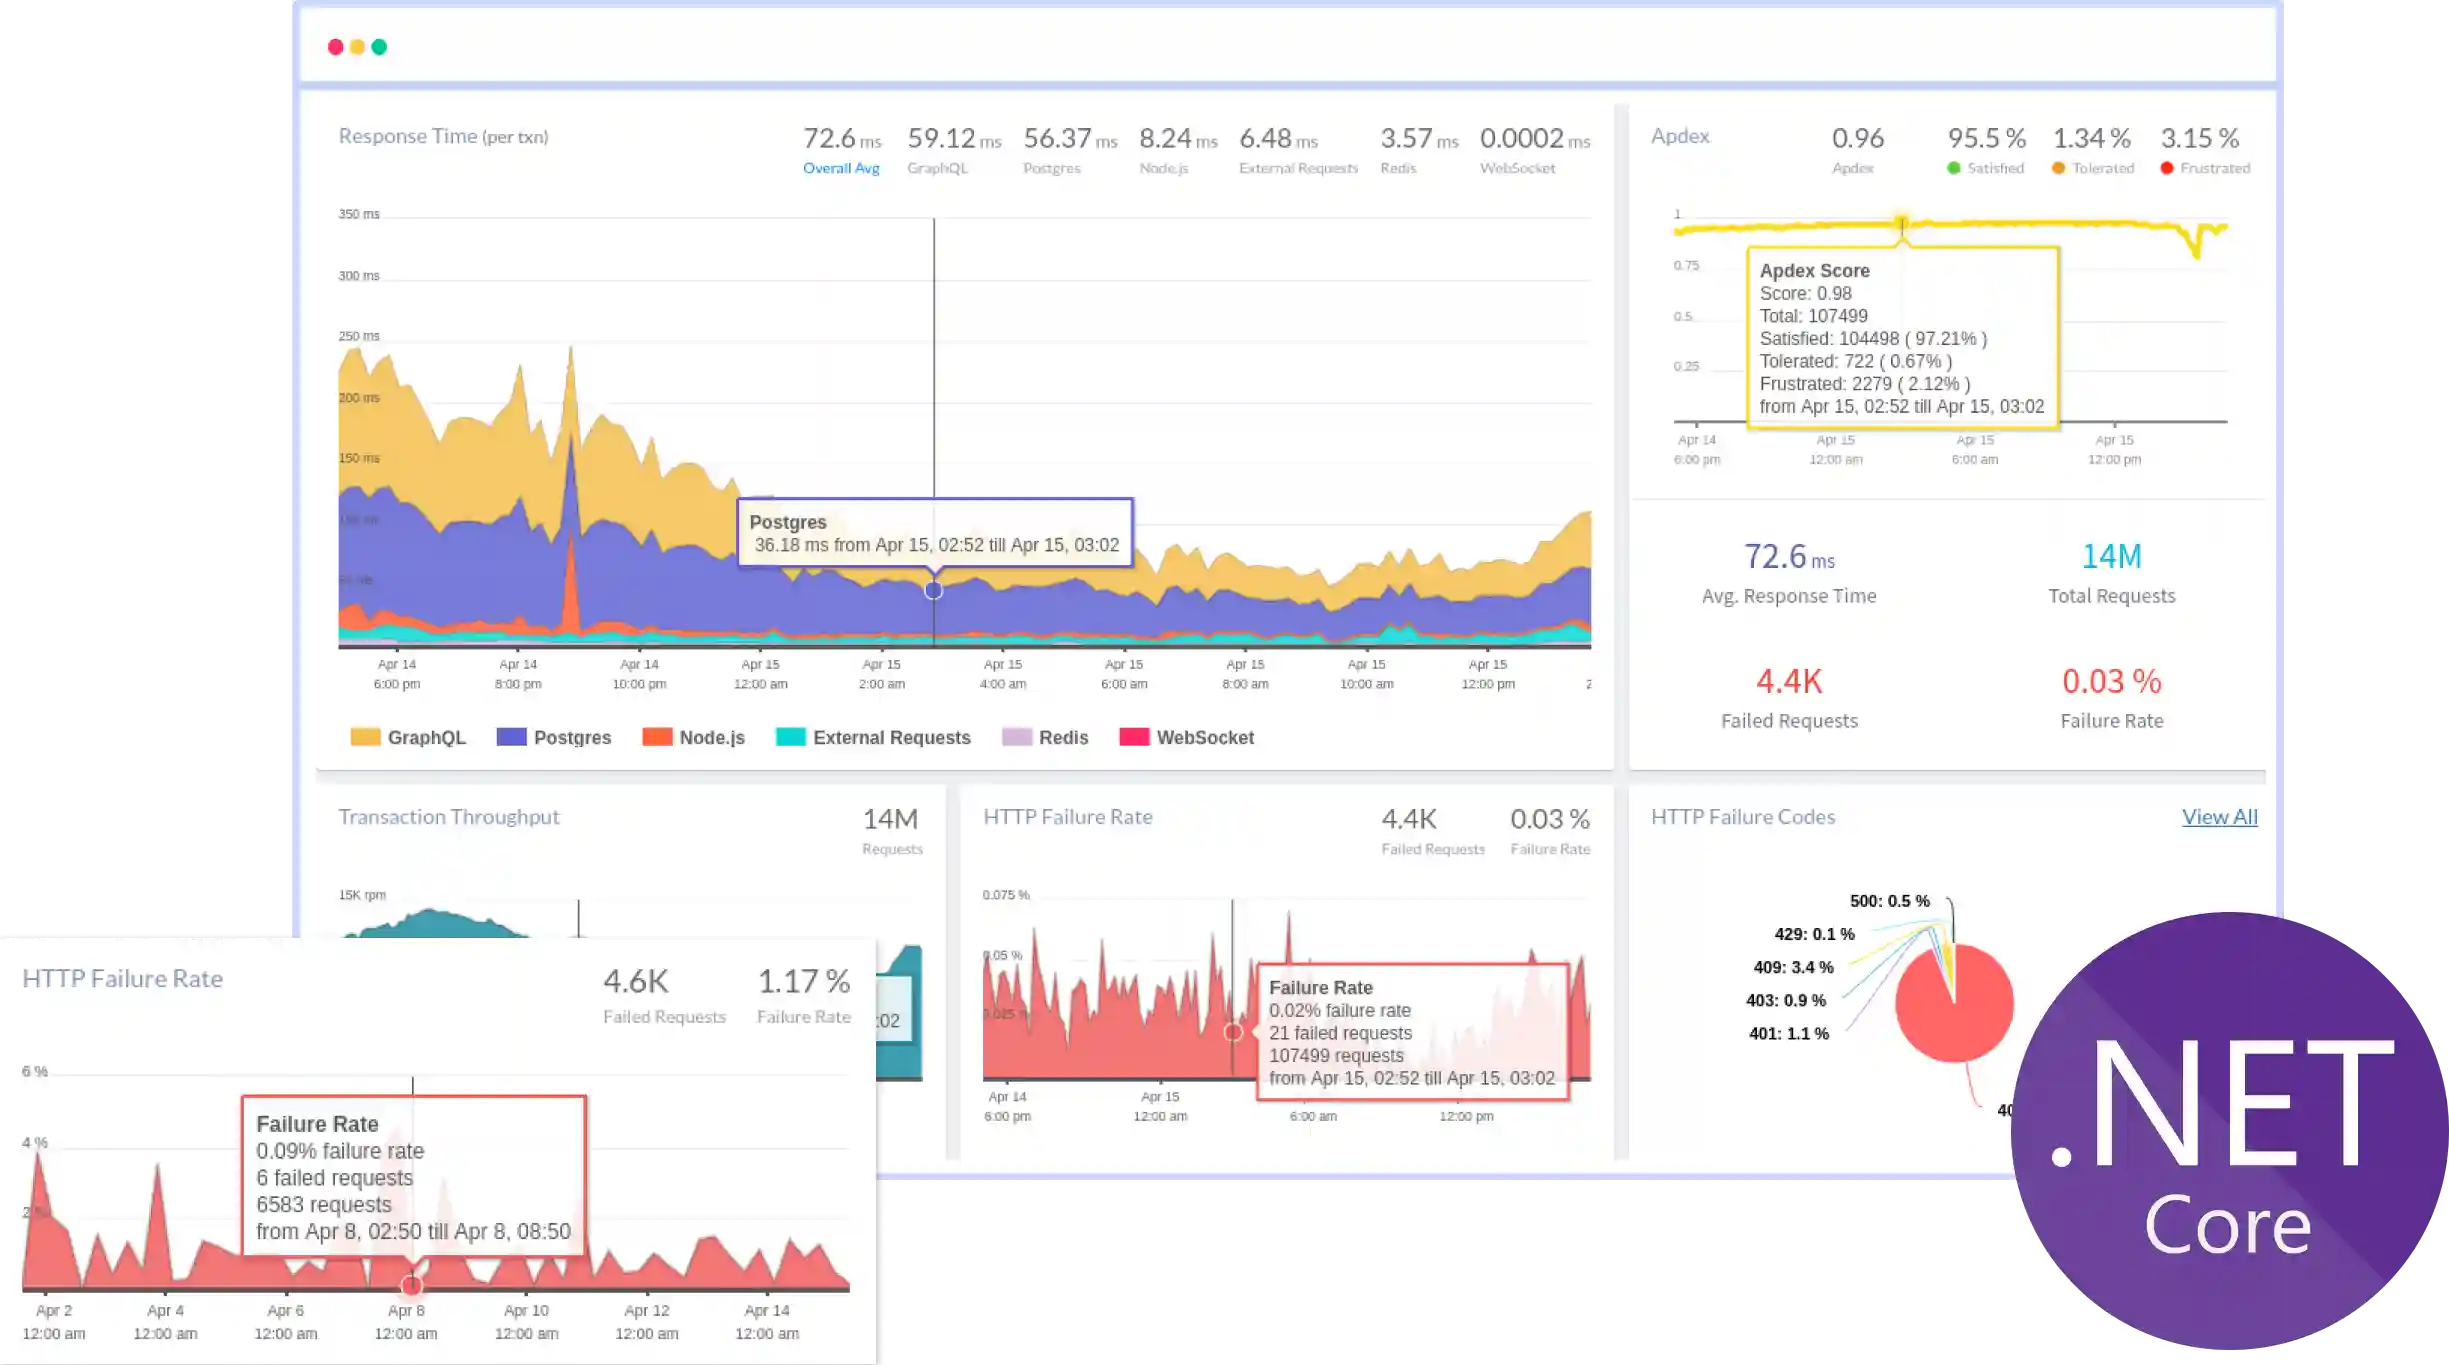
Complete Performance Visibility for
ASP.NET Applications
Real-time observability for ASP.NET workloads that helps teams trace request performance, optimize page execution, and resolve production issues faster.
End-to-End Request Timing
Track the full lifecycle of every request from entry to response. Quickly identify latency introduced across pages, handlers, and dependencies.

Page Lifecycle Duration
Measure how long each stage of the ASP.NET page lifecycle takes to execute. Pinpoint processing delays affecting user experience.

DB Call Performance
Analyze database query execution time and connection latency in real time. Eliminate inefficient database operations slowing application responses.

External Dependency Latency with Host Resource Correlation
Track response times for third-party services while correlating performance with CPU and memory usage. Understand how infrastructure impacts request speed.


Why Web Forms teams standardize on Atatus
As ASP.NET Web Forms applications age and grow, understanding layered runtime behavior becomes harder than maintaining functionality. Teams standardize on Atatus to preserve execution clarity, align engineers around the same production reality, and maintain confidence as usage, state, and ownership evolve.
Clear Execution Narrative
Engineers understand how requests move through lifecycle stages without reconstructing page flow manually.
Fast Team Onboarding
New engineers gain production understanding quickly despite legacy abstractions and accumulated complexity.
Immediate Signal Confidence
Production signals are trusted early in investigations, enabling decisive action during incidents.
Lower Debugging Overhead
Engineers spend less time correlating state and more time isolating execution faults.
Predictable Incident Response
Incident handling follows consistent patterns even as application size and traffic grow.
Shared Operational Reality
Platform, SRE, and backend teams reference the same runtime evidence during outages and reviews.
Stability Under Load
Production understanding remains intact as concurrency and state usage increase.
Reduced On-Call Fatigue
Clear execution insight shortens incident cycles and limits escalation loops for on-call engineers.
Long-Term System Confidence
Teams continue maintaining and evolving Web Forms applications without fear of unseen production behavior.
Unified Observability for Every Engineering Team
Atatus adapts to how engineering teams work across development, operations, and reliability.
Developers
Trace requests, debug errors, and identify performance issues at the code level with clear context.
DevOps
Track deployments, monitor infrastructure impact, and understand how releases affect application stability.
Release Engineer
Measure service health, latency, and error rates to maintain reliability and reduce production risk.