Beego Error and Performance Monitoring
Get complete visibility into your Beego errors and performance issues that are impacting your end user experience. Fix critical issues sooner with in depth data points that helps you in analyzing and resolving issues with great speed.
Where Beego production insight breaks
Request Lifecycle Ambiguity
Request handling can diverge based on routing rules, filters, and execution conditions, making it difficult to confirm how requests actually progressed under live traffic.
Incomplete Runtime Context
When failures occur, critical execution details are missing, forcing engineers to infer request state, timing, and runtime conditions after the incident.
Slow Fault Isolation
Errors surface late in the execution chain, increasing the time required to locate the original fault within layered request handling.
Hidden Data Path Latency
Database interactions vary based on query patterns and connection behavior, making it hard to associate slowdowns with specific execution paths.
Dependency Visibility Gaps
Internal services and external systems degrade independently, often remaining invisible until their impact compounds across the application.
Noisy Error Signals
Error notifications lack execution context, pushing teams to investigate symptoms before identifying the underlying cause.
Unclear Concurrency Effects
Goroutine scheduling and parallel execution introduce runtime behavior changes that teams cannot easily observe in real time.
Declining Operational Confidence
Repeated investigations without clear answers reduce trust in production understanding, slowing response during high-impact incidents.
Complete Performance Visibility for
Beego Applications
Real-time observability for Beego workloads that helps teams trace request performance, optimize handler execution, and resolve production issues faster.
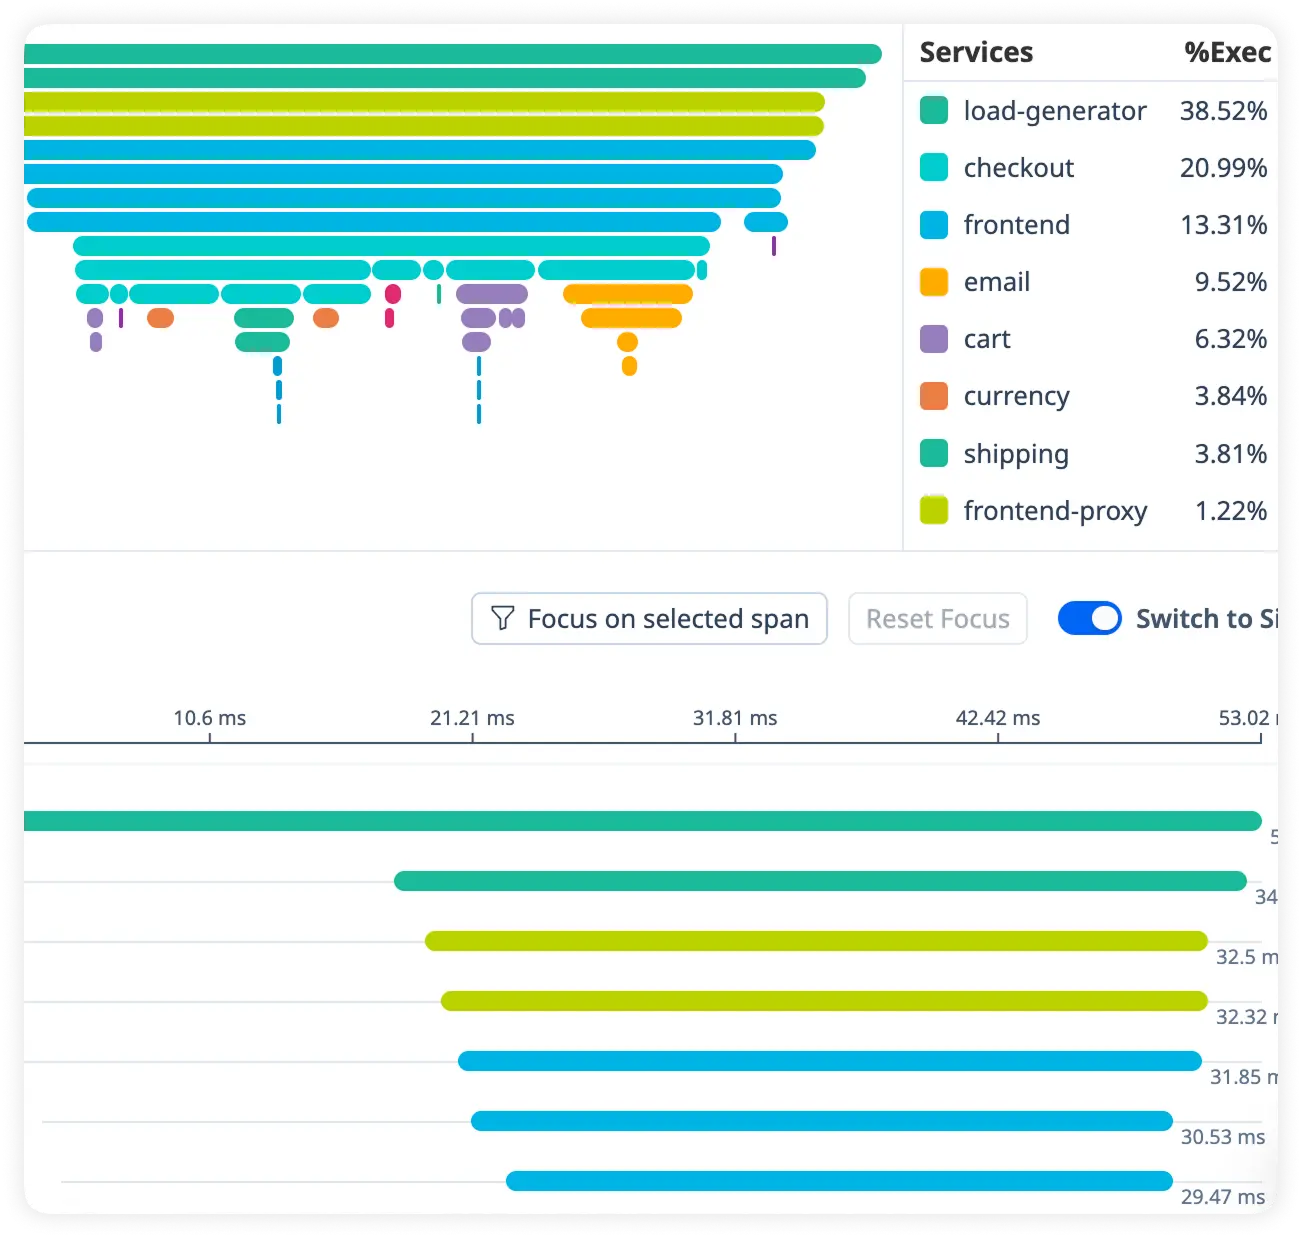
End-to-End Request Timing
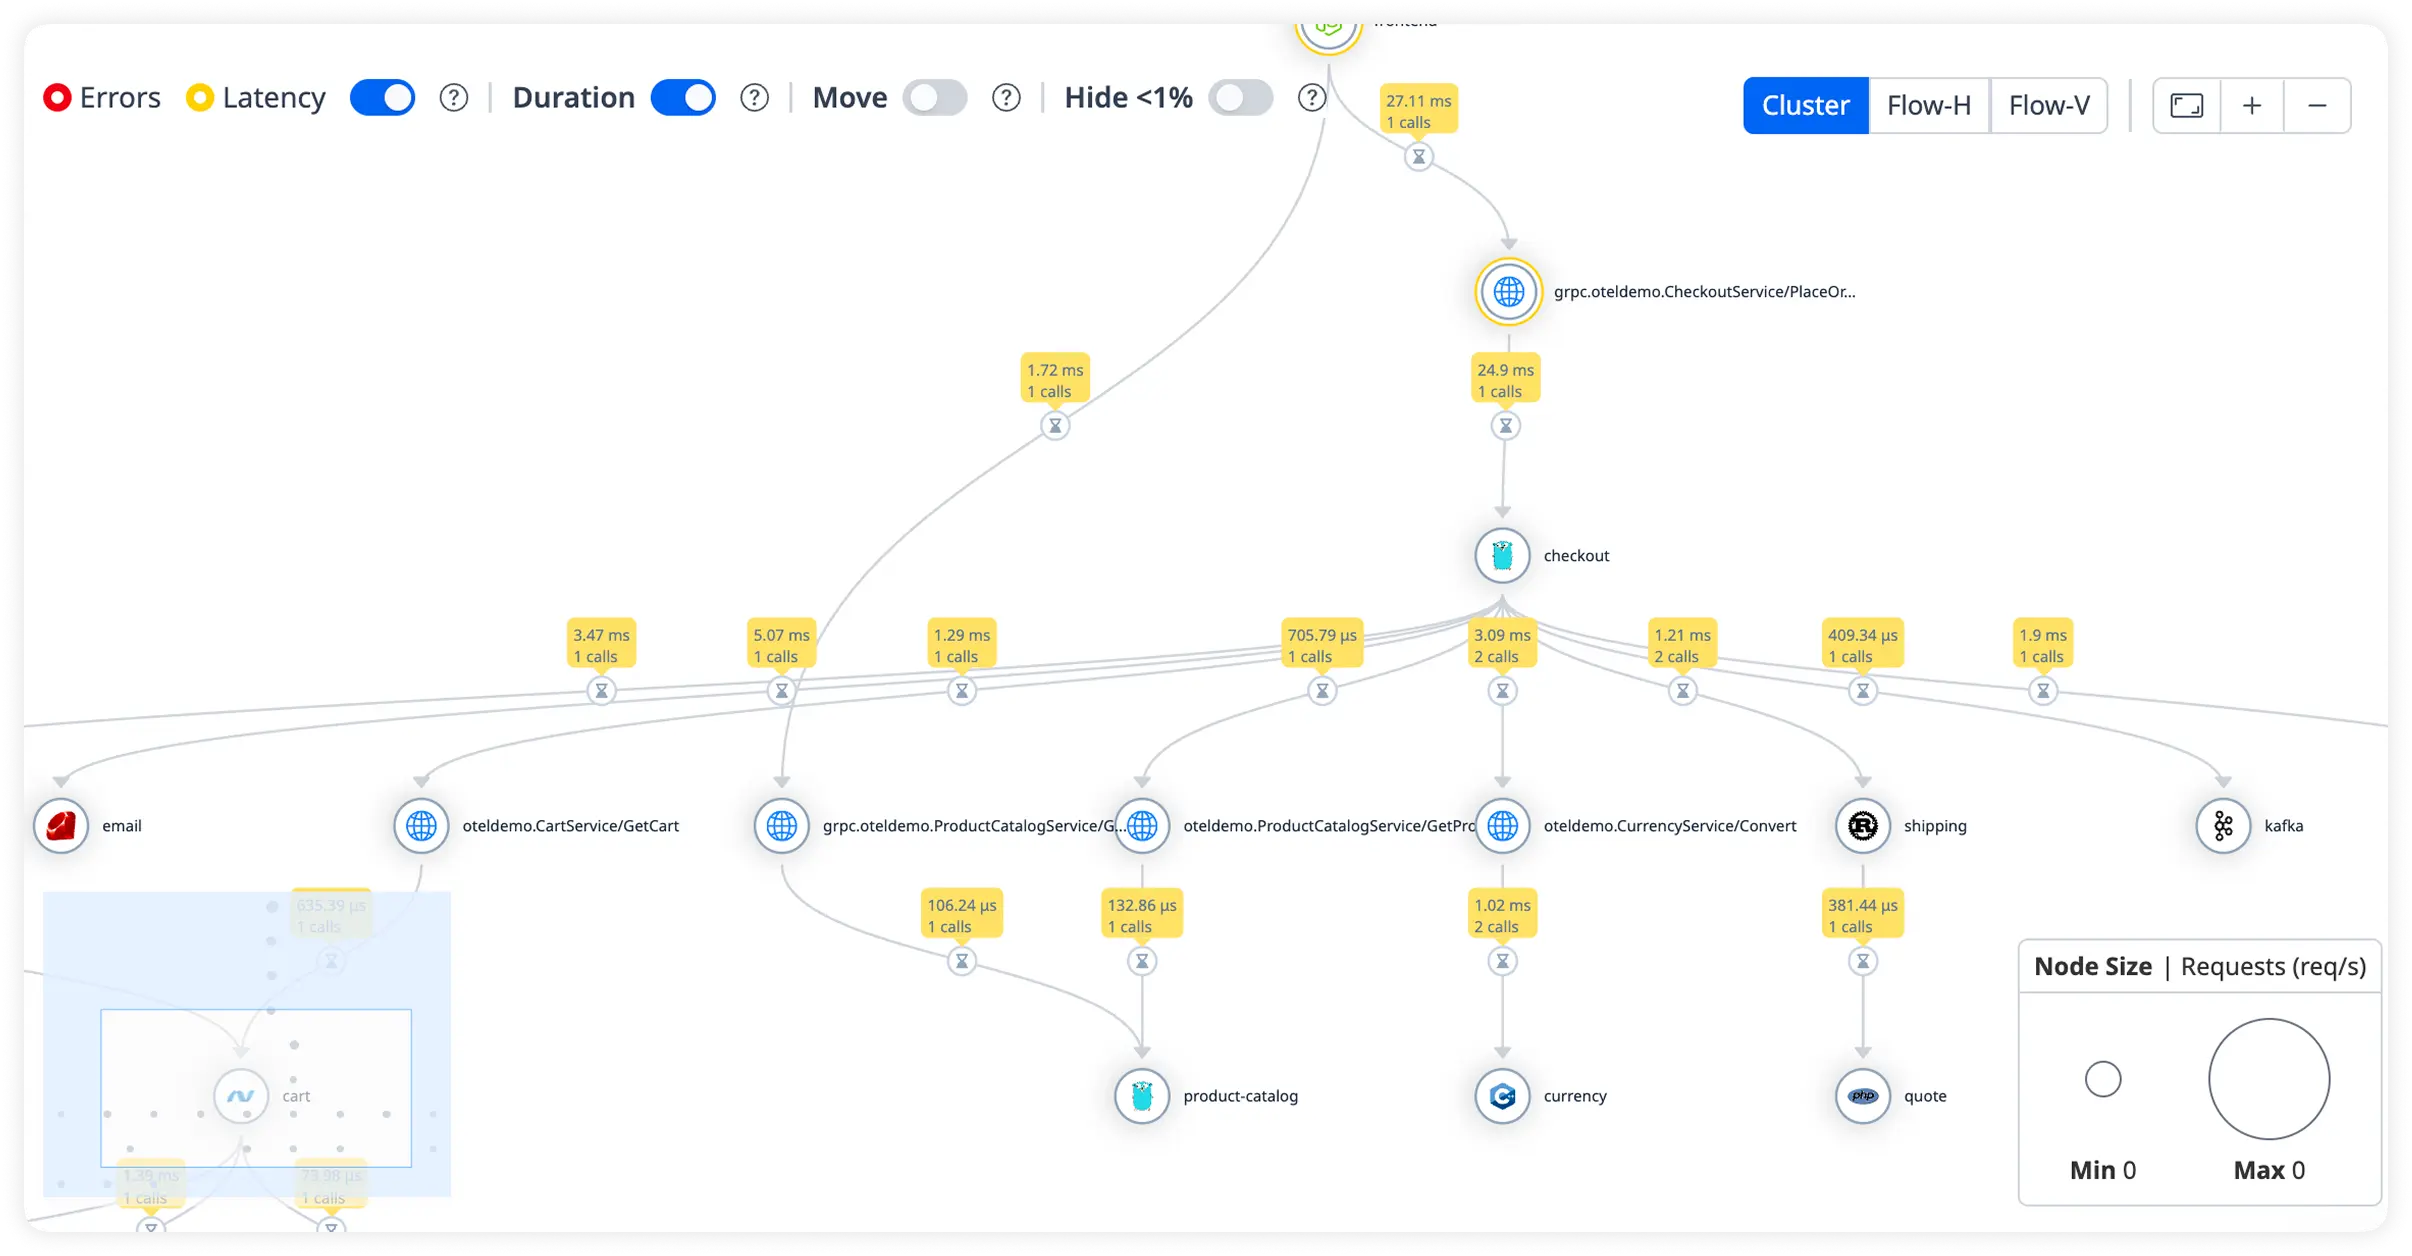
Track the full lifecycle of every request from entry to response. Quickly identify latency introduced across handlers, services, and dependencies.
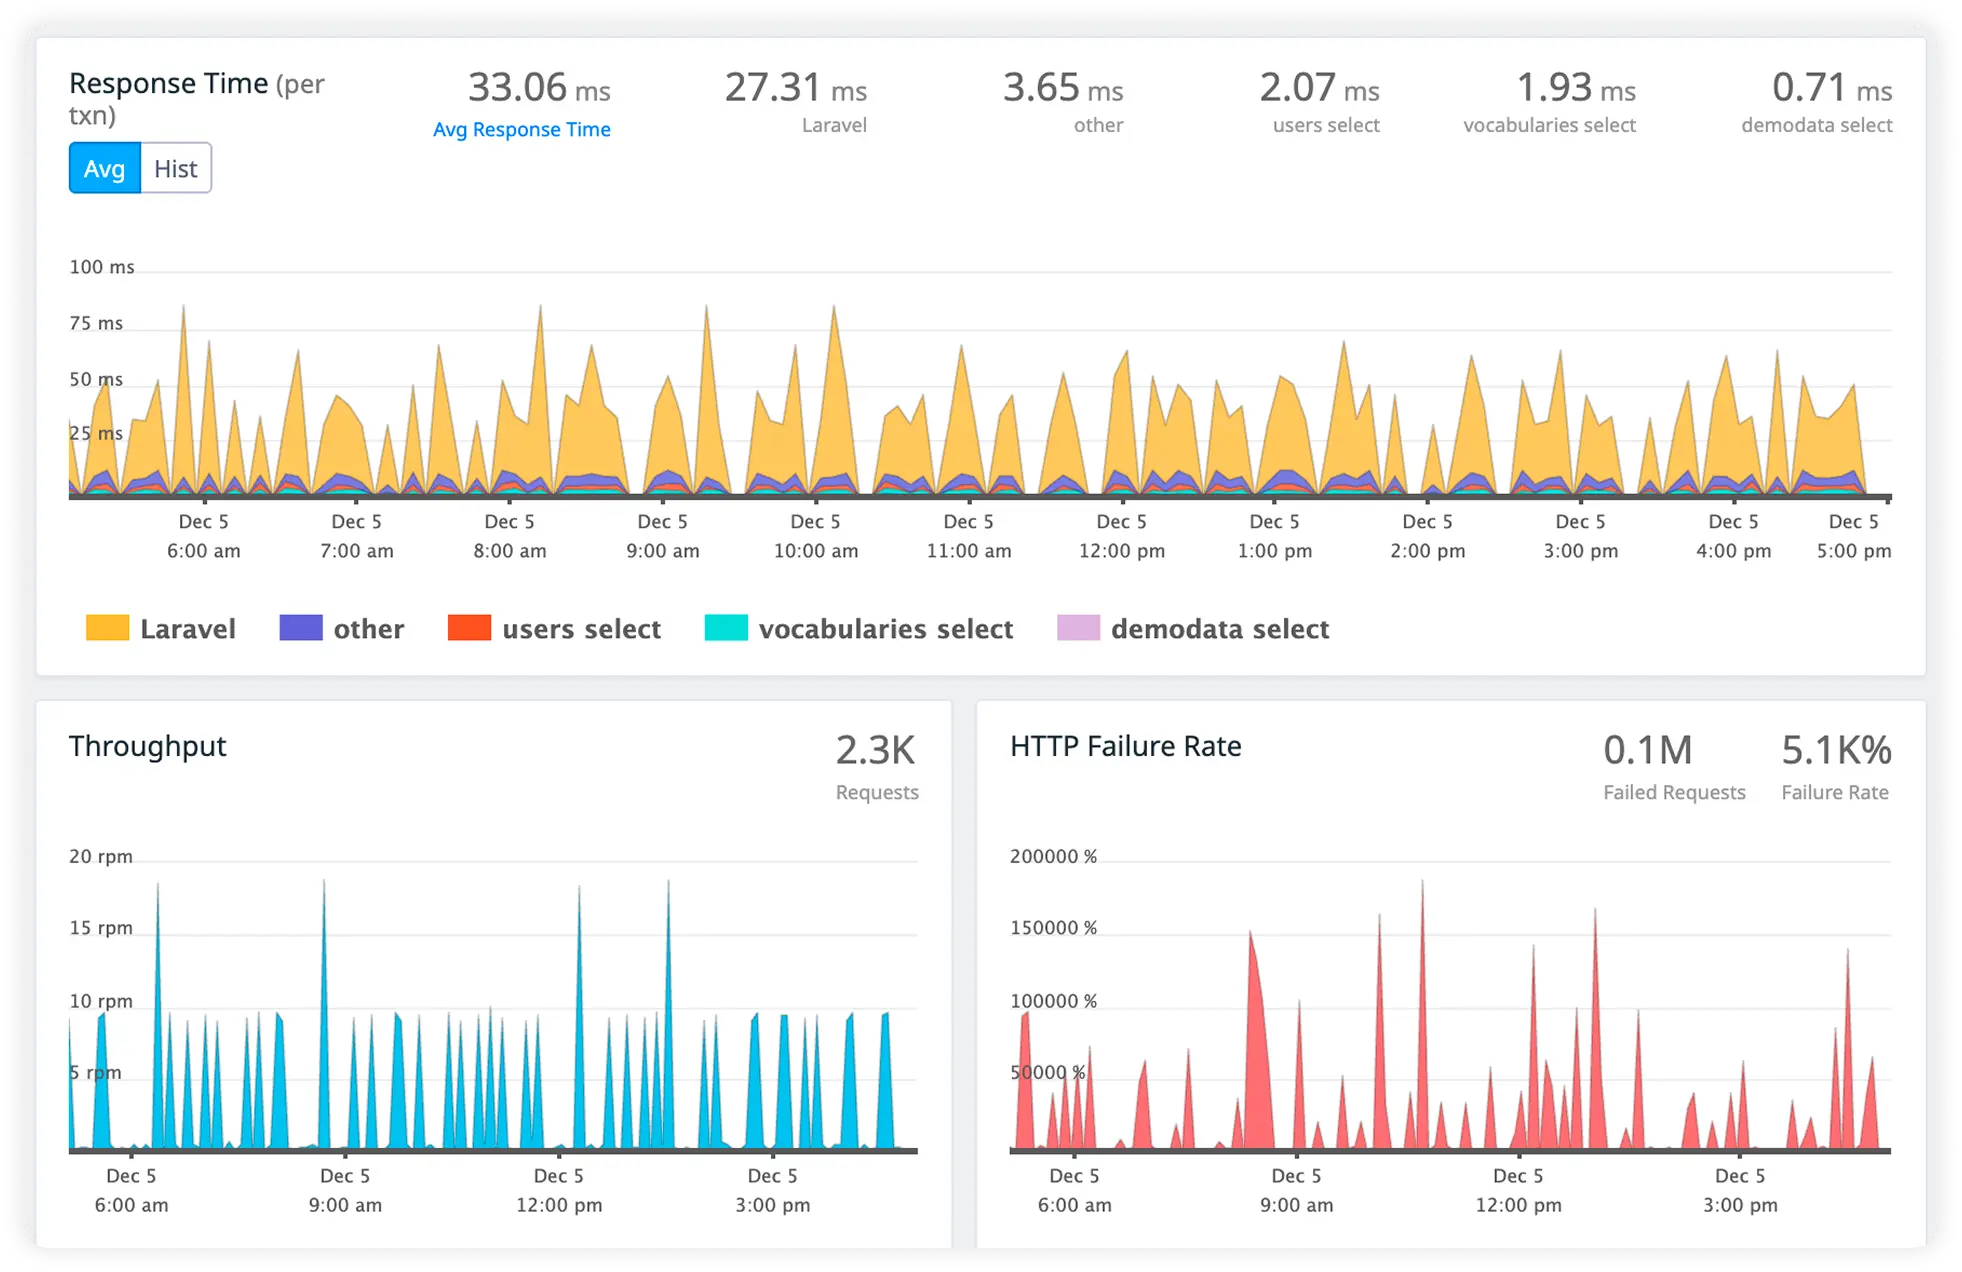
Response Timing
Monitor reponse time, throughput and http failure rate in real time. Eliminate inefficient queries slowing application responses.
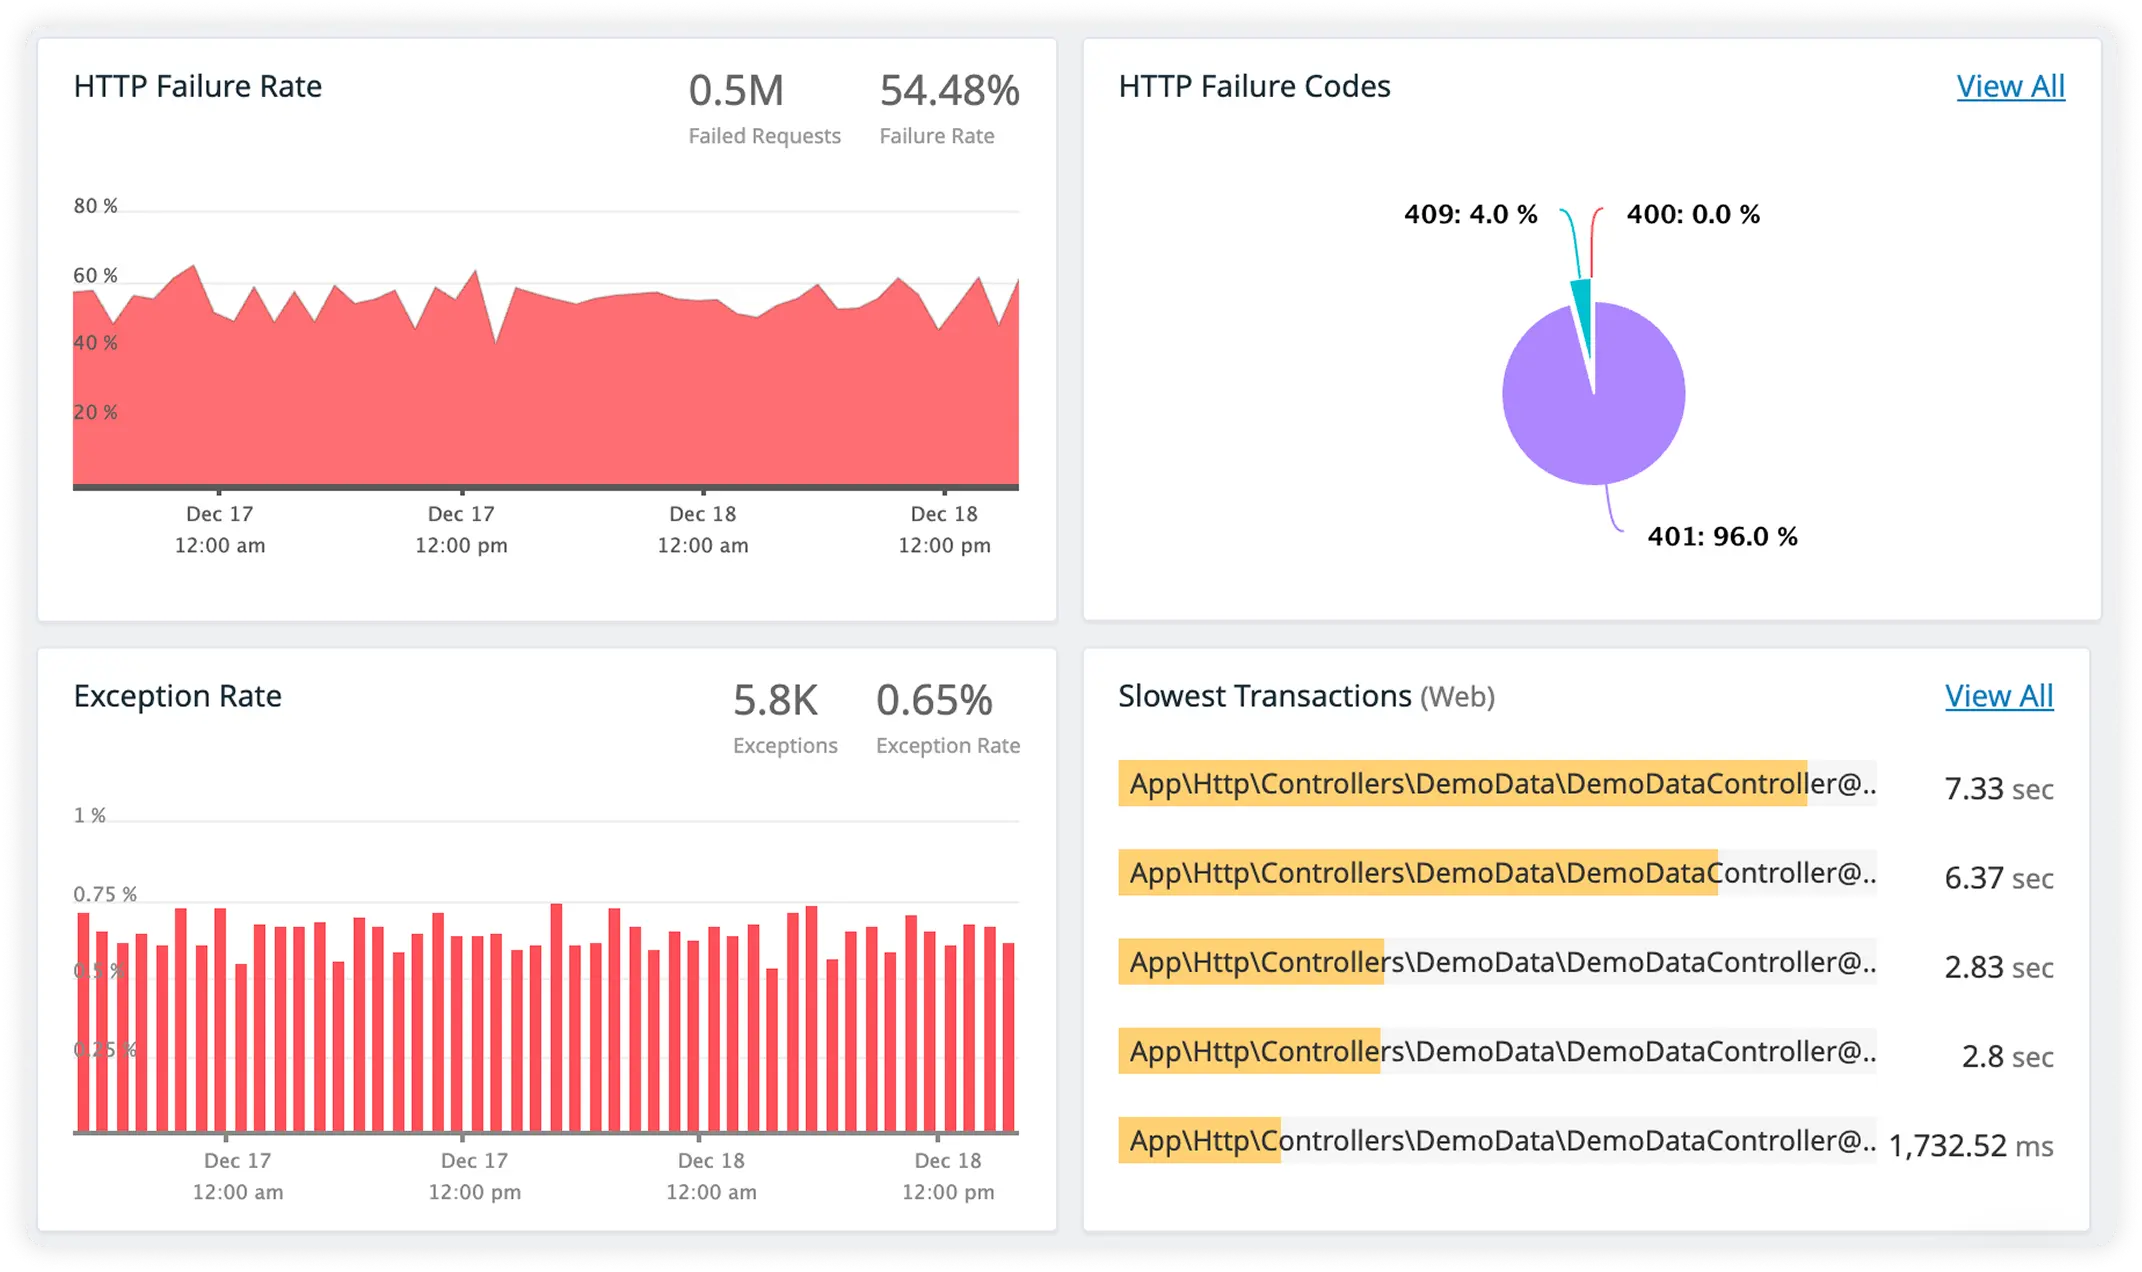
External Call Latency
Track response times for third-party APIs and external services. Identify slow dependencies before they impact user experience.
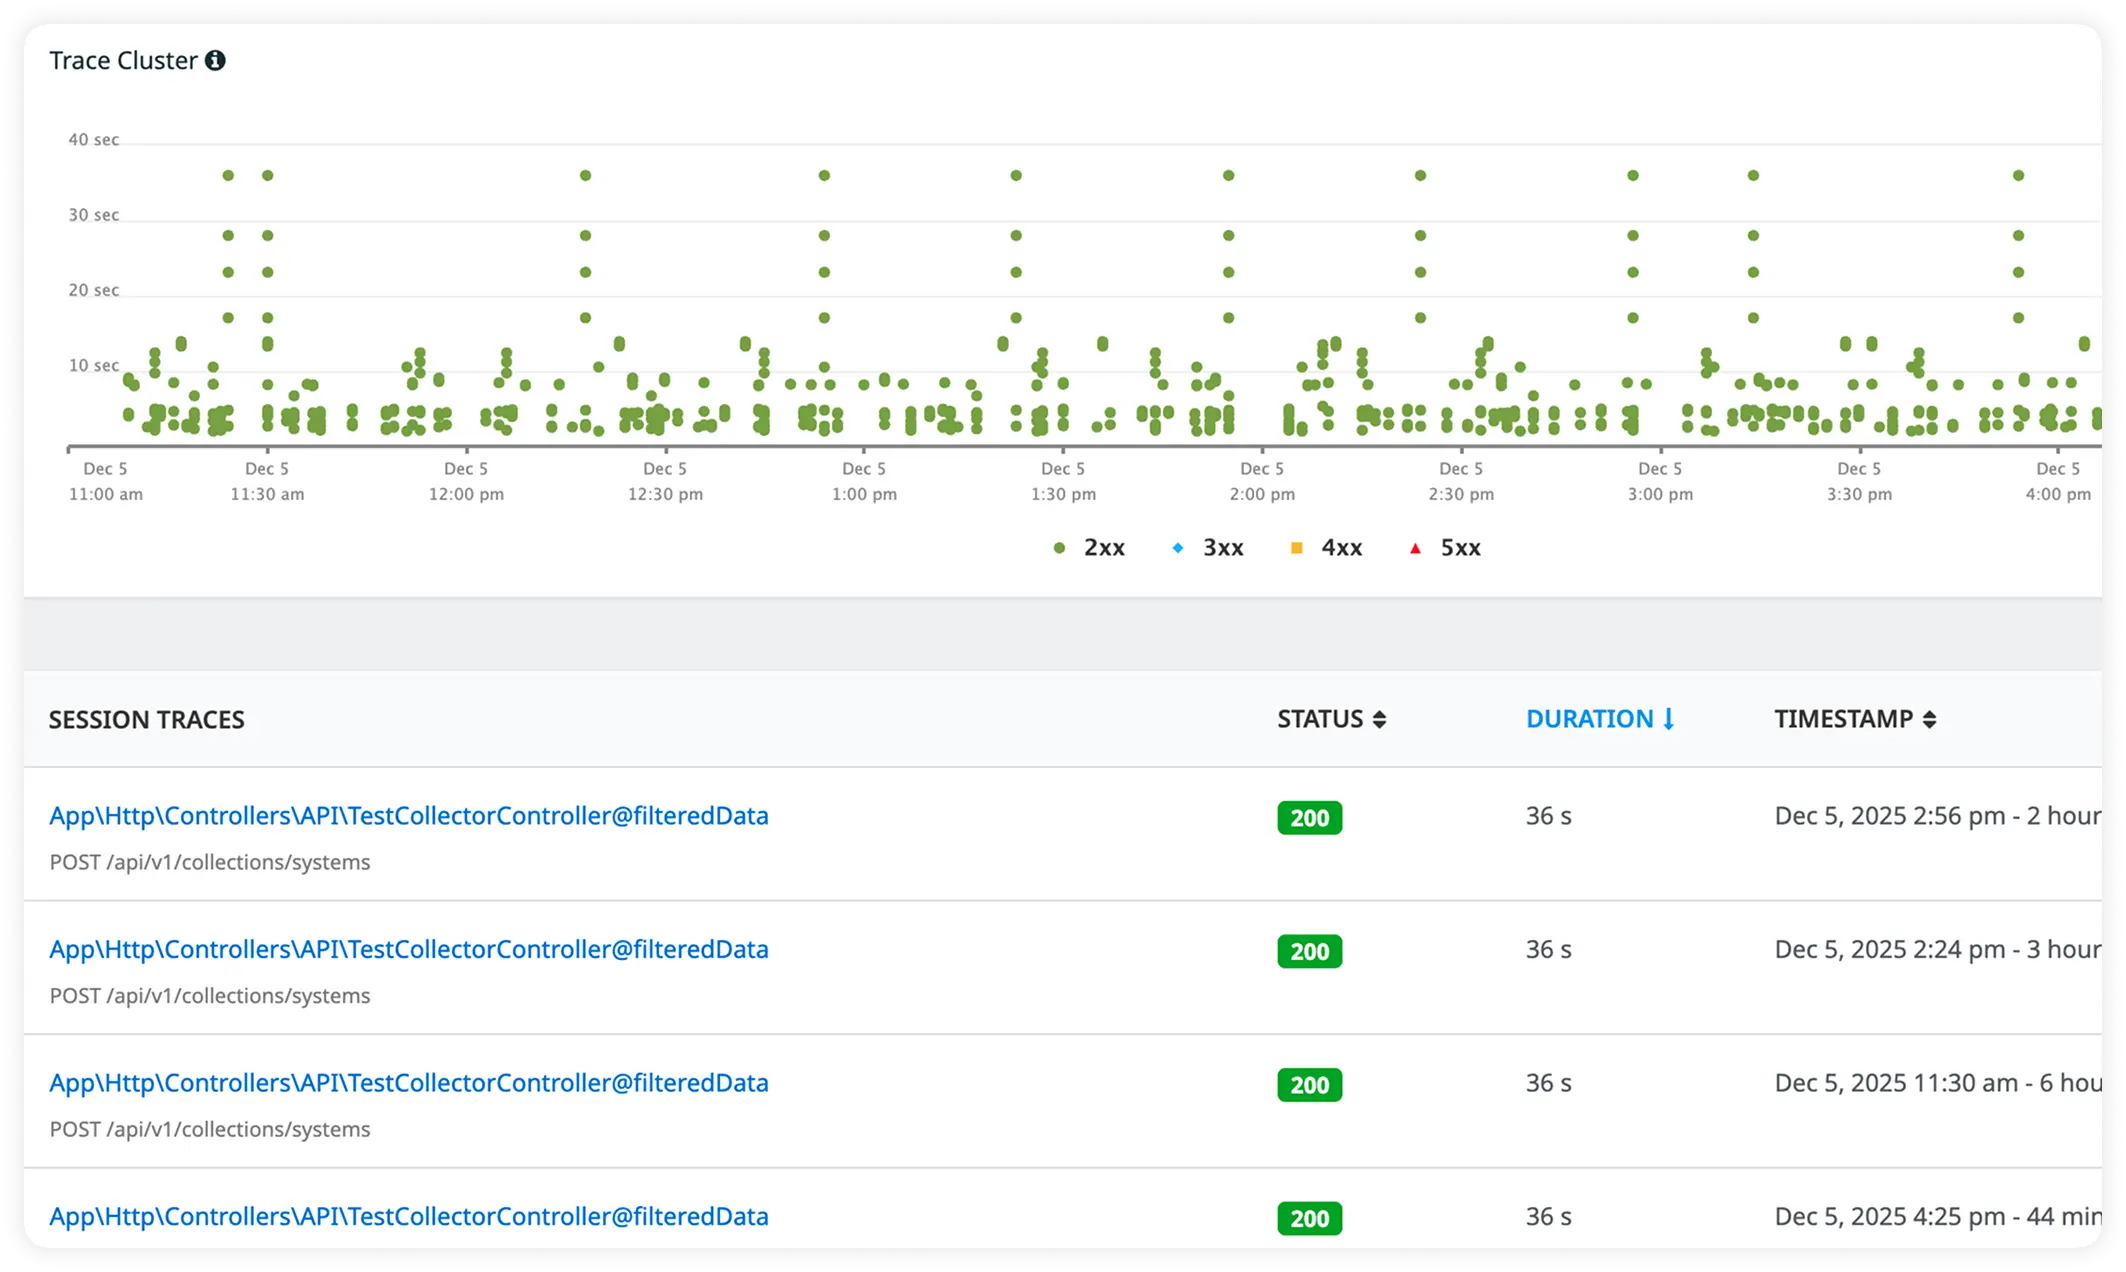
Handler Execution Weight with Host Resource Metrics
Measure handler processing cost while monitoring CPU and memory usage. Understand how application logic and infrastructure affect performance together.
Why Beego teams standardize on Atatus
As Beego systems evolve, maintaining production understanding becomes harder than maintaining performance. Teams standardize on Atatus to preserve execution clarity as traffic, concurrency, and service boundaries increase, enabling confident decisions under pressure.
Coherent Execution Understanding
Engineers retain a clear picture of how requests behave in production without reconstructing control flow from scattered signals.
Rapid Team Alignment
New and existing engineers reach shared production understanding quickly, reducing reliance on handovers or undocumented knowledge.
Immediate Signal Trust
Teams trust runtime data early in investigations, allowing faster action without second-guessing signal accuracy.
Lower Debugging Overhead
Investigation effort drops as engineers spend less time correlating components and more time validating root causes.
Predictable Incident Response
Incident handling follows repeatable patterns, even as system complexity and traffic increase.
Shared Operational Reality
Platform, SRE, and backend teams operate from the same execution evidence during incidents and reviews.
Stability Under Load
Production understanding remains reliable as concurrency and throughput rise, preventing new blind spots from emerging.
Reduced On-Call Strain
Clear runtime insight shortens incident duration and reduces escalation loops during on-call rotations.
Long-Term System Confidence
Teams continue scaling and refactoring with confidence, knowing production behavior will remain observable.
Unified Observability for Every Engineering Team
Atatus adapts to how engineering teams work across development, operations, and reliability.
Developers
Trace requests, debug errors, and identify performance issues at the code level with clear context.
DevOps
Track deployments, monitor infrastructure impact, and understand how releases affect application stability.
Release Engineer
Measure service health, latency, and error rates to maintain reliability and reduce production risk.