CodeIgniter Performance Monitoring
Get end-to-end visibility into your CodeIgniter performance with application monitoring tools. Gain insightful metrics on performance bottlenecks with PHP monitoring to optimize your application.
Why CodeIgniter Production Issues Are Hard to Pinpoint?
Thin Framework Blindspots
CodeIgniter stays intentionally lightweight. In production, this means execution happens with very little structural visibility when something slows down.
Controller-Centric Coupling
Business logic accumulates inside controllers over time. When performance degrades, teams struggle to separate routing, logic, and I/O cost.
Implicit Execution Paths
Helpers, libraries, and global functions execute implicitly. Under load, these hidden paths make runtime behavior difficult to reconstruct.
Query Placement Drift
Database queries live across controllers, models, and helpers. Response time increases without a clear ownership boundary.
Production-Only Data Shapes
Real user data volumes differ sharply from staging. Edge cases surface only when live payloads hit production logic.
Silent Error Escalation
Non-fatal warnings and recoverable errors accumulate quietly, masking deeper runtime problems until failures become visible.
Request Time Variability
Identical requests show inconsistent execution times in production, making it difficult to understand what actually changed between fast and slow runs.
Error Without Context
Production errors surface without enough execution detail, forcing engineers to investigate failures without knowing what the request was doing at the time.
Clear Performance Visibility for
CodeIgniter Applications
Real-time observability for CodeIgniter that helps teams understand request behavior, optimize performance, and resolve production issues faster.
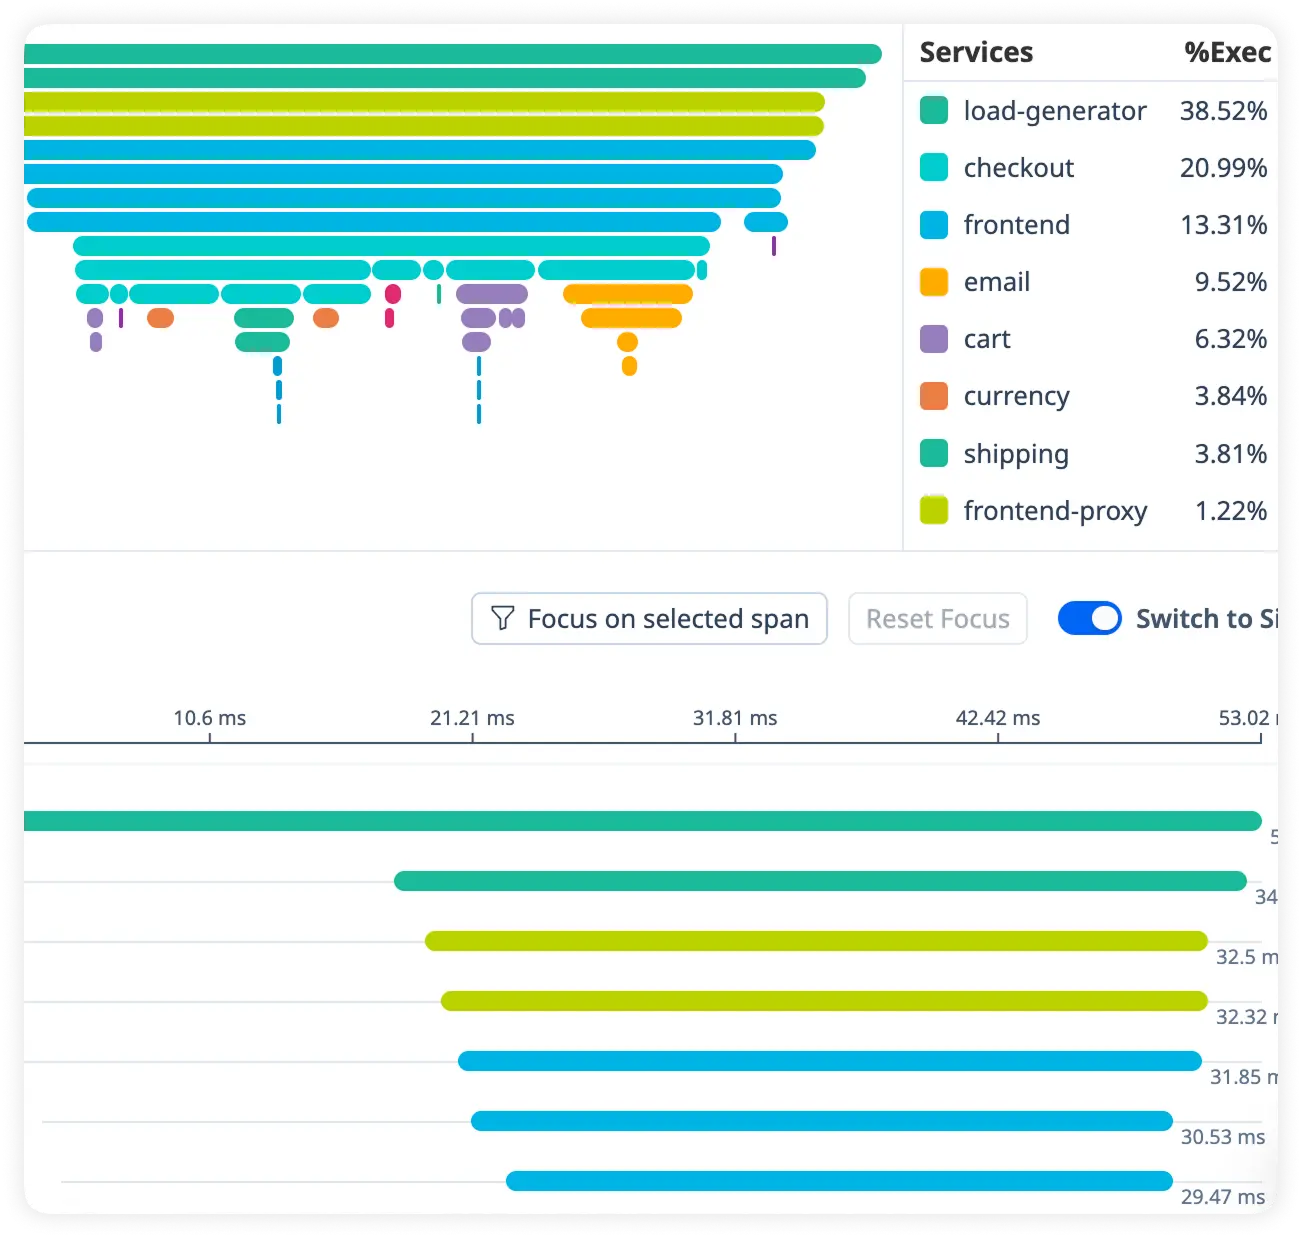
Detailed Route Timing Breakdown
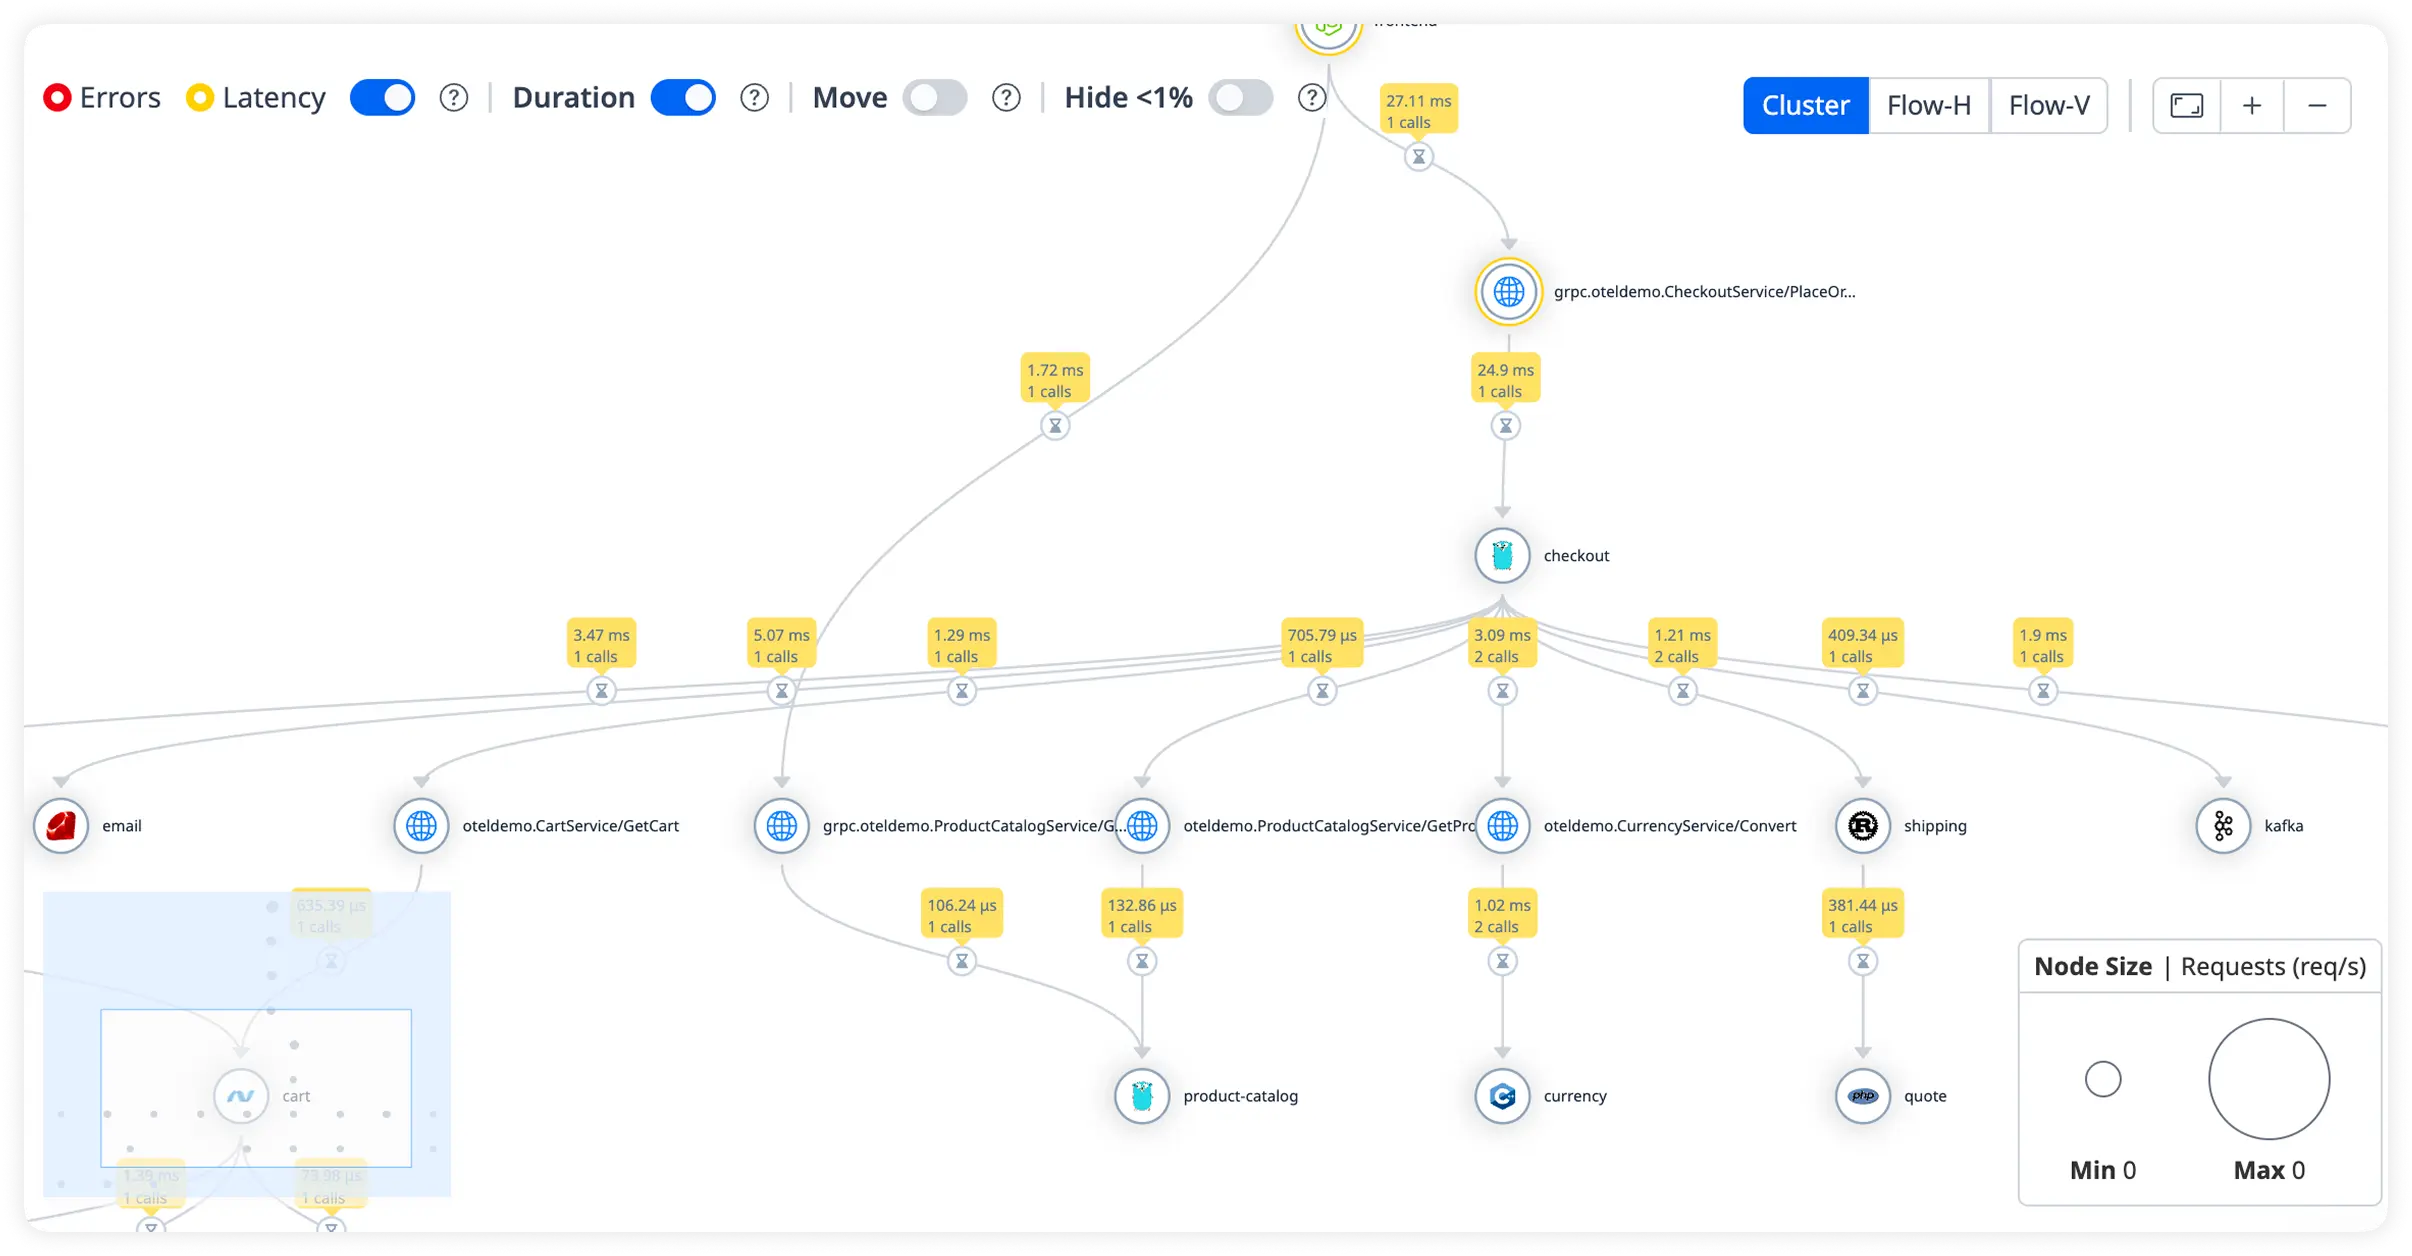
See exactly how long each route and controller takes to execute. Quickly uncover slow endpoints affecting response times.
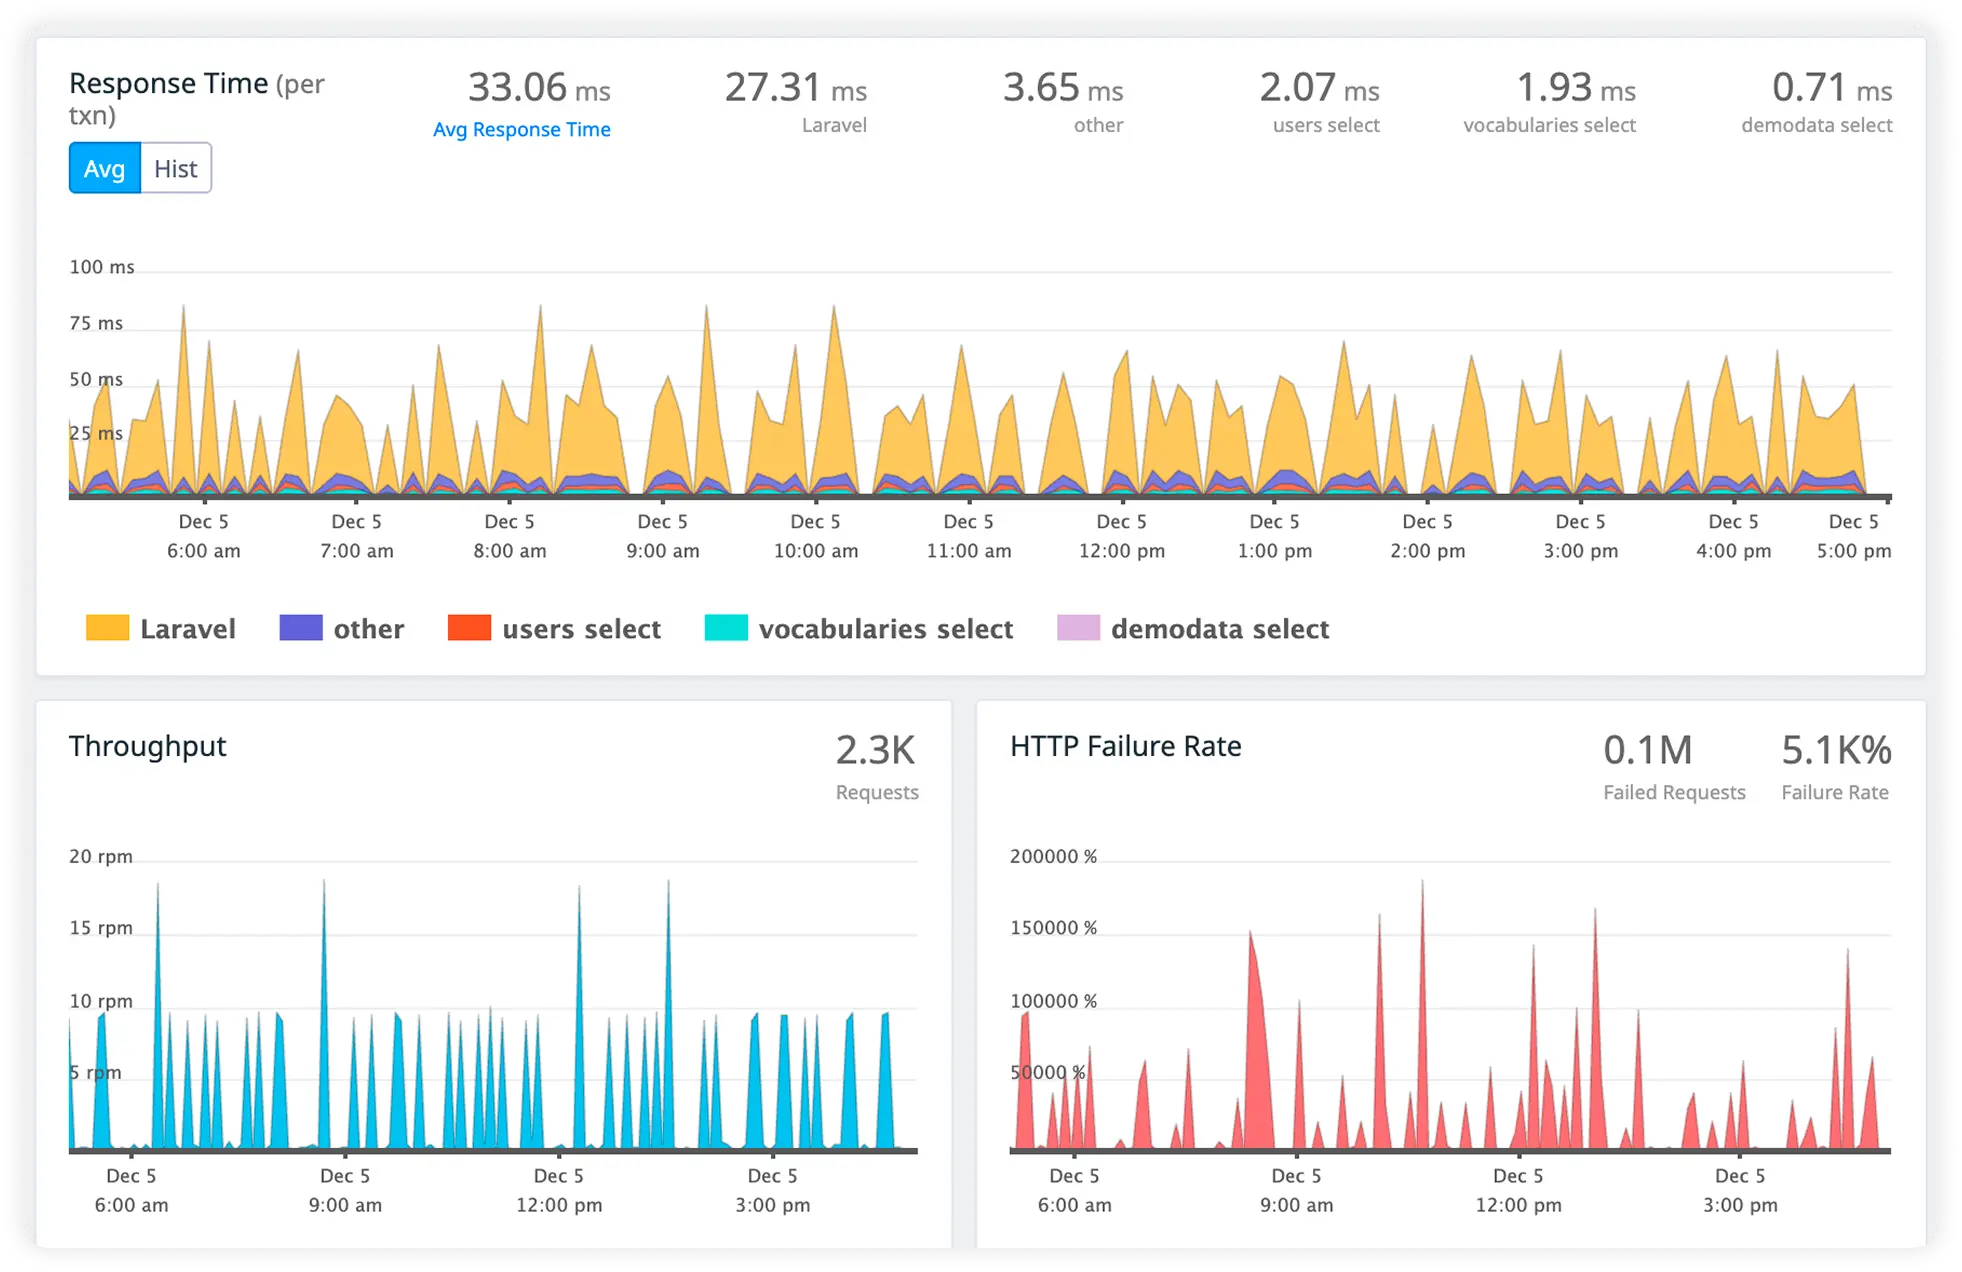
Actionable Slow Query Insight
Monitor inefficient database queries and execution time in real time. Eliminate database bottlenecks that degrade application performance.
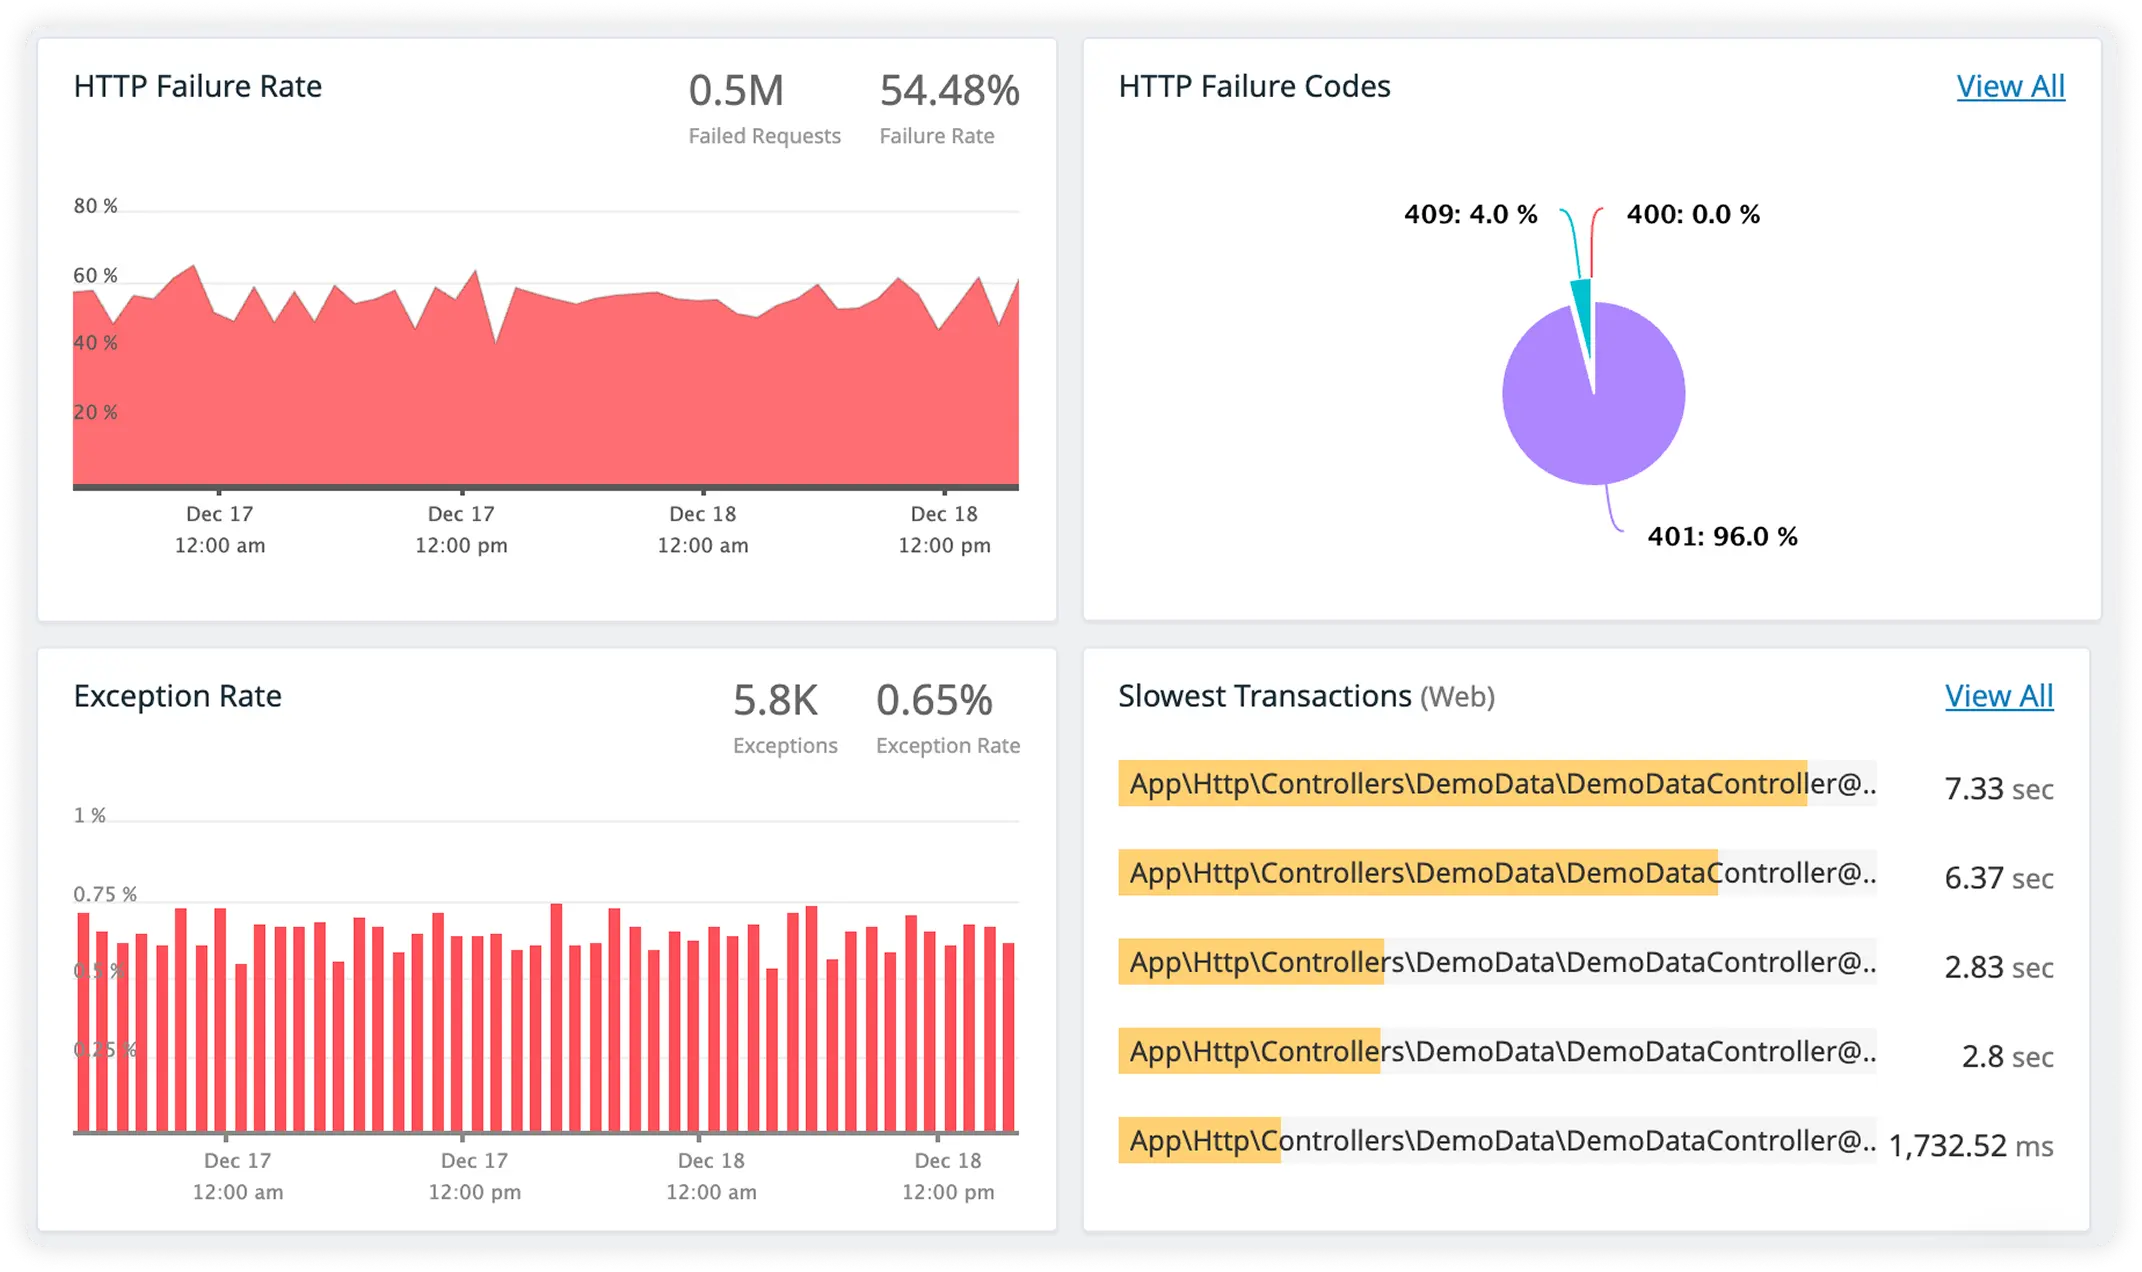
Understand External Call Impact
Track response times for third-party APIs and external services. Identify slow or failing dependencies before they impact users.
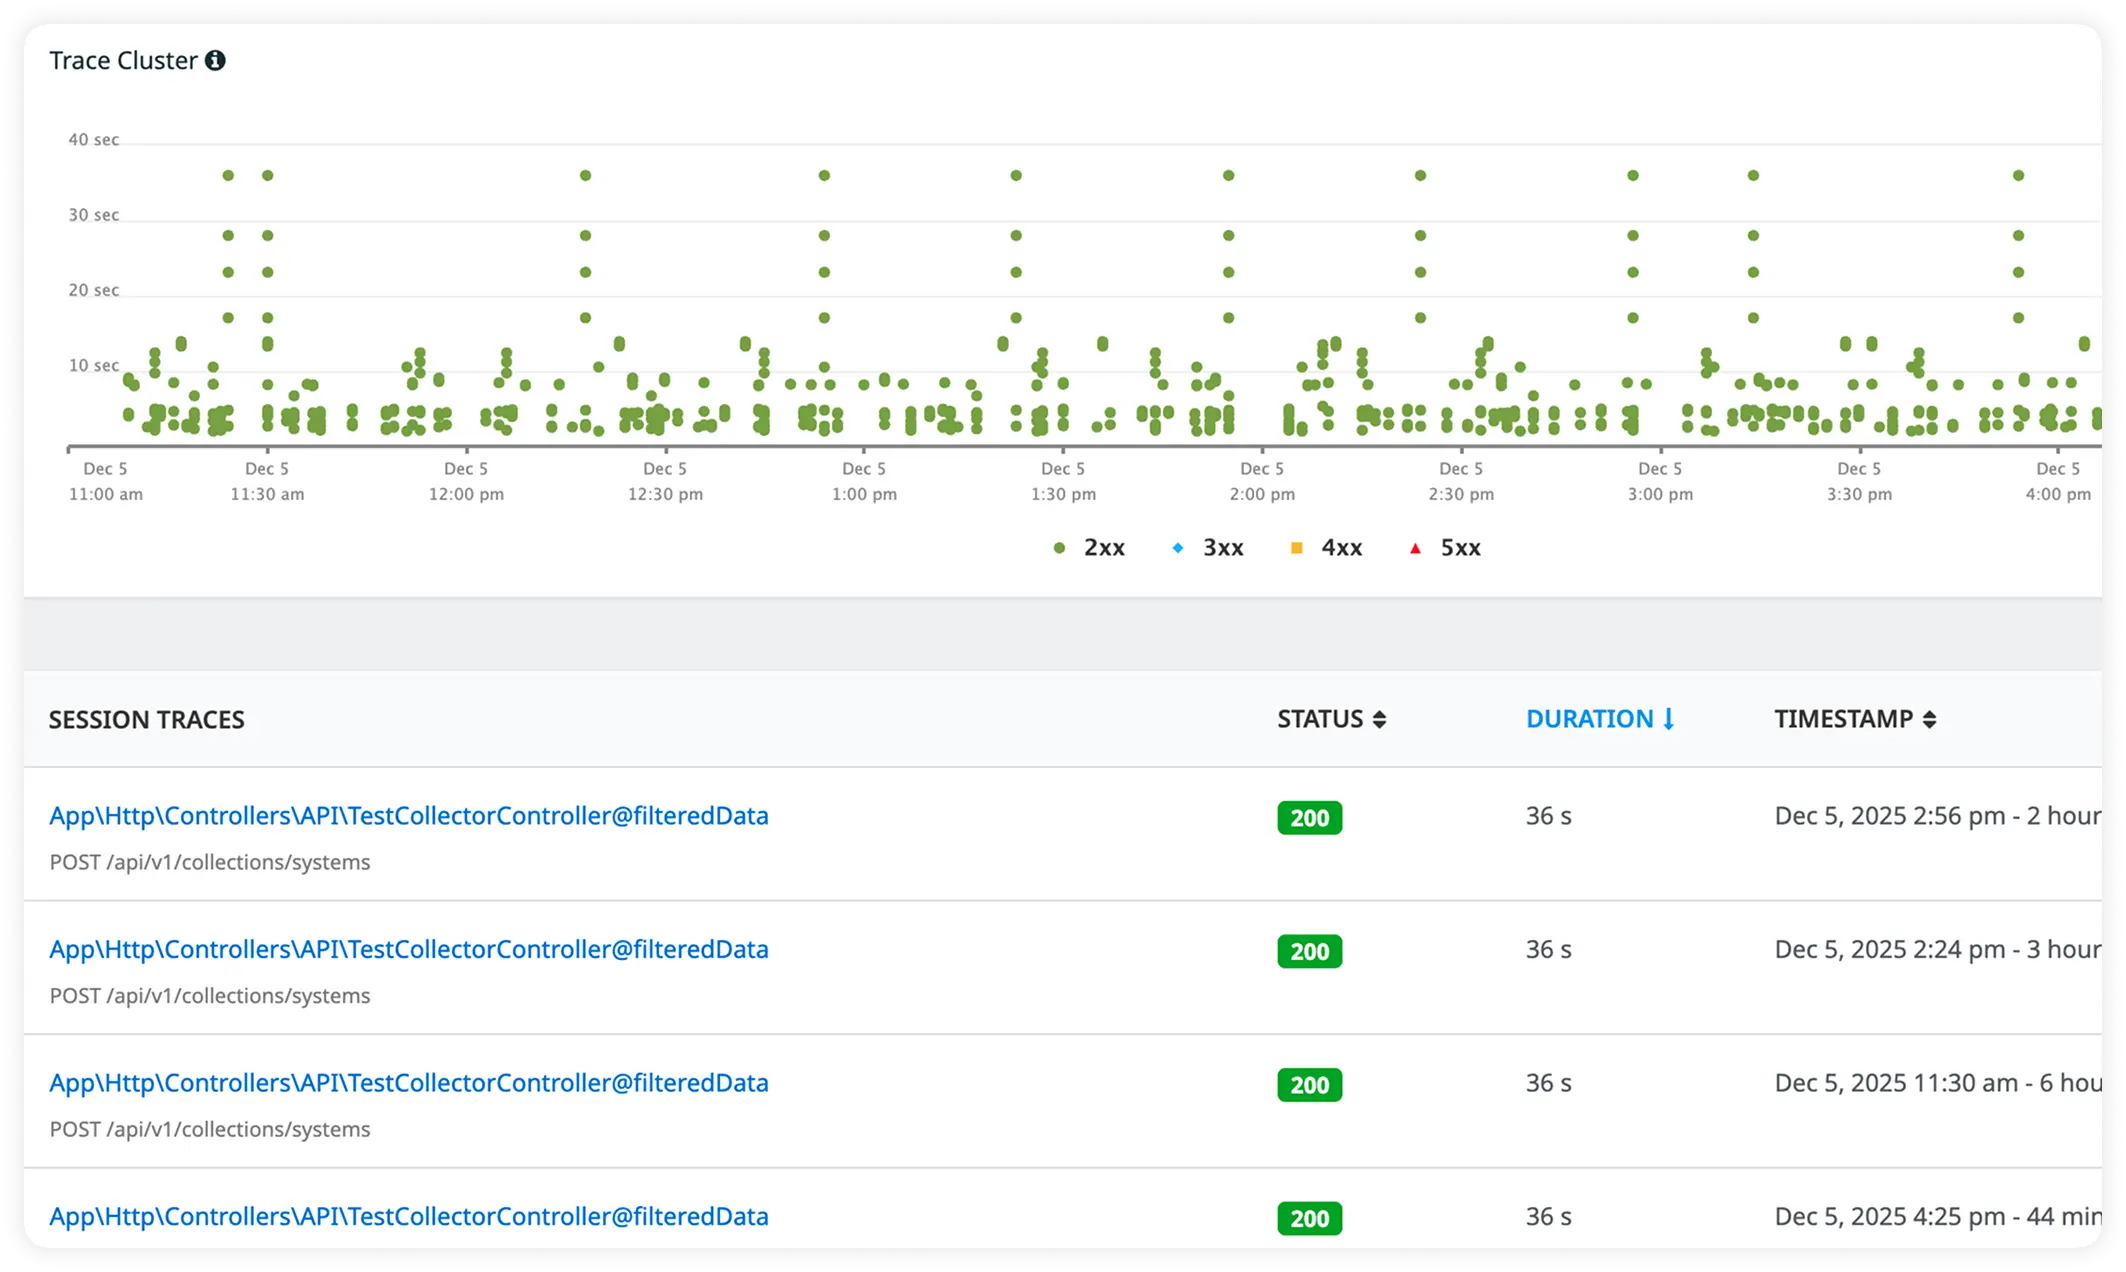
Rich Error Context with Trace-Linked Logs
Capture detailed error information alongside correlated request logs. Debug faster with full visibility across performance metrics and runtime issues.
Why Teams Choose Execution-Aware Observability for codeigniter?
CodeIgniter teams adopt Atatus when application simplicity starts hiding production complexity and runtime behavior needs to be understood directly.
Request-Level Evidence
Investigations are based on individual production requests, not averages or summarized indicators.
Observed Behavior Only
Debugging relies on what the application actually did in production, not what engineers expect it to do.
Runtime Evidence Access
Teams review concrete execution evidence captured during live requests, removing the need to guess what happened at runtime.
Production Execution Reality
Analysis stays grounded in real traffic patterns, real data, and real execution conditions that cannot be reproduced reliably outside production.
Error State Capture
Errors are examined with the execution state present at the moment of failure, helping engineers understand what the request was doing when it broke.
Repeatable Issue Review
The same failing request behavior can be reviewed consistently across occurrences, without attempting fragile local reproductions.
Low Adoption Effort
Teams gain production visibility without changing how CodeIgniter applications are structured or deployed.
Request Comparison
Engineers compare failing and non-failing production requests using runtime evidence to understand what changed during execution.
Failure Pattern Recognition
Repeated errors are identified by observing similar execution behavior across multiple production requests.
Unified Observability for Every Engineering Team
Atatus adapts to how engineering teams work across development, operations, and reliability.
Developers
Trace requests, debug errors, and identify performance issues at the code level with clear context.
DevOps
Track deployments, monitor infrastructure impact, and understand how releases affect application stability.
Release Engineer
Measure service health, latency, and error rates to maintain reliability and reduce production risk.