.NET Performance Monitoring
Get end-to-end visibility into your .NET performance with application monitoring tools. Gain insightful metrics on performance bottlenecks with .NET monitoring to optimize your application.
When .NET Production Becomes Opaque?
Thread Contention Blindness
Thread pool pressure builds gradually. Engineers notice slowdowns without clear visibility into execution blocking.
Async Flow Breakage
Async and await chains lose continuity. Root-cause analysis stalls when execution context fragments across calls.
Exception Context Gaps
Unhandled exceptions surface without full runtime state. Engineers see failures but lack execution ownership.
Dependency Injection Shadows
External calls degrade unpredictably. Failures appear internal while root causes sit outside service boundaries.
Database Bottleneck Ambiguity
Latency spikes lack attribution. Mapping slow responses to specific database interactions becomes manual.
Configuration Drift Risks
Runtime behavior diverges across environments. Teams lose confidence in pre-production validation.
Garbage Collection Pressure
Memory pressure accumulates silently. Performance degrades before engineers recognize GC impact.
EF Query N+1 Plagues
Change tracking triggers hidden roundtrips per entity load. Devs profile DB hits without ORM execution plans.
Complete Performance Visibility for
.NET Applications
Real-time observability for .NET workloads that helps teams track request performance, optimize execution flow, and resolve production issues faster.
End-to-End Request Timing
Track the full lifecycle of every request from entry to response. Quickly identify latency introduced across controllers, middleware, and dependencies.
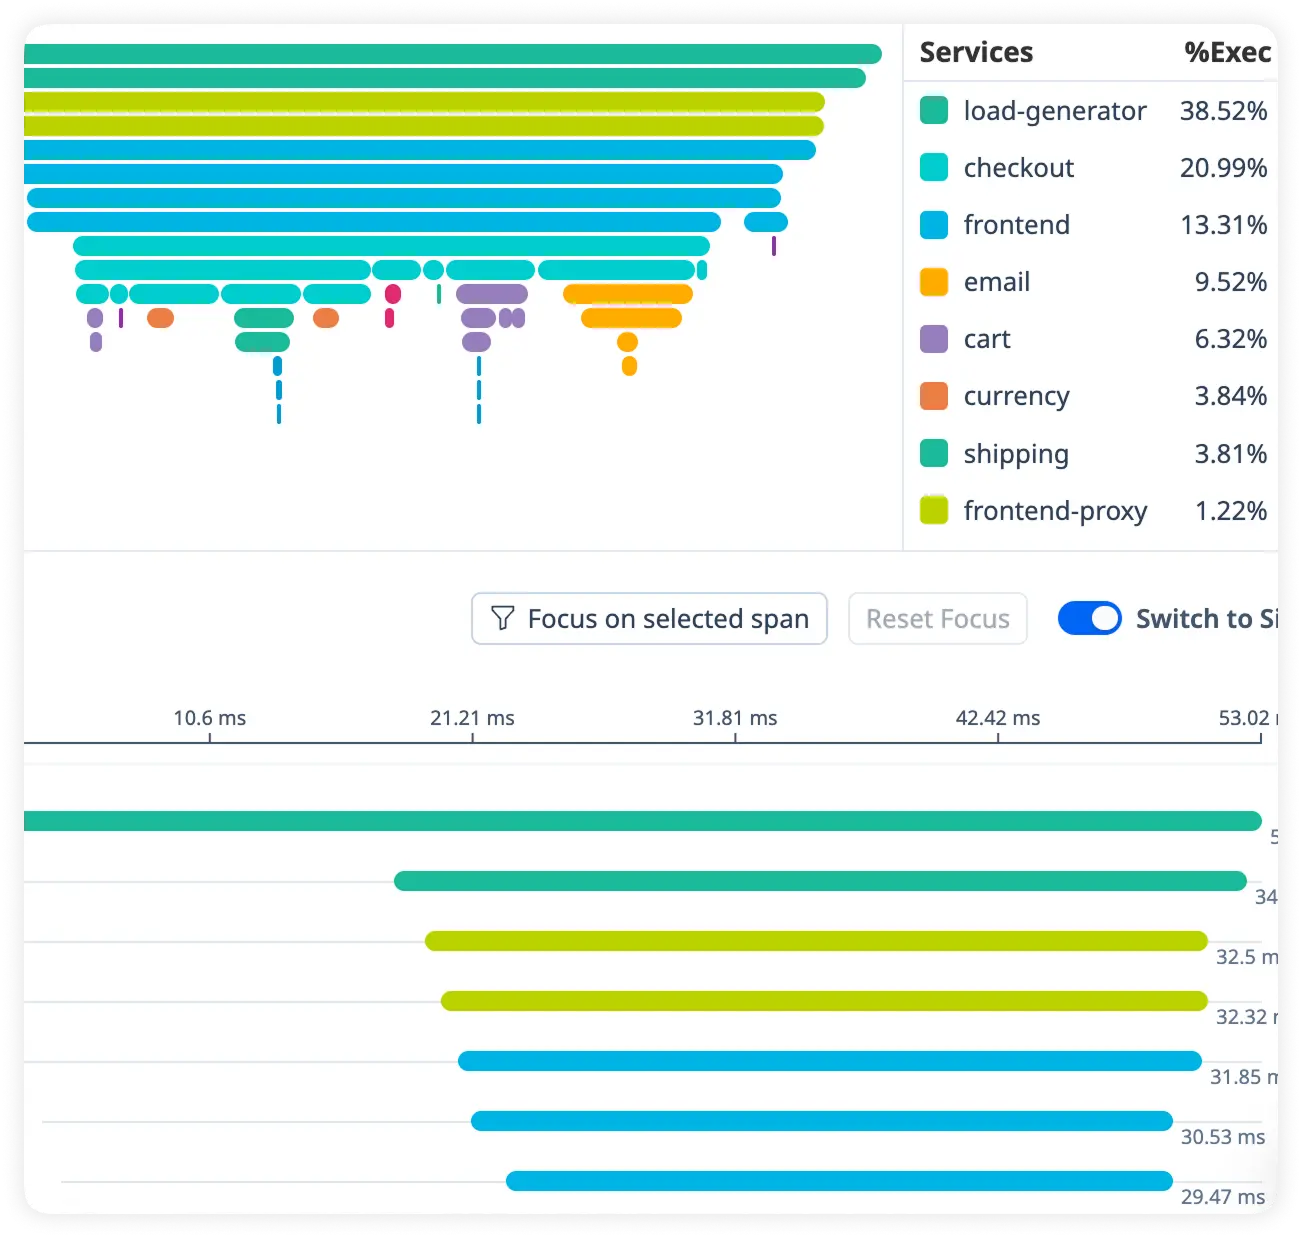
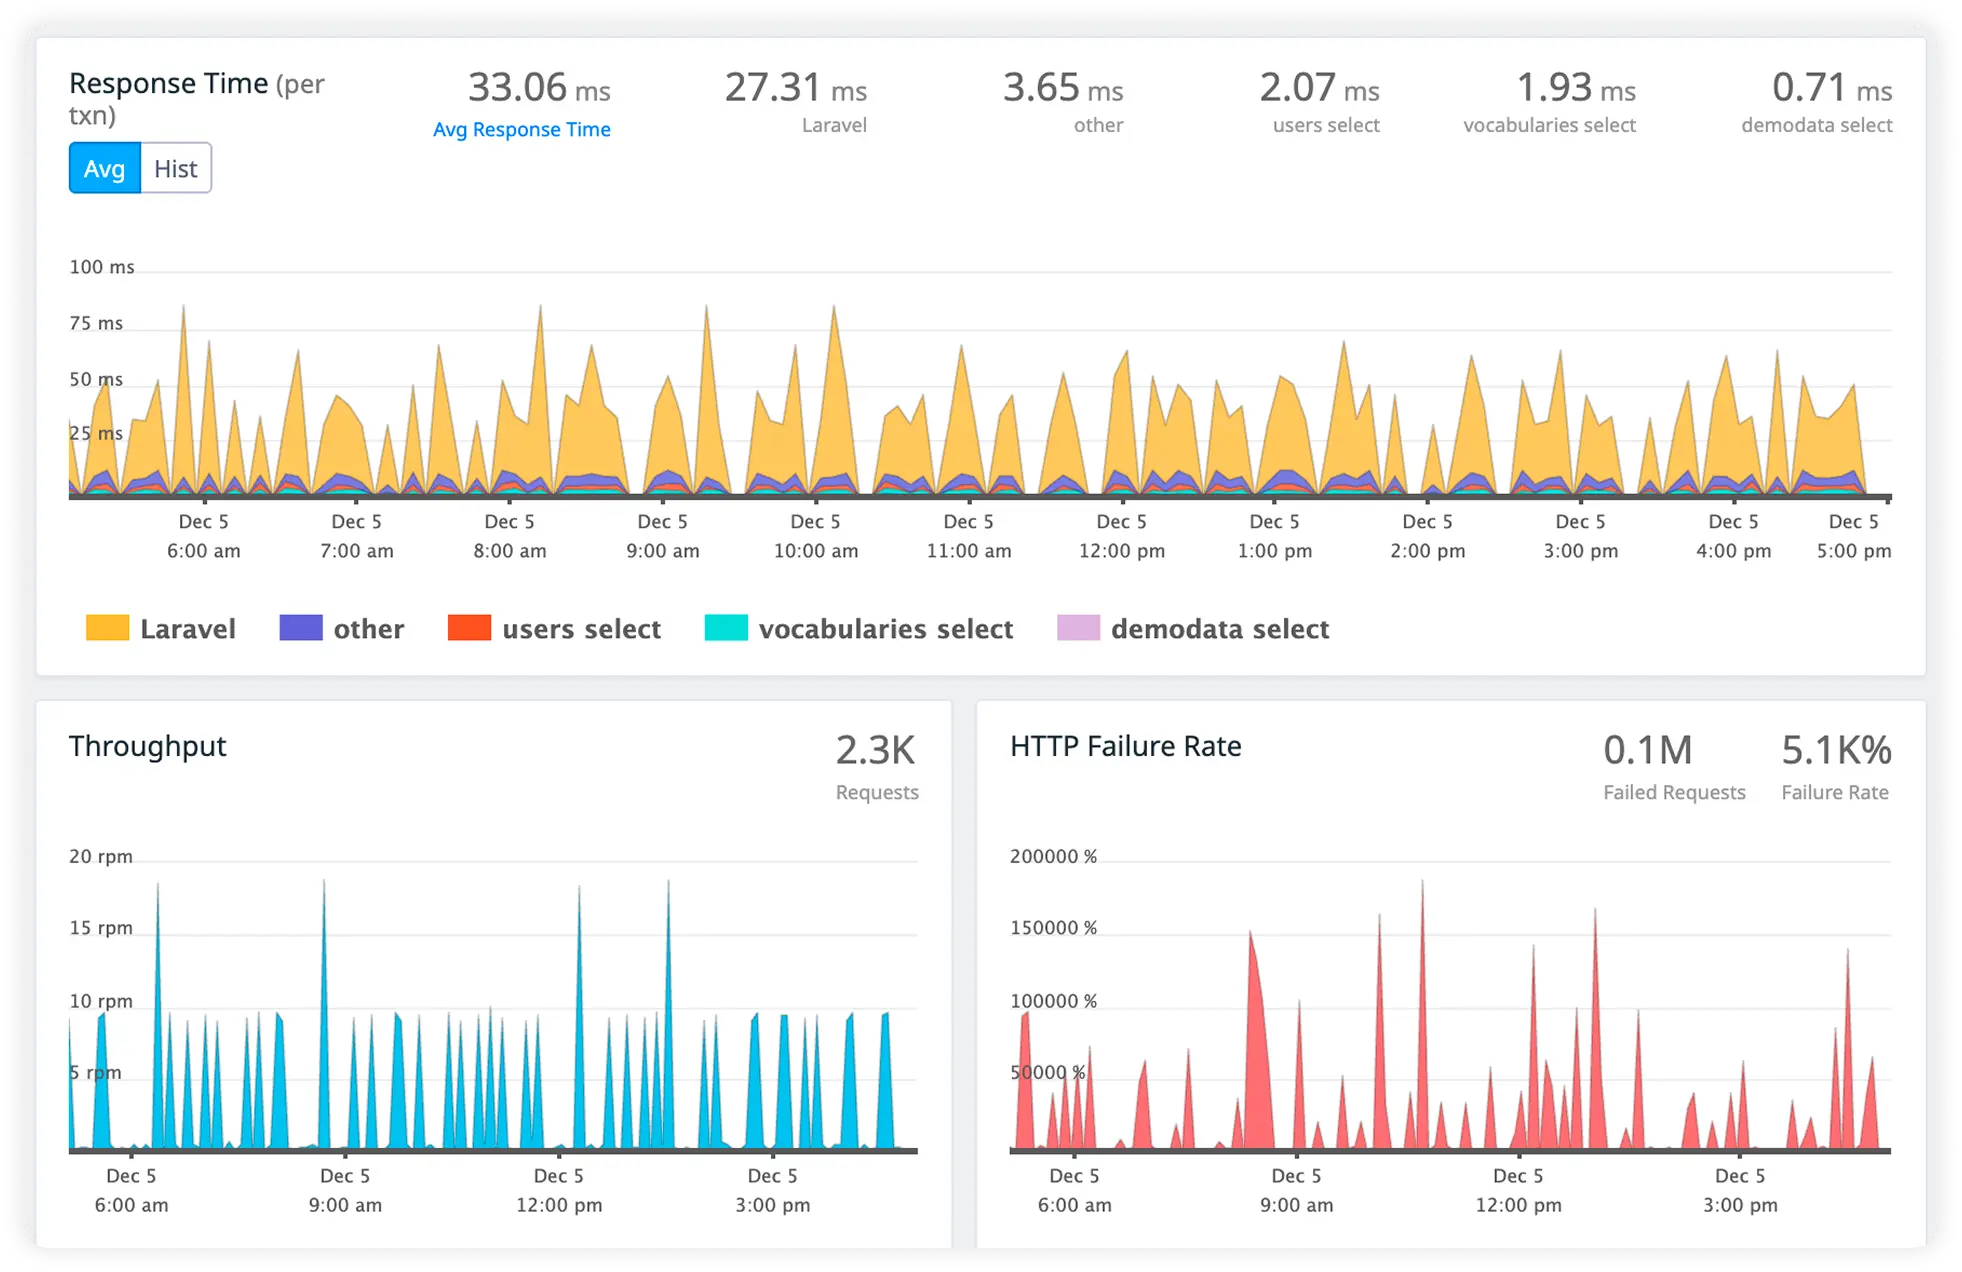
Route Handler Cost
Measure how much time each route handler and controller action consumes during request processing. Pinpoint slow execution paths affecting performance.
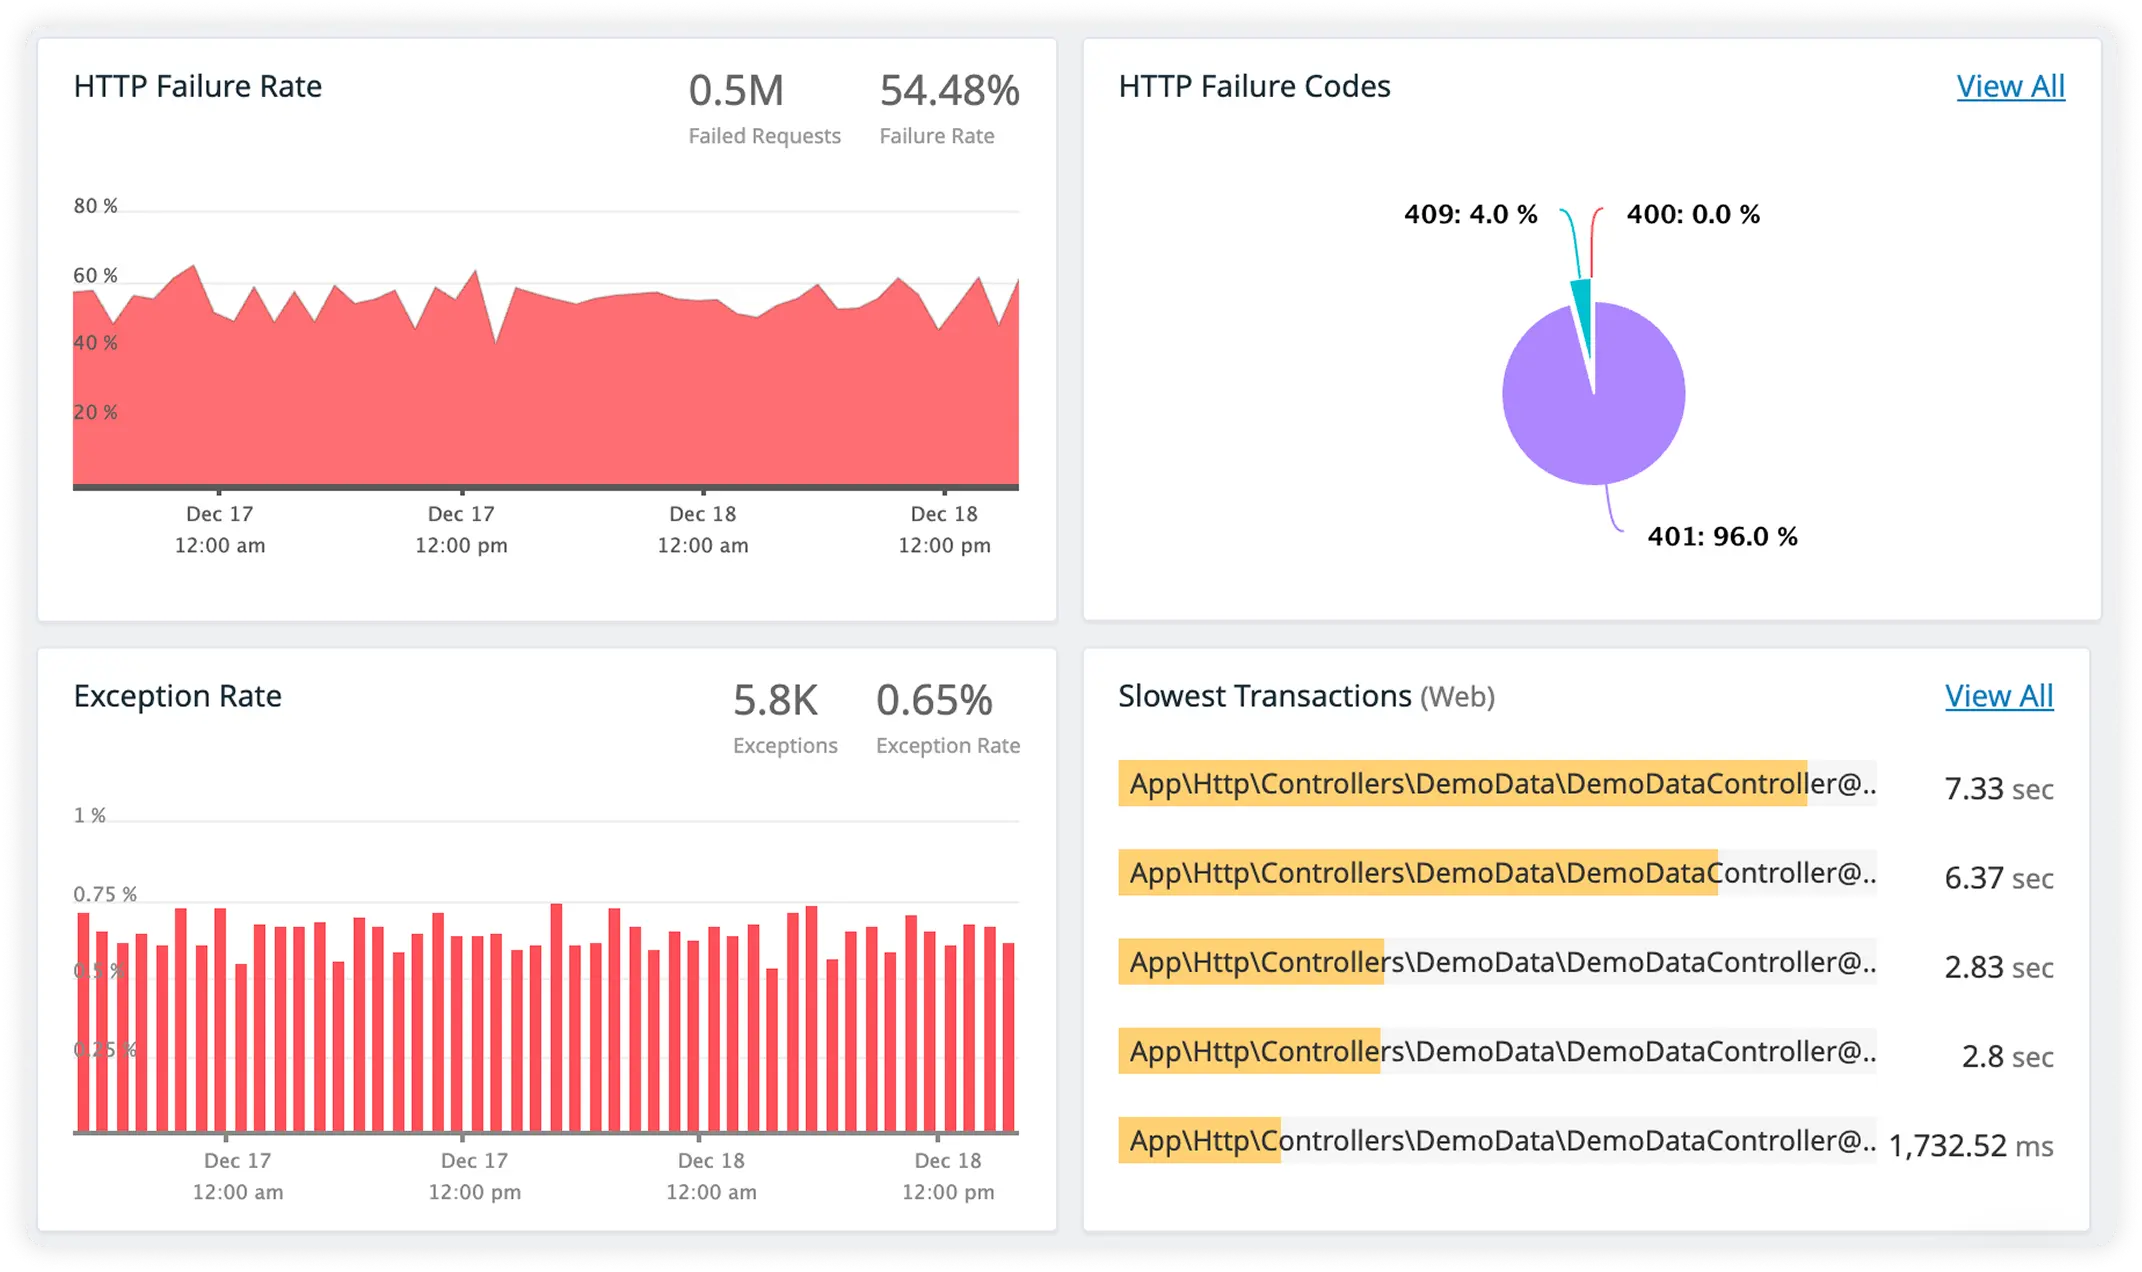
SQL Execution Weight
Analyze database query execution time and resource usage in real time. Eliminate inefficient SQL operations slowing application responses.
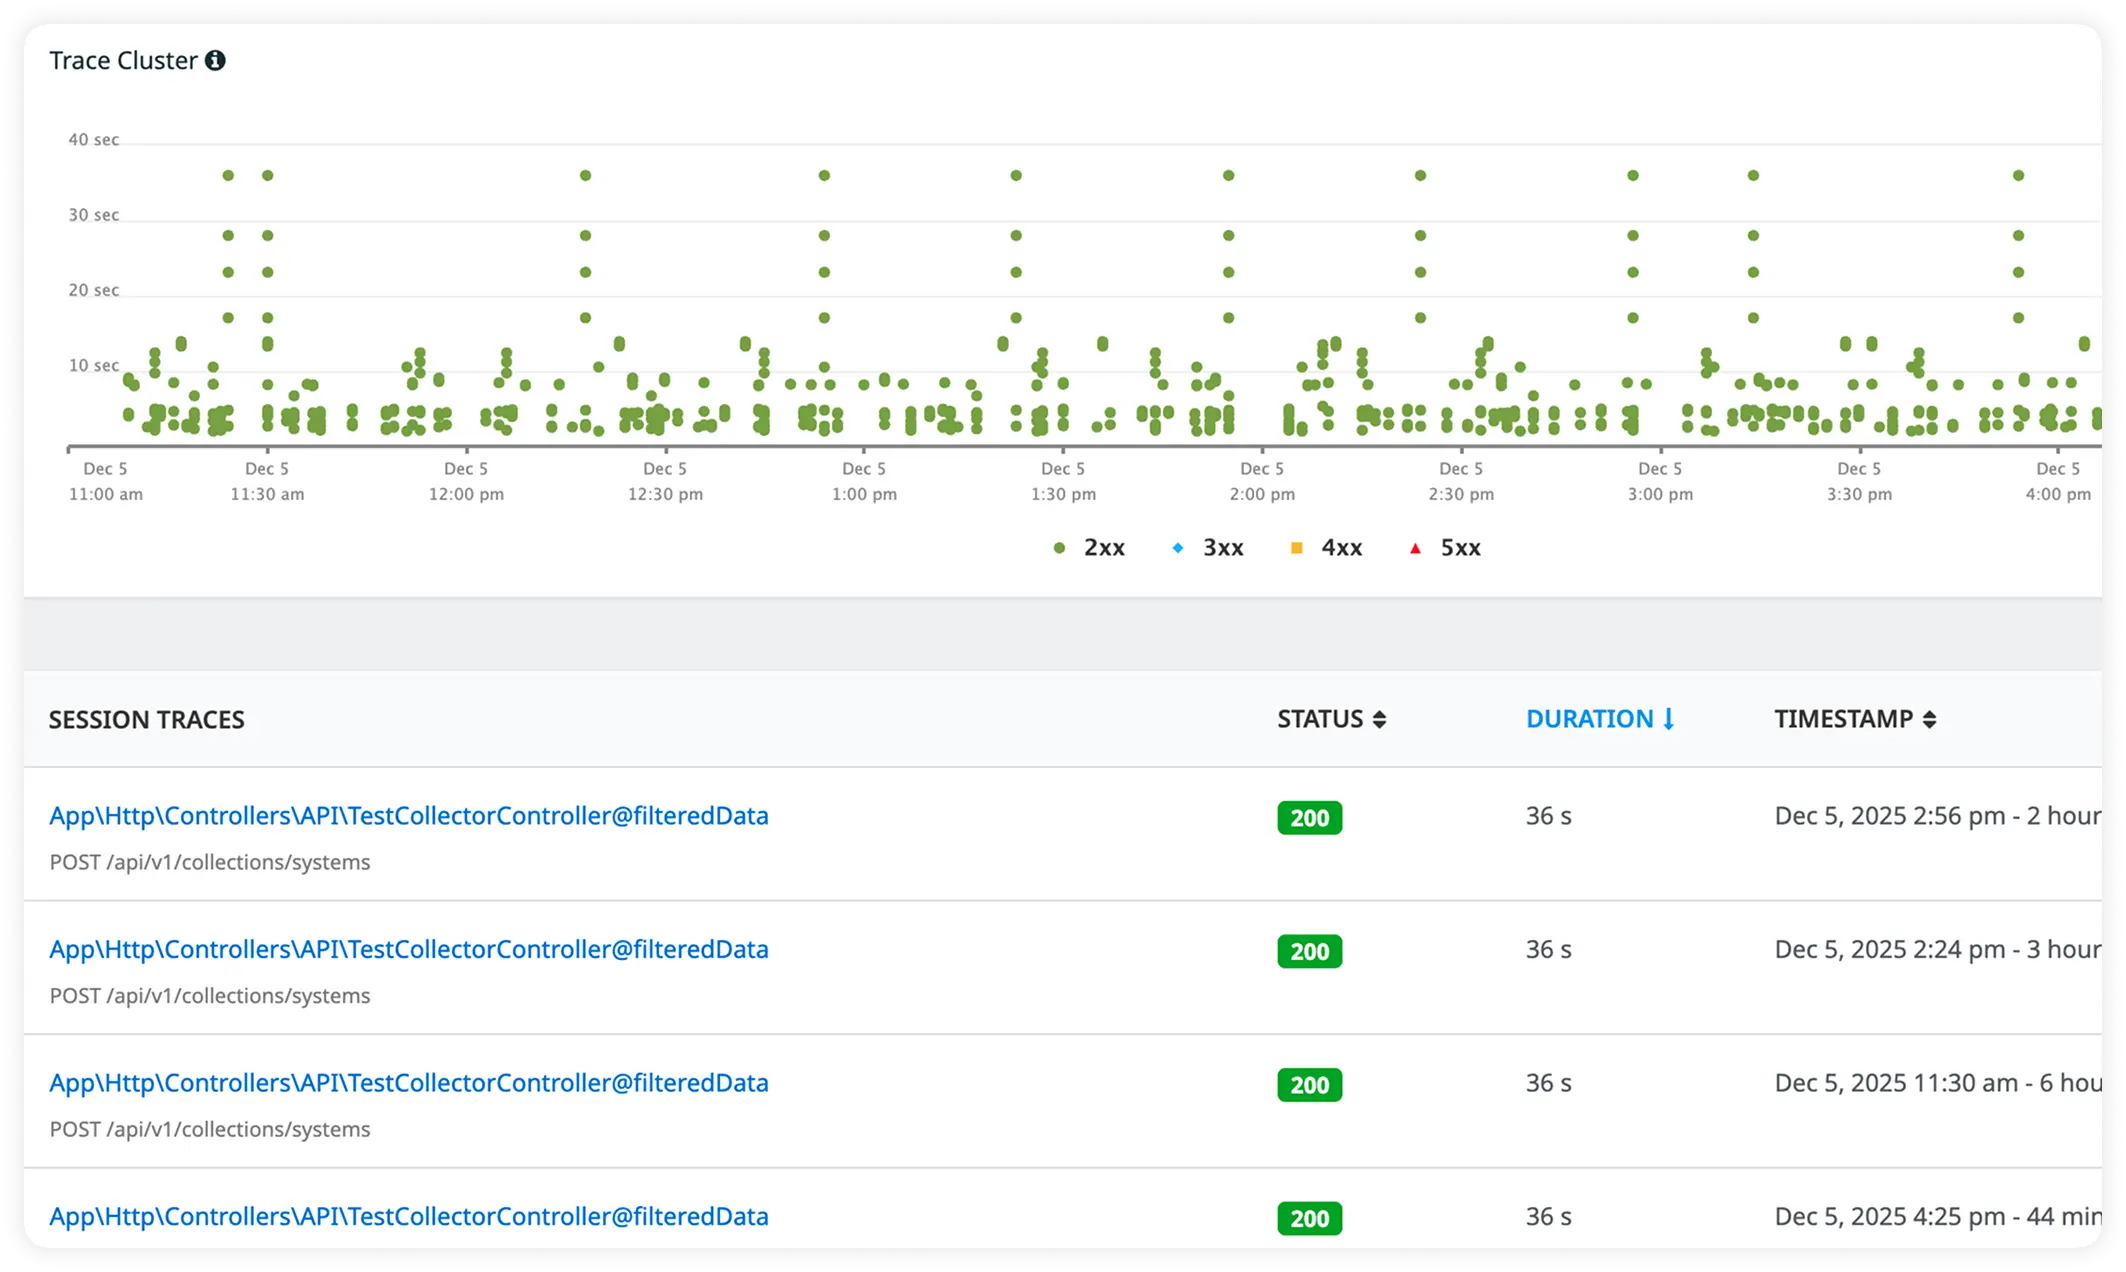
Cache Read Efficiency with Outbound Call Latency
Monitor cache hit performance alongside response times for external services. Understand how caching behavior and outbound calls impact request speed.
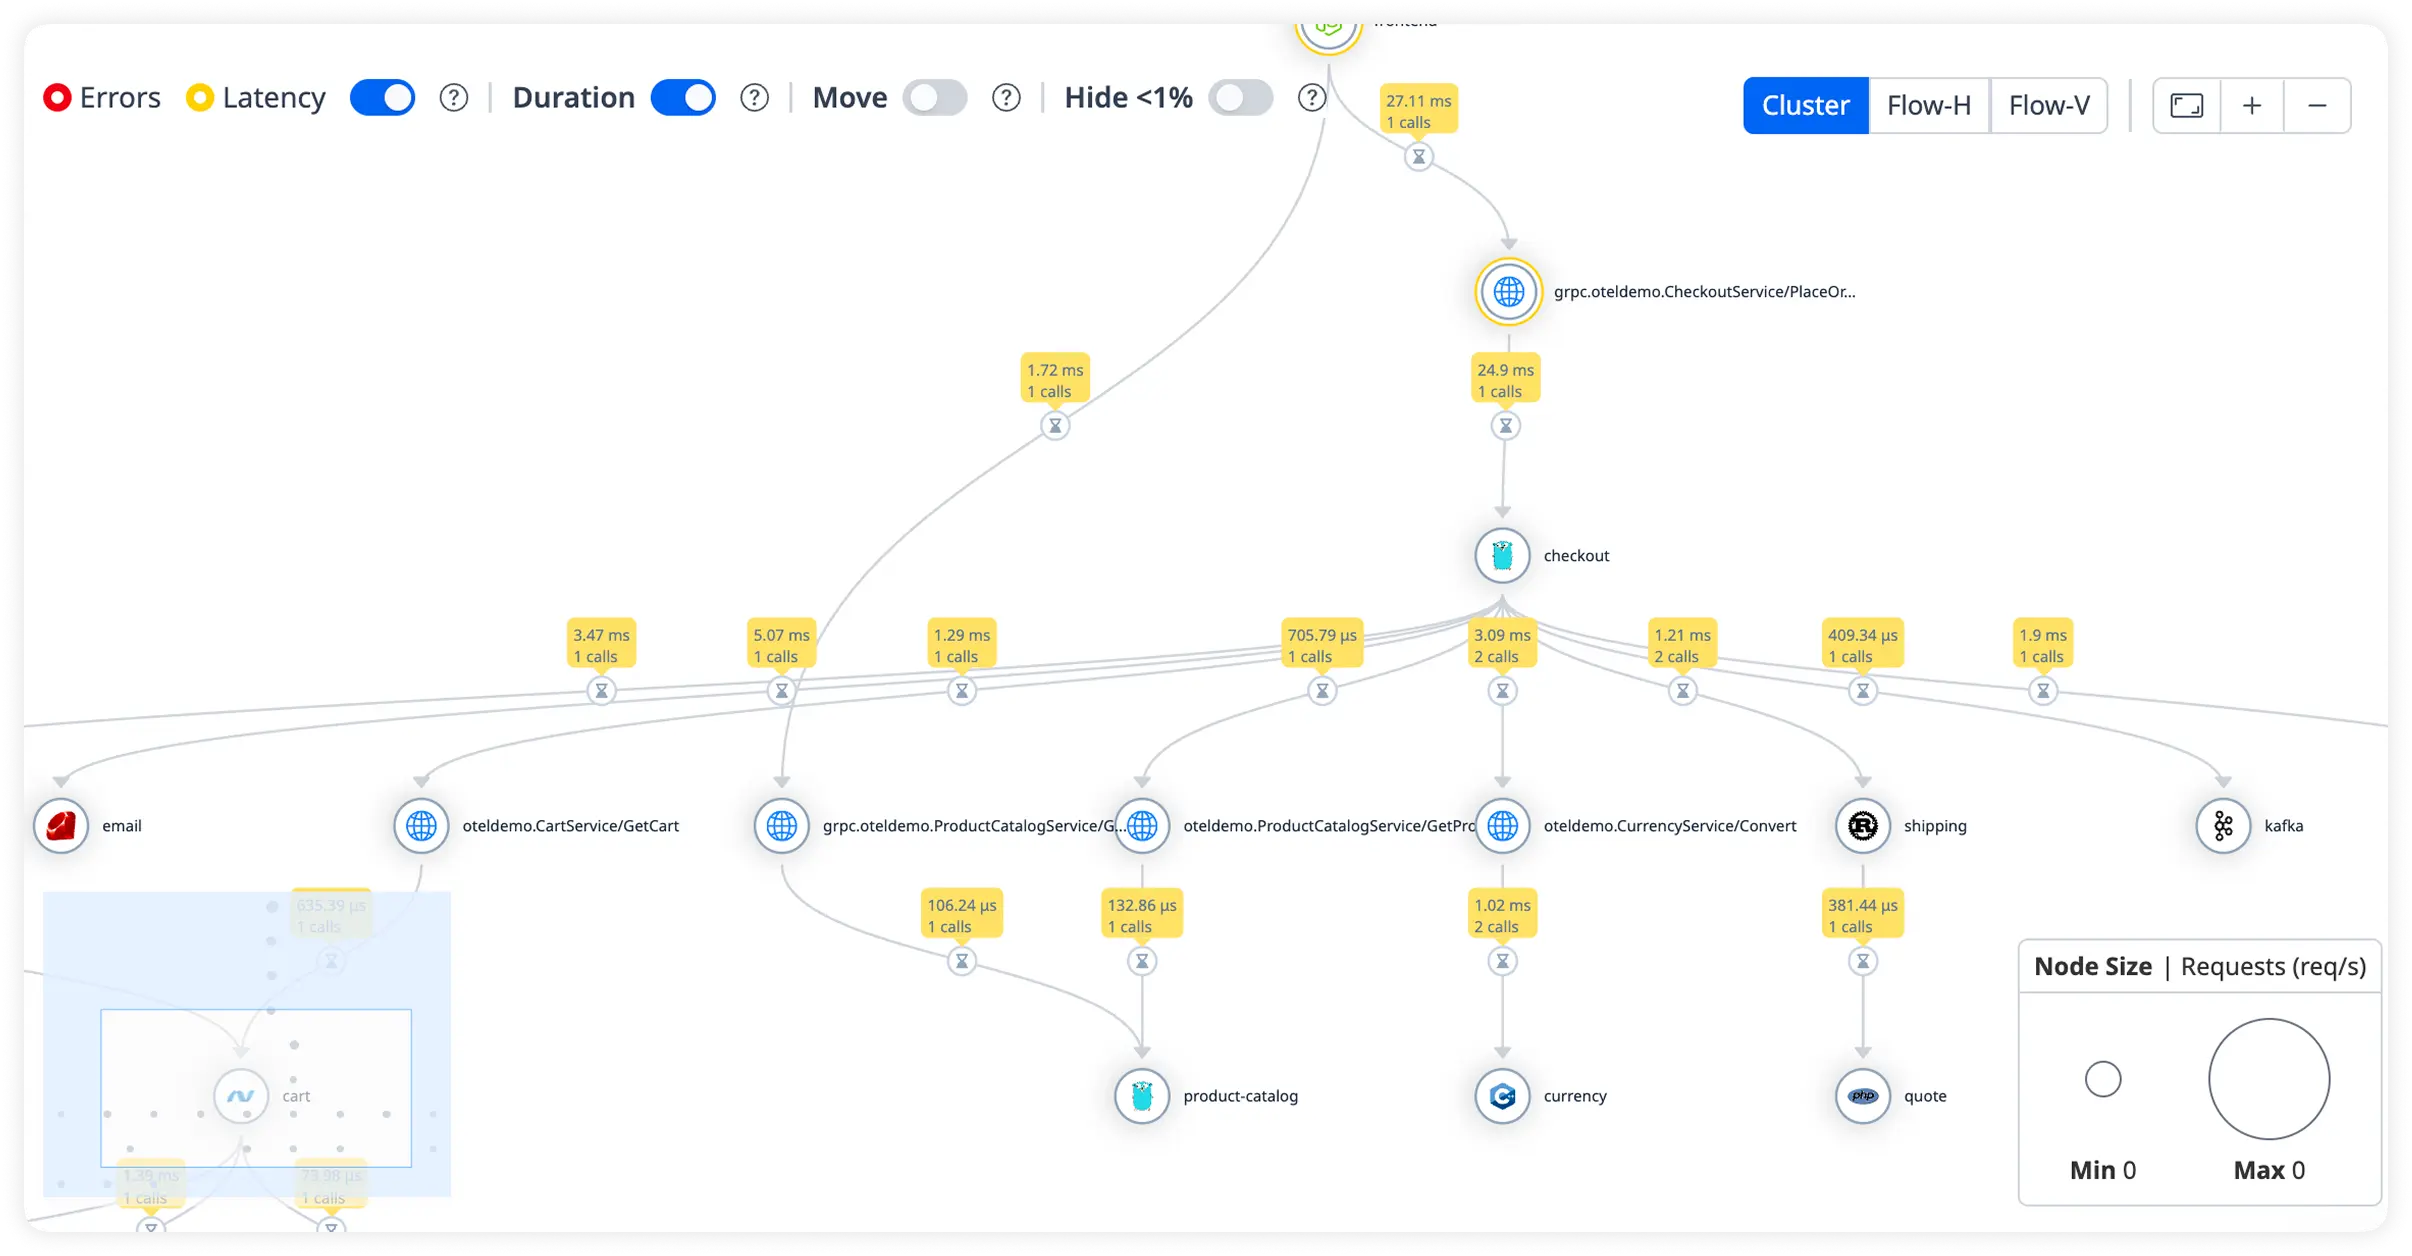
Why Teams Choose Atatus?
.NET platform architects choose Atatus for uncompromised runtime diagnostics that bypass APM complexity. SREs deploy with proven thread and heap fidelity.
Allocation Site Precision
Heap snapshots tag retainers to source lines instantly. Backend teams prune leaks pre-production escape.
Await Chain Continuity
Async flows preserve state machine contexts across pools. Devs trace deadlocks through Task continuations cleanly.
Worker Queue Telemetry
ThreadPool metrics expose starvation thresholds live. SREs tune min/max threads against workload bursts.
ORM Hydration Breakdowns
EF timings split tracking from SQL execution natively. Platform owners optimize entity graphs systematically.
Hub Connection Lifecycles
SignalR streams map subscriber loads to backplane latency. Backend scales hubs with protocol-specific insights.
Lower Debug Variability
Engineers move through consistent analysis paths that reduce dependency on individual experience, ensuring incidents are diagnosed the same way across teams, shifts, and on-call rotations.
Domain Recycle Audits
AppDomain terminations capture open handles pre-evict. Platform ops harden pools with leak forensics.
Span Correlation Depth
Joins business transactions to infra primitives end-to-end. .NET crews slash MTTR across distributed tiers.
Proto Overhead Breakdowns
gRPC serialization splits CPU costs from network transit. Devs optimize protobuf schemas against live payload profiles.
Unified Observability for Every Engineering Team
Atatus adapts to how engineering teams work across development, operations, and reliability.
Developers
Trace requests, debug errors, and identify performance issues at the code level with clear context.
DevOps
Track deployments, monitor infrastructure impact, and understand how releases affect application stability.
Release Engineer
Measure service health, latency, and error rates to maintain reliability and reduce production risk.