Drupal Performance Monitoring
Get end-to-end visibility into your Drupal performance with application monitoring tools. Gain insightful metrics on performance bottlenecks with PHP monitoring to optimize your application.s
Where Drupal Performance Breaks Down?
Request Execution Ambiguity
Individual requests traverse complex code paths influenced by hooks, middleware, and runtime state. Without execution-level visibility, latency sources remain indistinguishable.
Error Context Loss
Failures surface detached from their originating execution flow. Stack traces alone fail to explain why a request reached an invalid state.
Signal Correlation Gaps
Runtime data is disconnected across layers. Application behavior, PHP execution, and infrastructure pressure cannot be reasoned about together.
Diagnosis Time Inflation
Investigations expand linearly with system complexity. Engineers iterate through assumptions instead of validating facts.
Load Induced Variability
Traffic amplifies nondeterministic behavior. Edge cases dominate performance characteristics at scale.
Release Attribution Unclear
Post-deploy regressions lack clear causality. Teams cannot confidently link performance changes to code changes.
External Latency Opacity
Upstream and downstream dependencies affect execution timing unevenly. Their contribution is difficult to quantify during incidents.
Operational Decision Uncertainty
Capacity and tuning decisions are made confidence-poor. Teams compensate with overprovisioning or reactive firefighting.
Full-Stack Visibility for
Drupal Applications
Real-time observability for Drupal that helps teams understand performance behavior, resolve issues faster, and maintain reliable production systems.
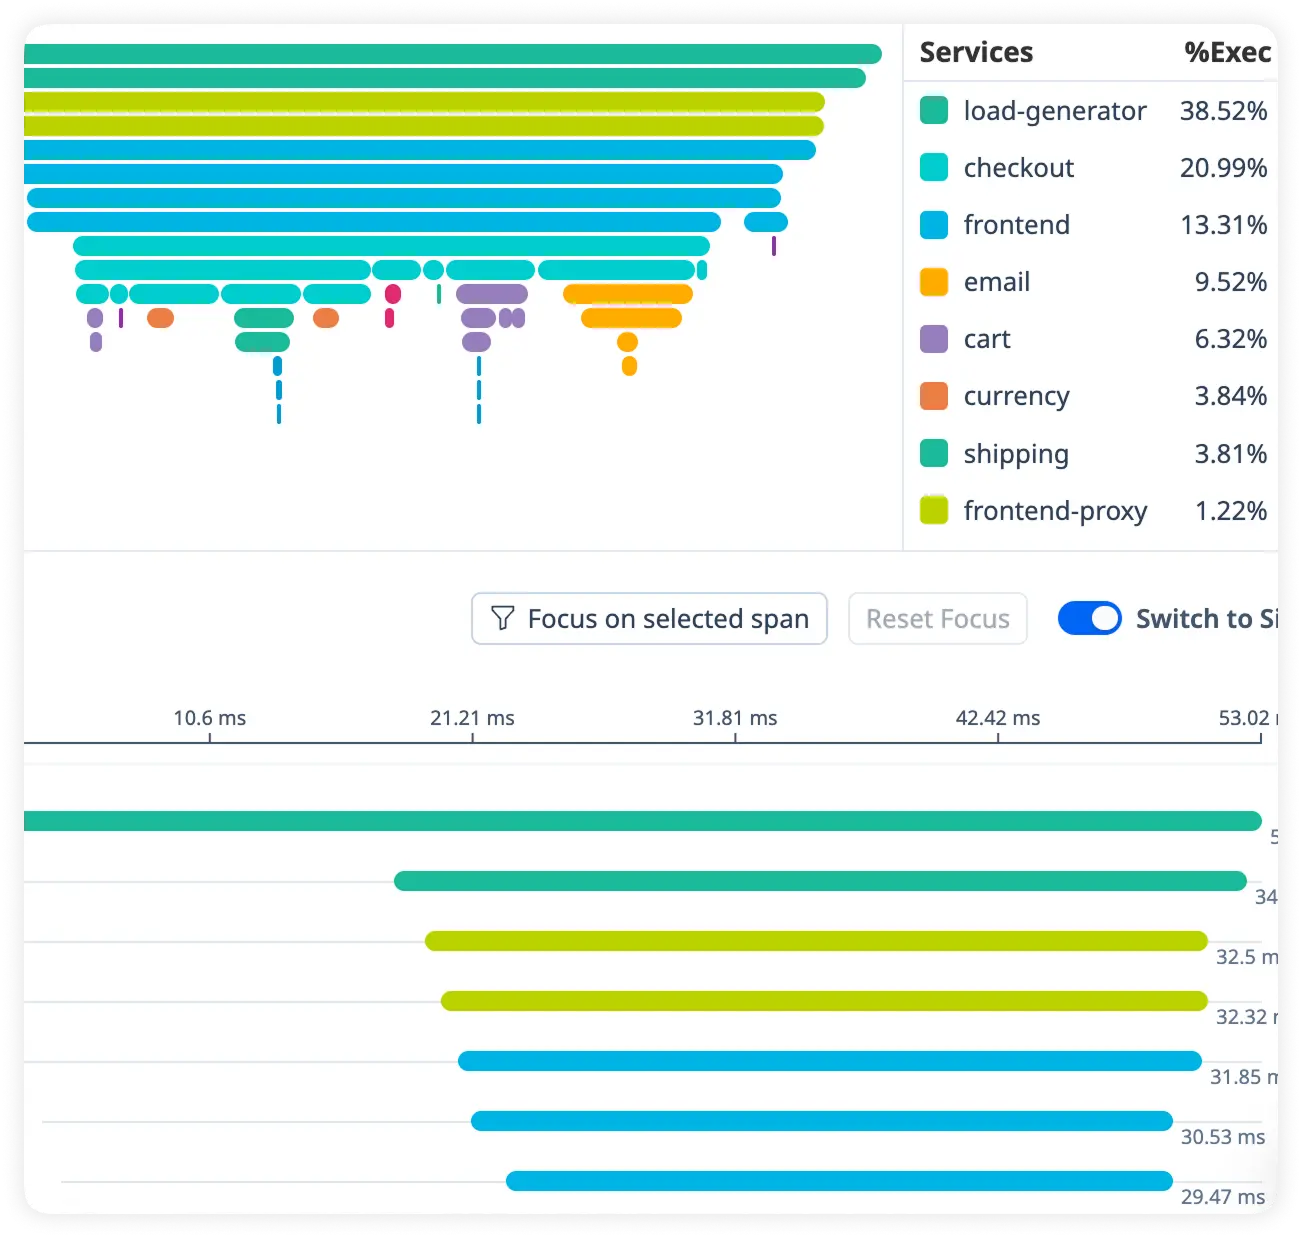
End-to-End Distributed Tracing
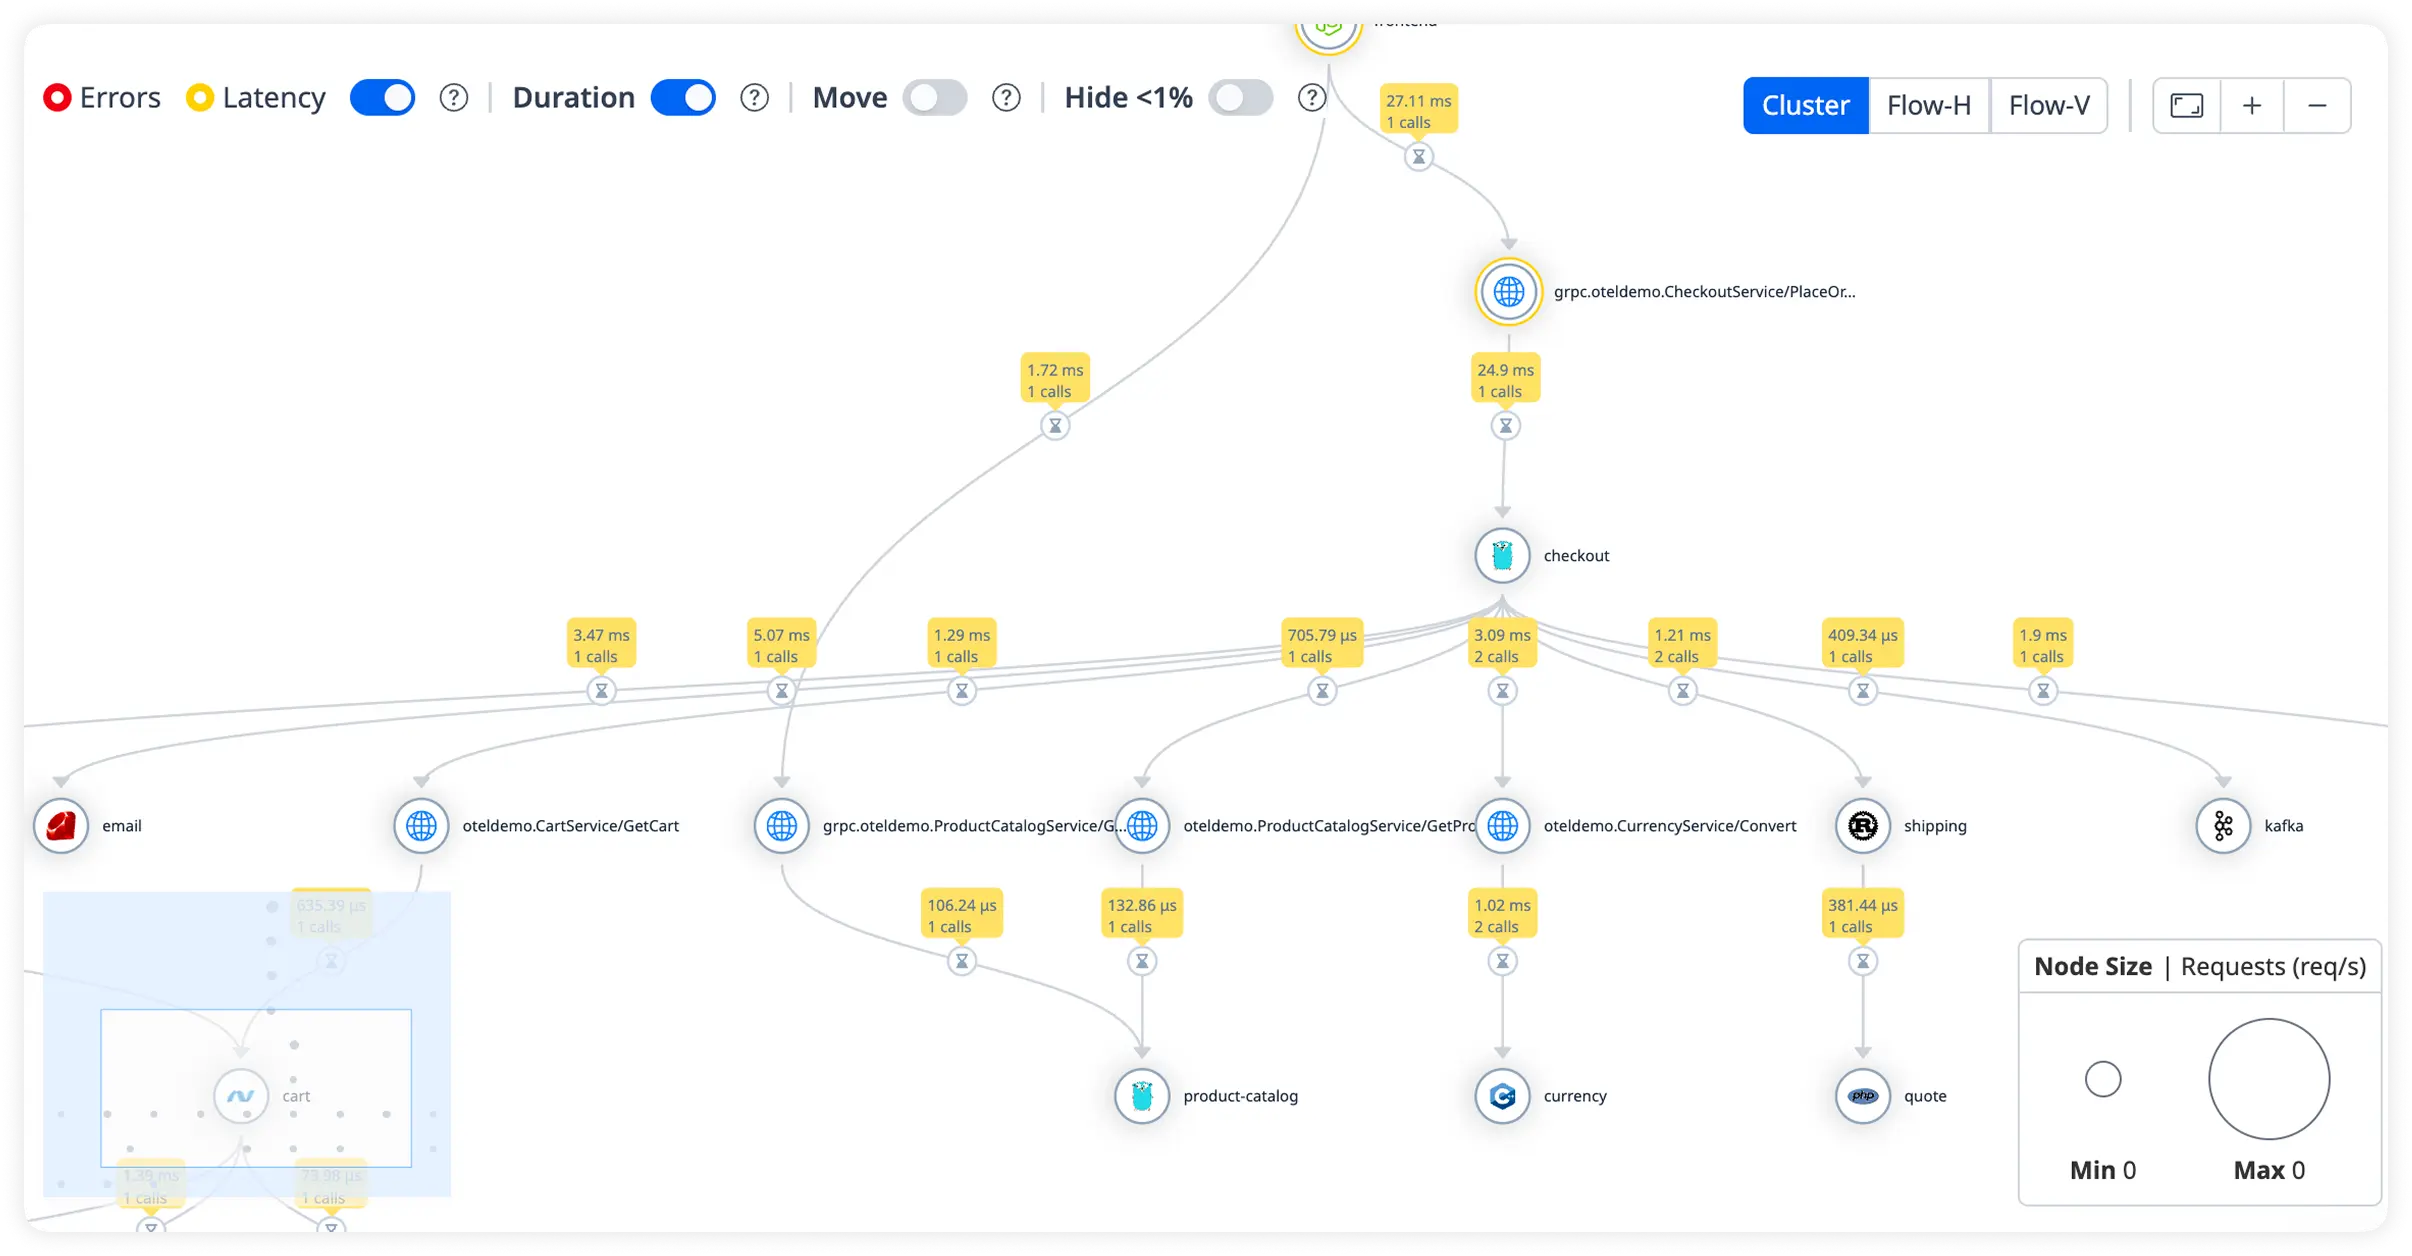
Follow every request across services, Drupal modules, databases, and background processes in a single unified trace. Understand execution flow and pinpoint latency across your entire Drupal stack.
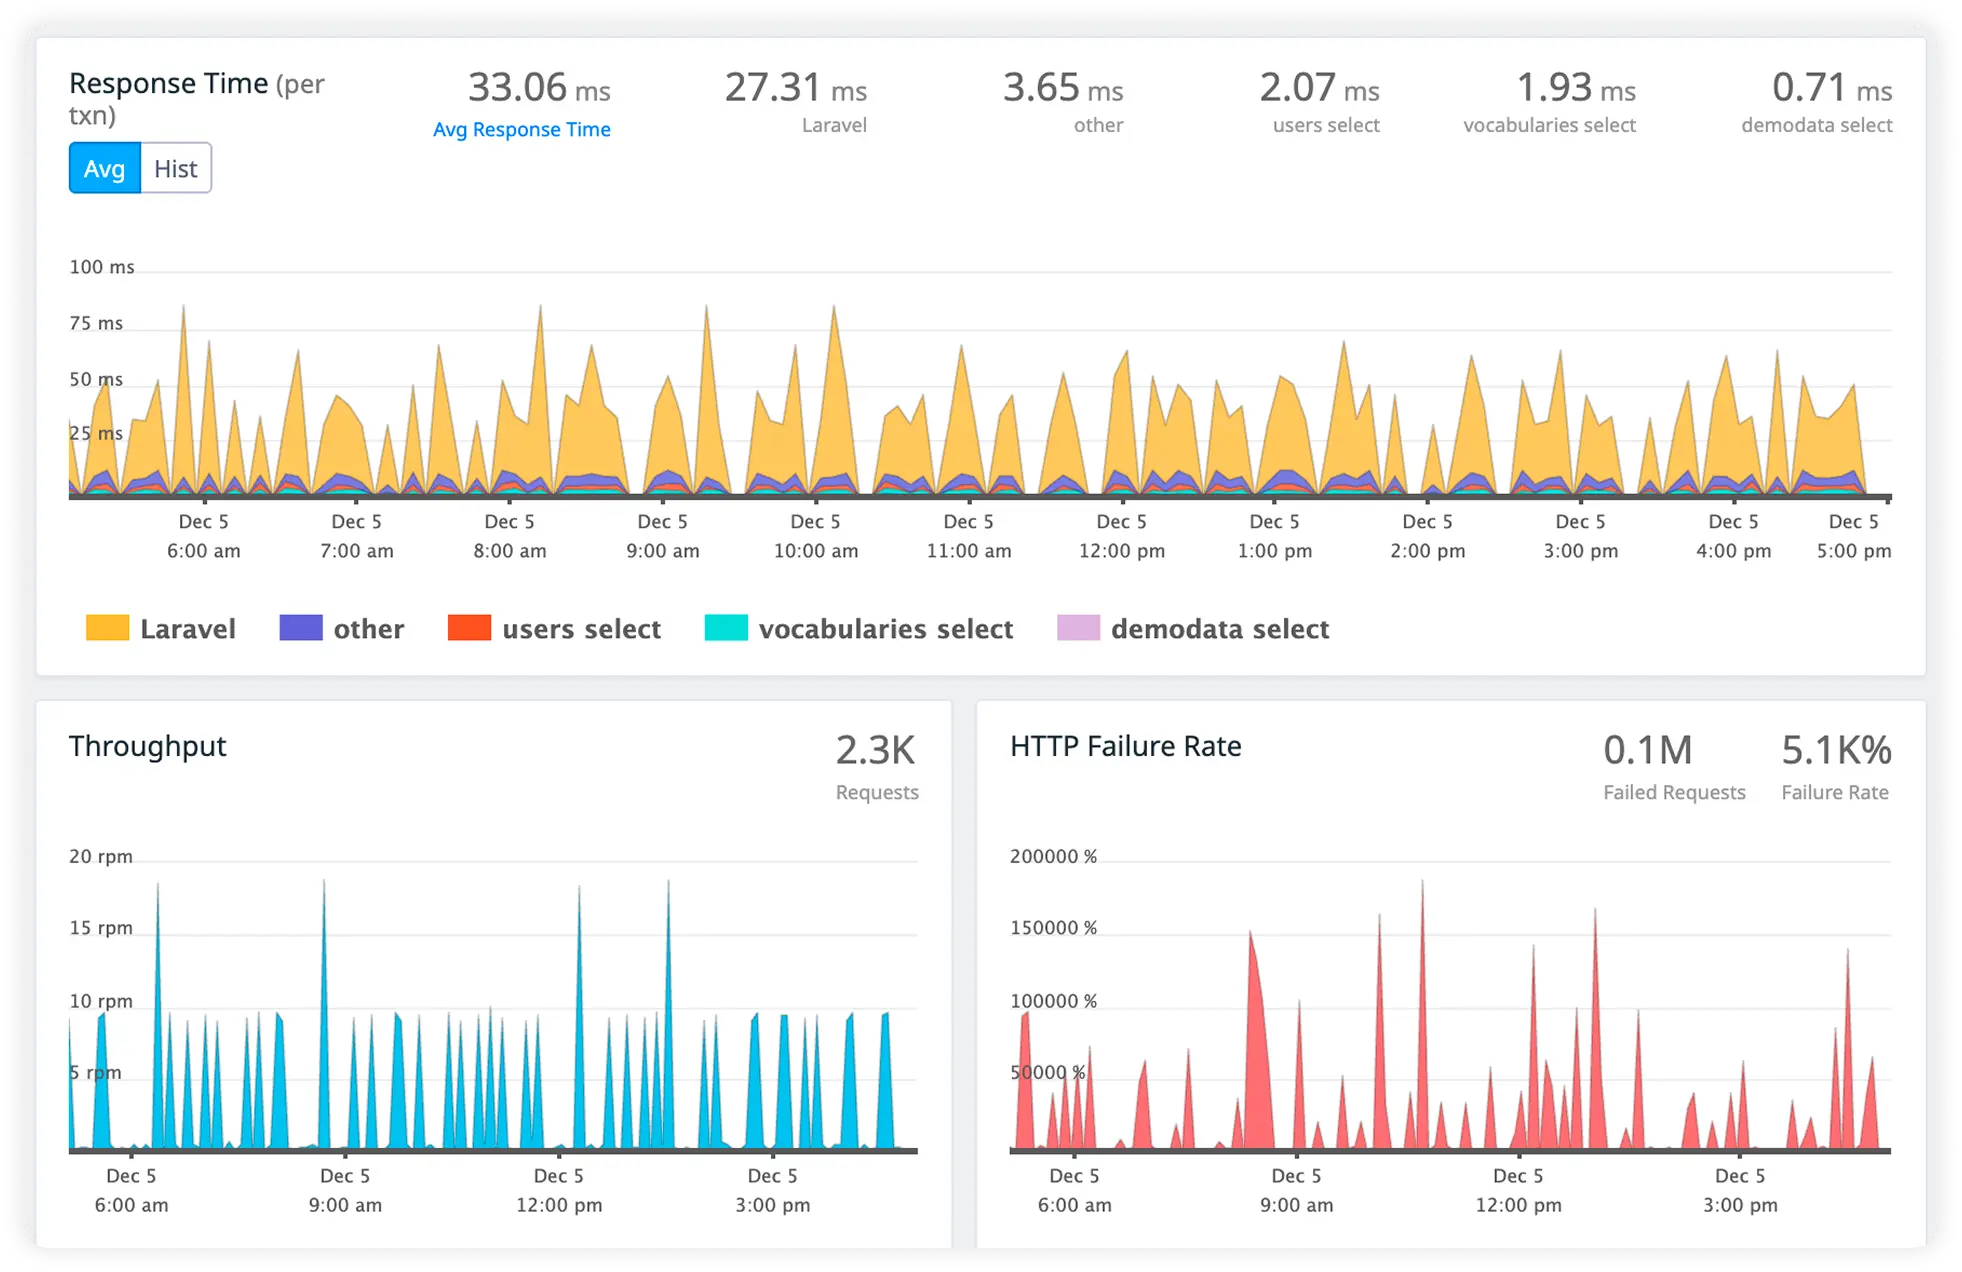
Actionable Query Performance Insights
Monitor database queries to surface slow executions, heavy loads, and inefficient access patterns. Optimize content delivery and backend performance with confidence.
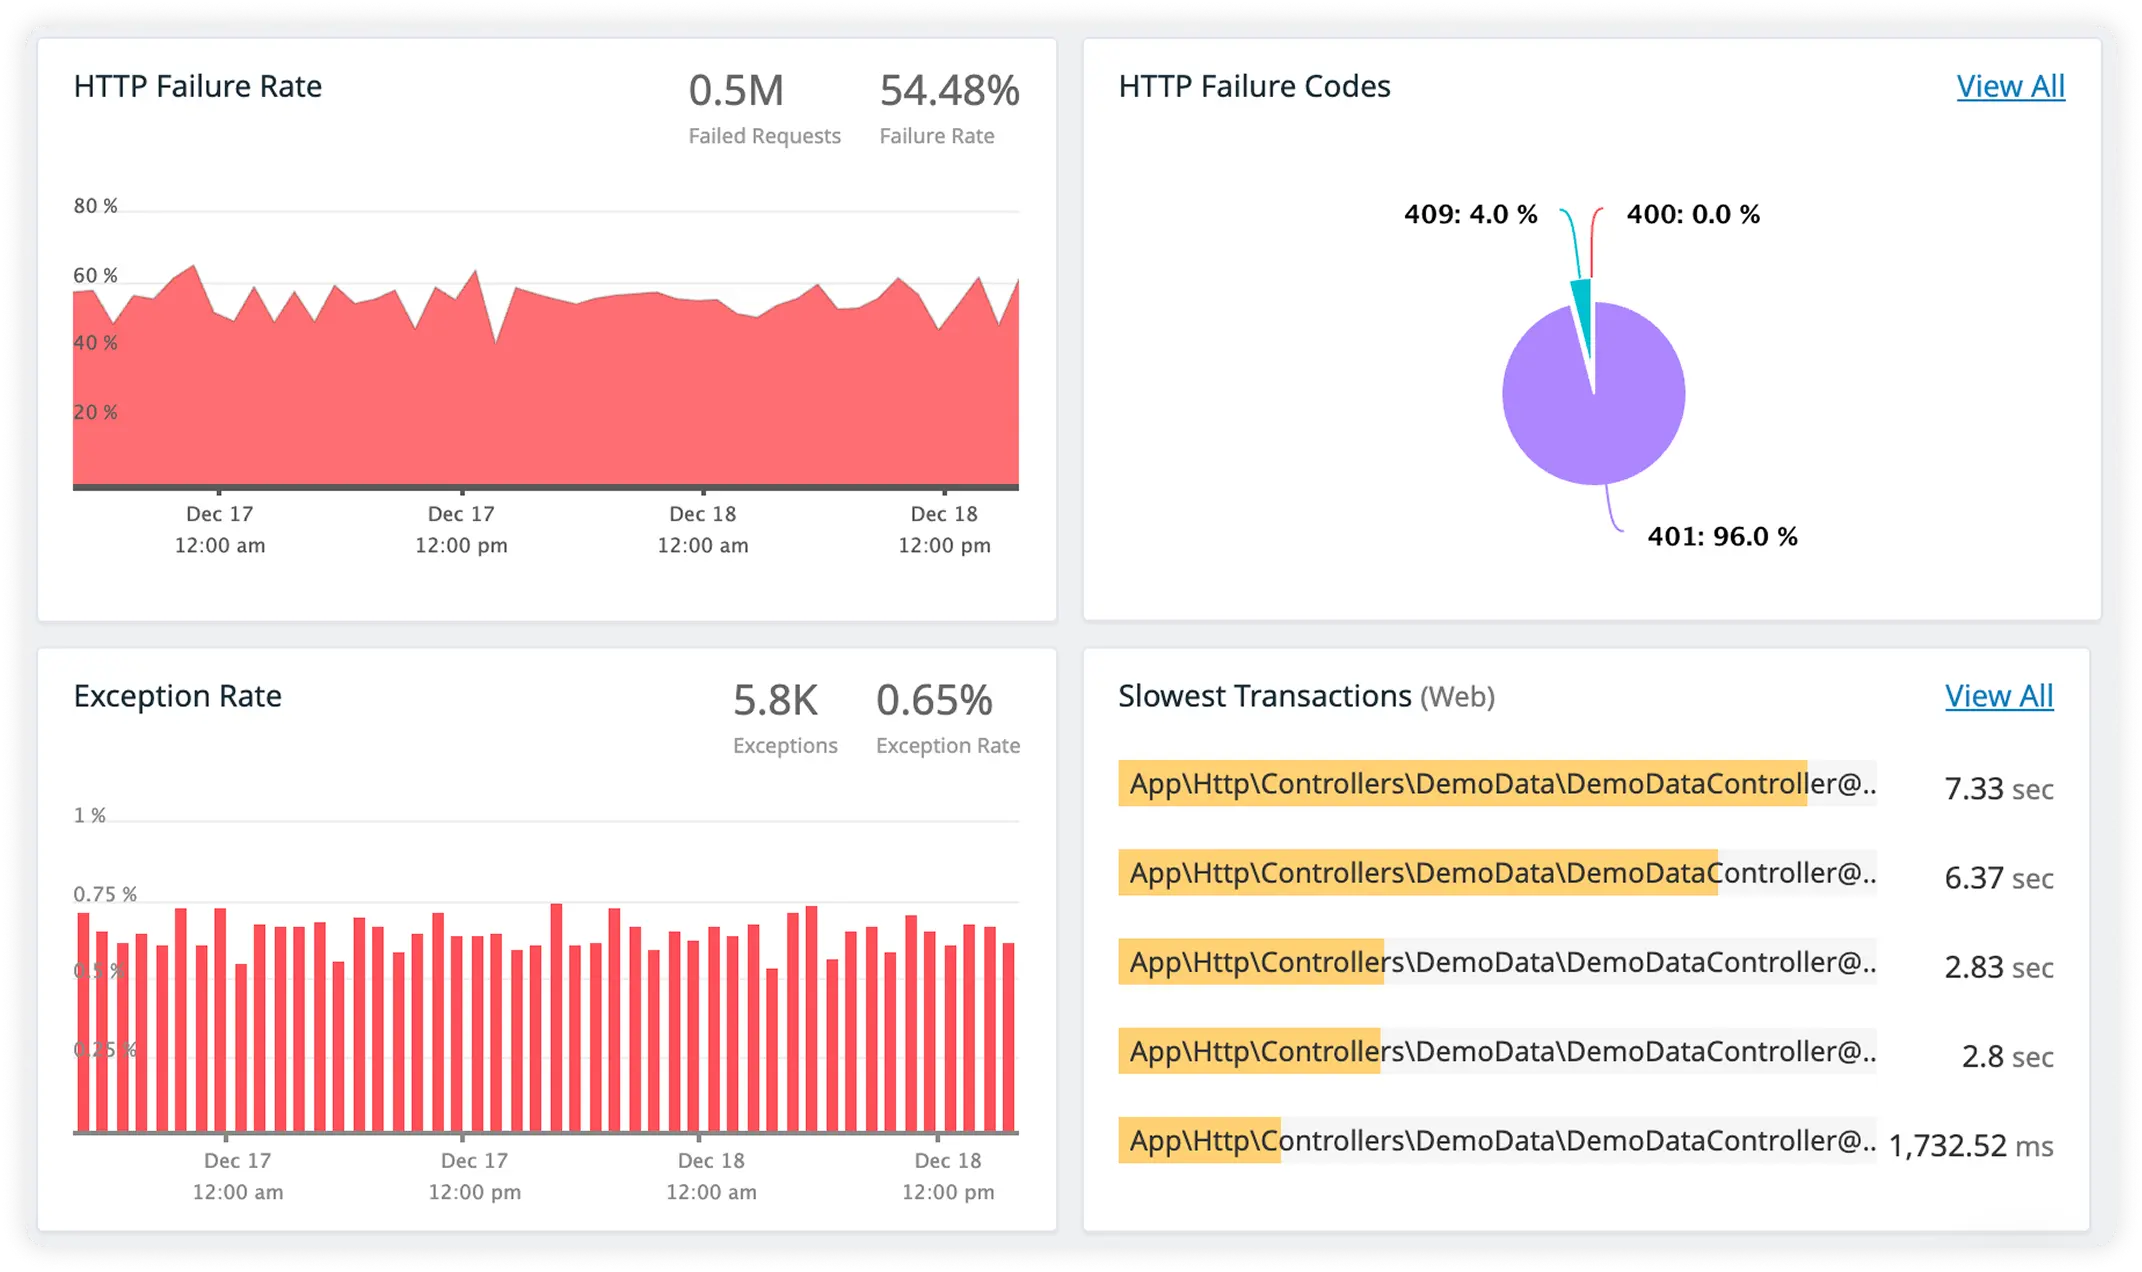
Track External Call Timing
Measure response times for third-party APIs, integrations, and external services. Identify slow dependencies before they impact user experience.
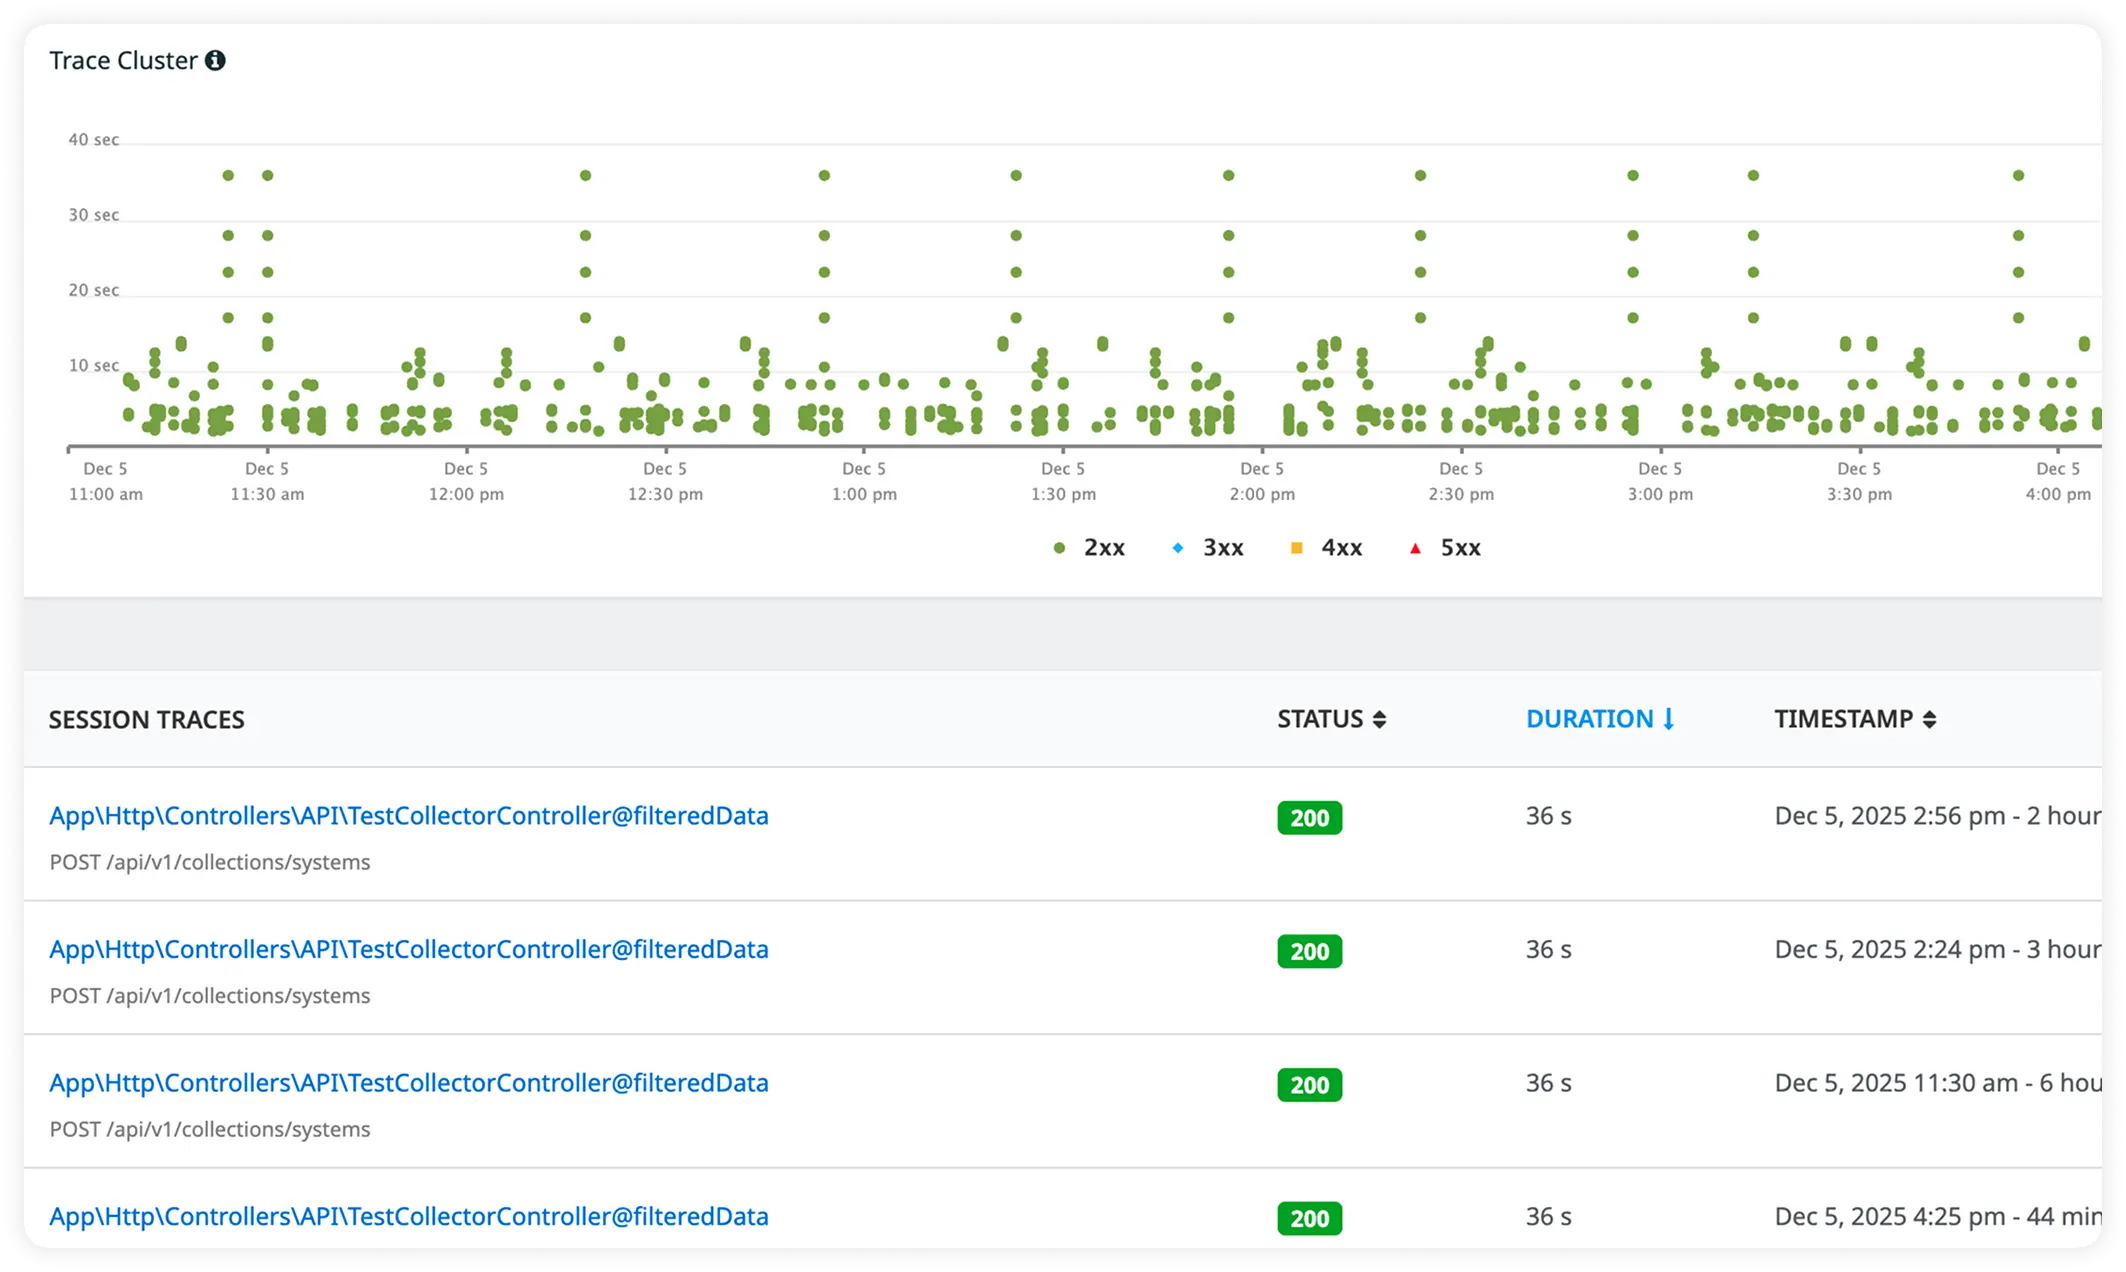
Detailed Exception Visibility
Capture full stack traces and rich contextual data for Drupal errors in real time. Resolve issues faster with precise root-cause insight.
Why Teams Choose Atatus for Drupal Performance Optimization?
Engineering teams adopt Atatus when system complexity outpaces intuition. The choice is driven by how quickly teams can form accurate mental models of production behavior and sustain confidence as systems evolve.
Execution Level Understanding
Teams reason about real request paths, not averaged abstractions. This shortens investigation cycles.
Deterministic Runtime Evidence
Engineers base conclusions on observed execution paths instead of inferred behavior. This removes ambiguity during performance analysis and incident response.
Production Native Signals
Insights are derived from live traffic patterns, not synthetic instrumentation assumptions.
Low Friction Adoption
Engineers engage without retraining workflows. Usage grows naturally across roles.
Hook Order Preservation
Engineers can reason about request behavior in the exact order hooks, subscribers, and middleware execute, instead of inferring impact from collapsed timings.
Consistent Failure Attribution
Errors are evaluated in the context of the hook, service, or event subscriber that mutated state, avoiding blame drift across modules.
Post Deploy Hook Drift
After deployments, teams verify whether hook execution timing or ordering changed, rather than guessing which release introduced latency.
Module Interaction Exposure
As contrib and custom modules stack, teams observe how hooks compound execution cost instead of treating performance as an averaged outcome.
Runtime Feedback Precision
Operational tuning is based on how hooks behave under real traffic and cache states, tightening the loop between code change and system response.
Unified Observability for Every Engineering Team
Atatus adapts to how engineering teams work across development, operations, and reliability.
Developers
Trace requests, debug errors, and identify performance issues at the code level with clear context.
DevOps
Track deployments, monitor infrastructure impact, and understand how releases affect application stability.
Release Engineer
Measure service health, latency, and error rates to maintain reliability and reduce production risk.