echo Performance Monitoring
Get end-to-end visibility into your Echo performance with application monitoring tools. Gain insightful metrics on performance bottlenecks with Go monitoring to optimize your application.
What caused echo production visibility to break first?
Context Propagation Breaks
Nested handlers drop request contexts, triggering cascading timeouts. Backend engineers chase phantom delays across call stacks.
Goroutine Channel Leaks
Unclosed streaming channels spawn memory hogs under load. Platform teams miss routine proliferation without runtime profiles.
Route Group Bloat
Hundreds of endpoints fragment visibility into silos. SREs manually map traffic patterns across ungrouped paths.
Dependency Injection Shadows
Global vars hide service bindings, breaking trace continuity. Backend debugging stalls on unmockable handler scopes.
Shutdown Resource Drains
Abrupt terminations leave DB handles and sockets open. Platform ops correlate crashes to unclean exits blindly.
Validation Latency Spikes
Heavy binders choke high RPS, masking schema mismatches. Engineers profile request parsing without aggregated timings.
Binder Overhead Explosion
Throughput increases mask saturation points. Systems fail gradually with no clear early indicators.
Route Growth Complexity
Expanding APIs increase runtime surface area. Identifying critical paths becomes increasingly difficult.
Complete Performance Visibility for
Echo Applications
Real-time observability for Echo workloads that helps teams trace request performance, optimize execution flow, and resolve production issues faster.
Trace-Level Visibility Across Go Requests
Track every Echo request through handlers, database operations, and external services with full execution visibility to identify performance issues instantly.
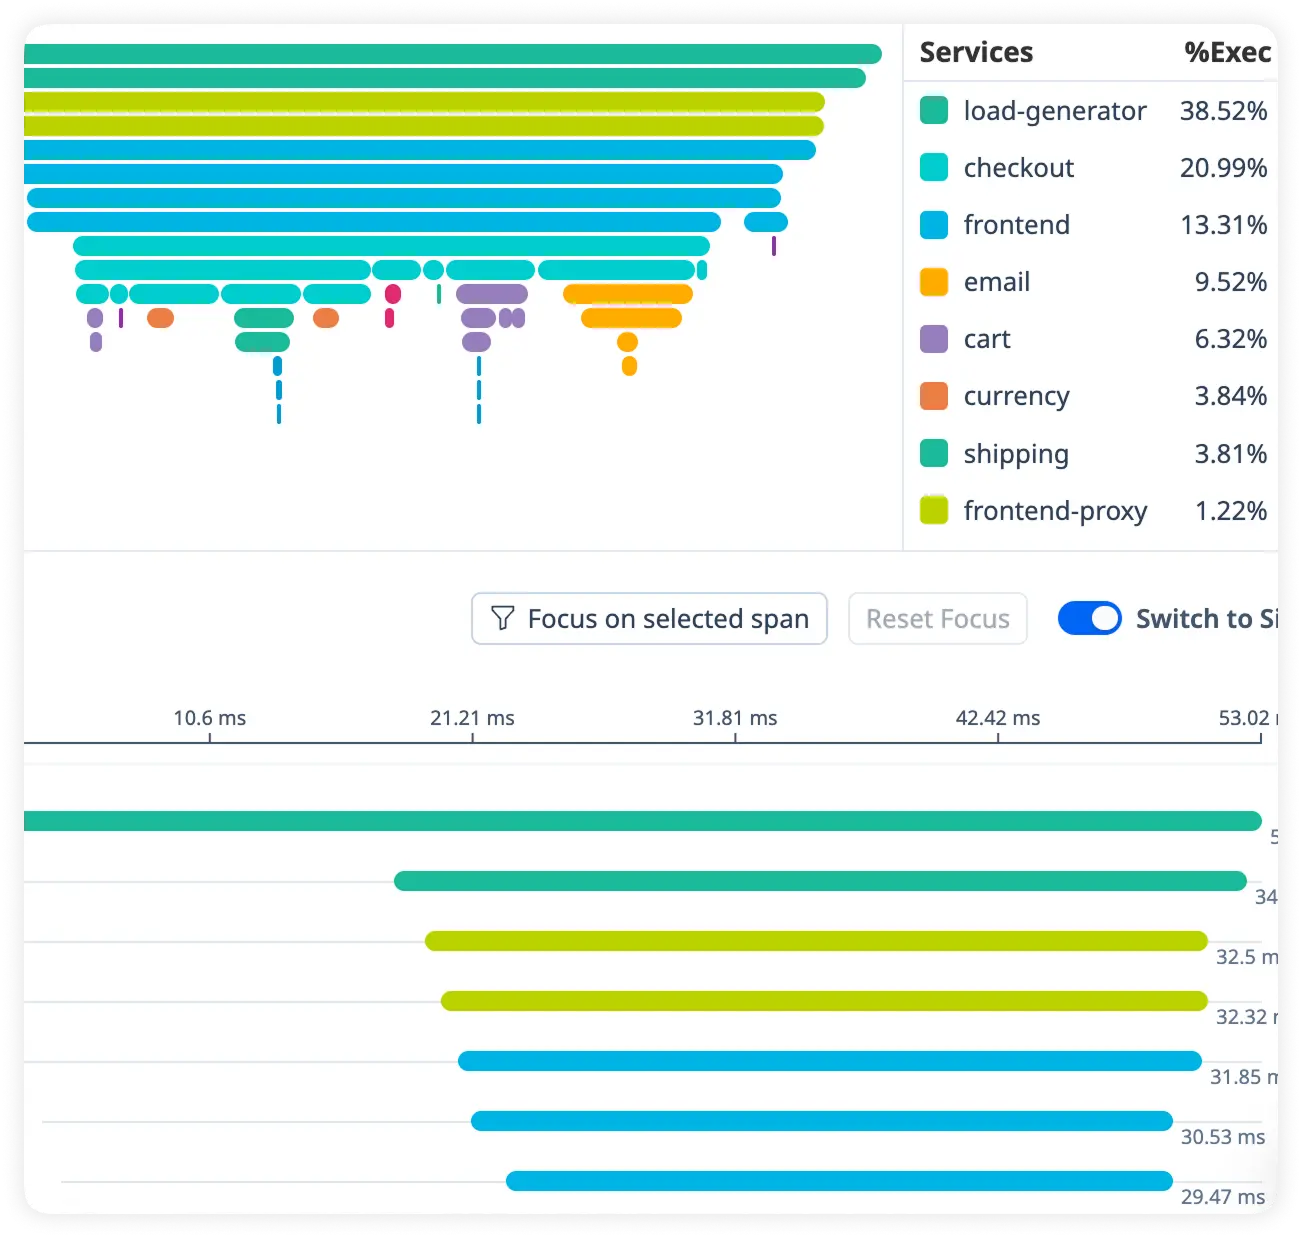
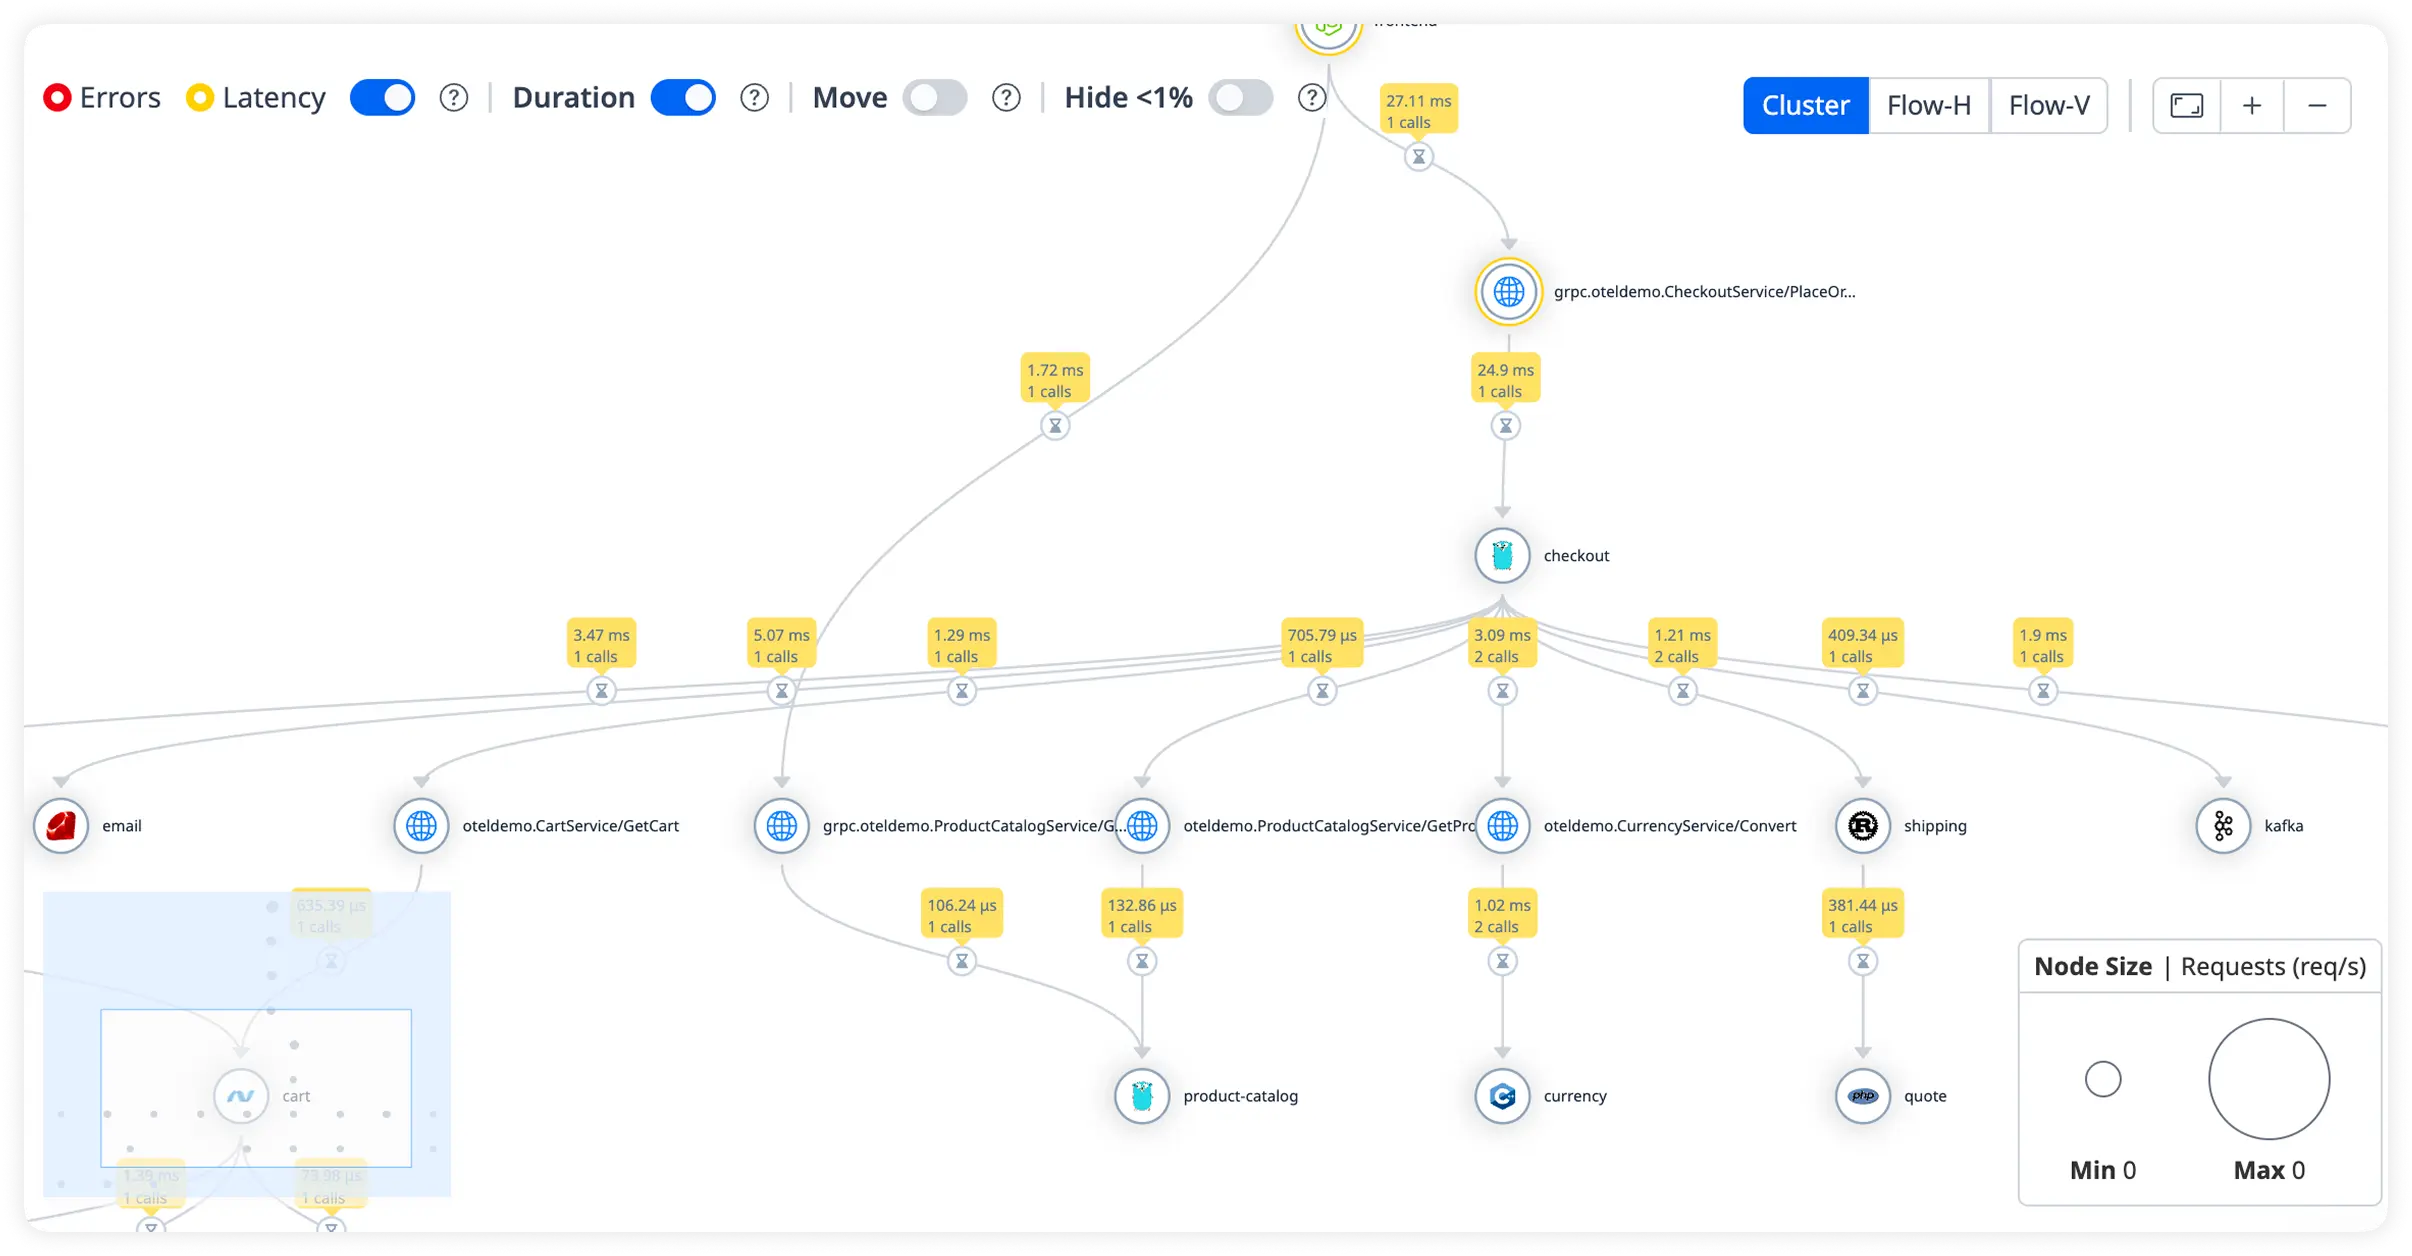
Visualize Service Interactions
Understand how Go services communicate using real-time dependency maps with latency trends, traffic flow, and system health metrics.
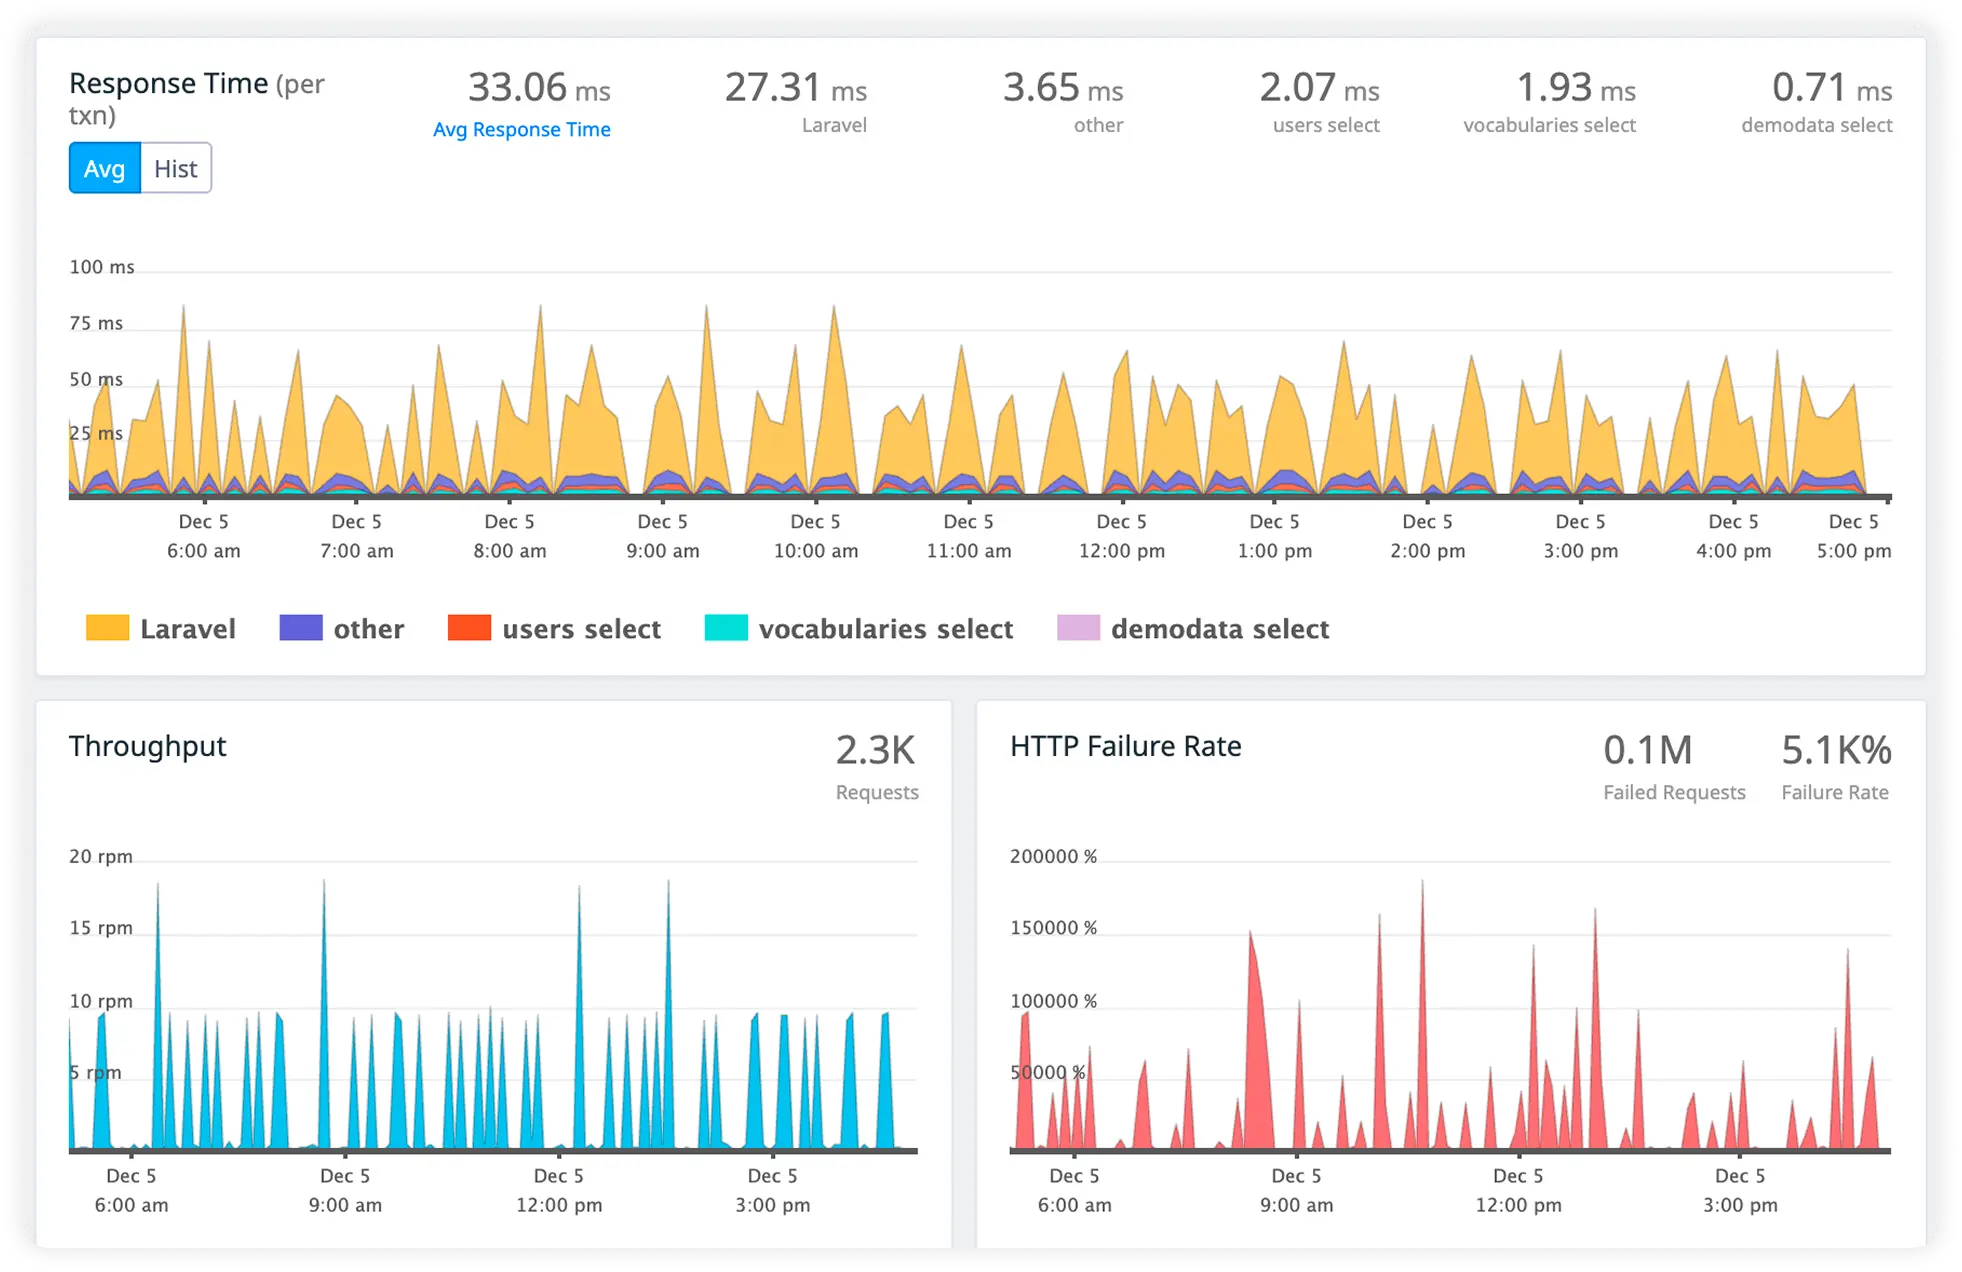
Monitor High-Impact Routes
Track slow routes and core workflows affecting response times to maintain consistent performance under production load.
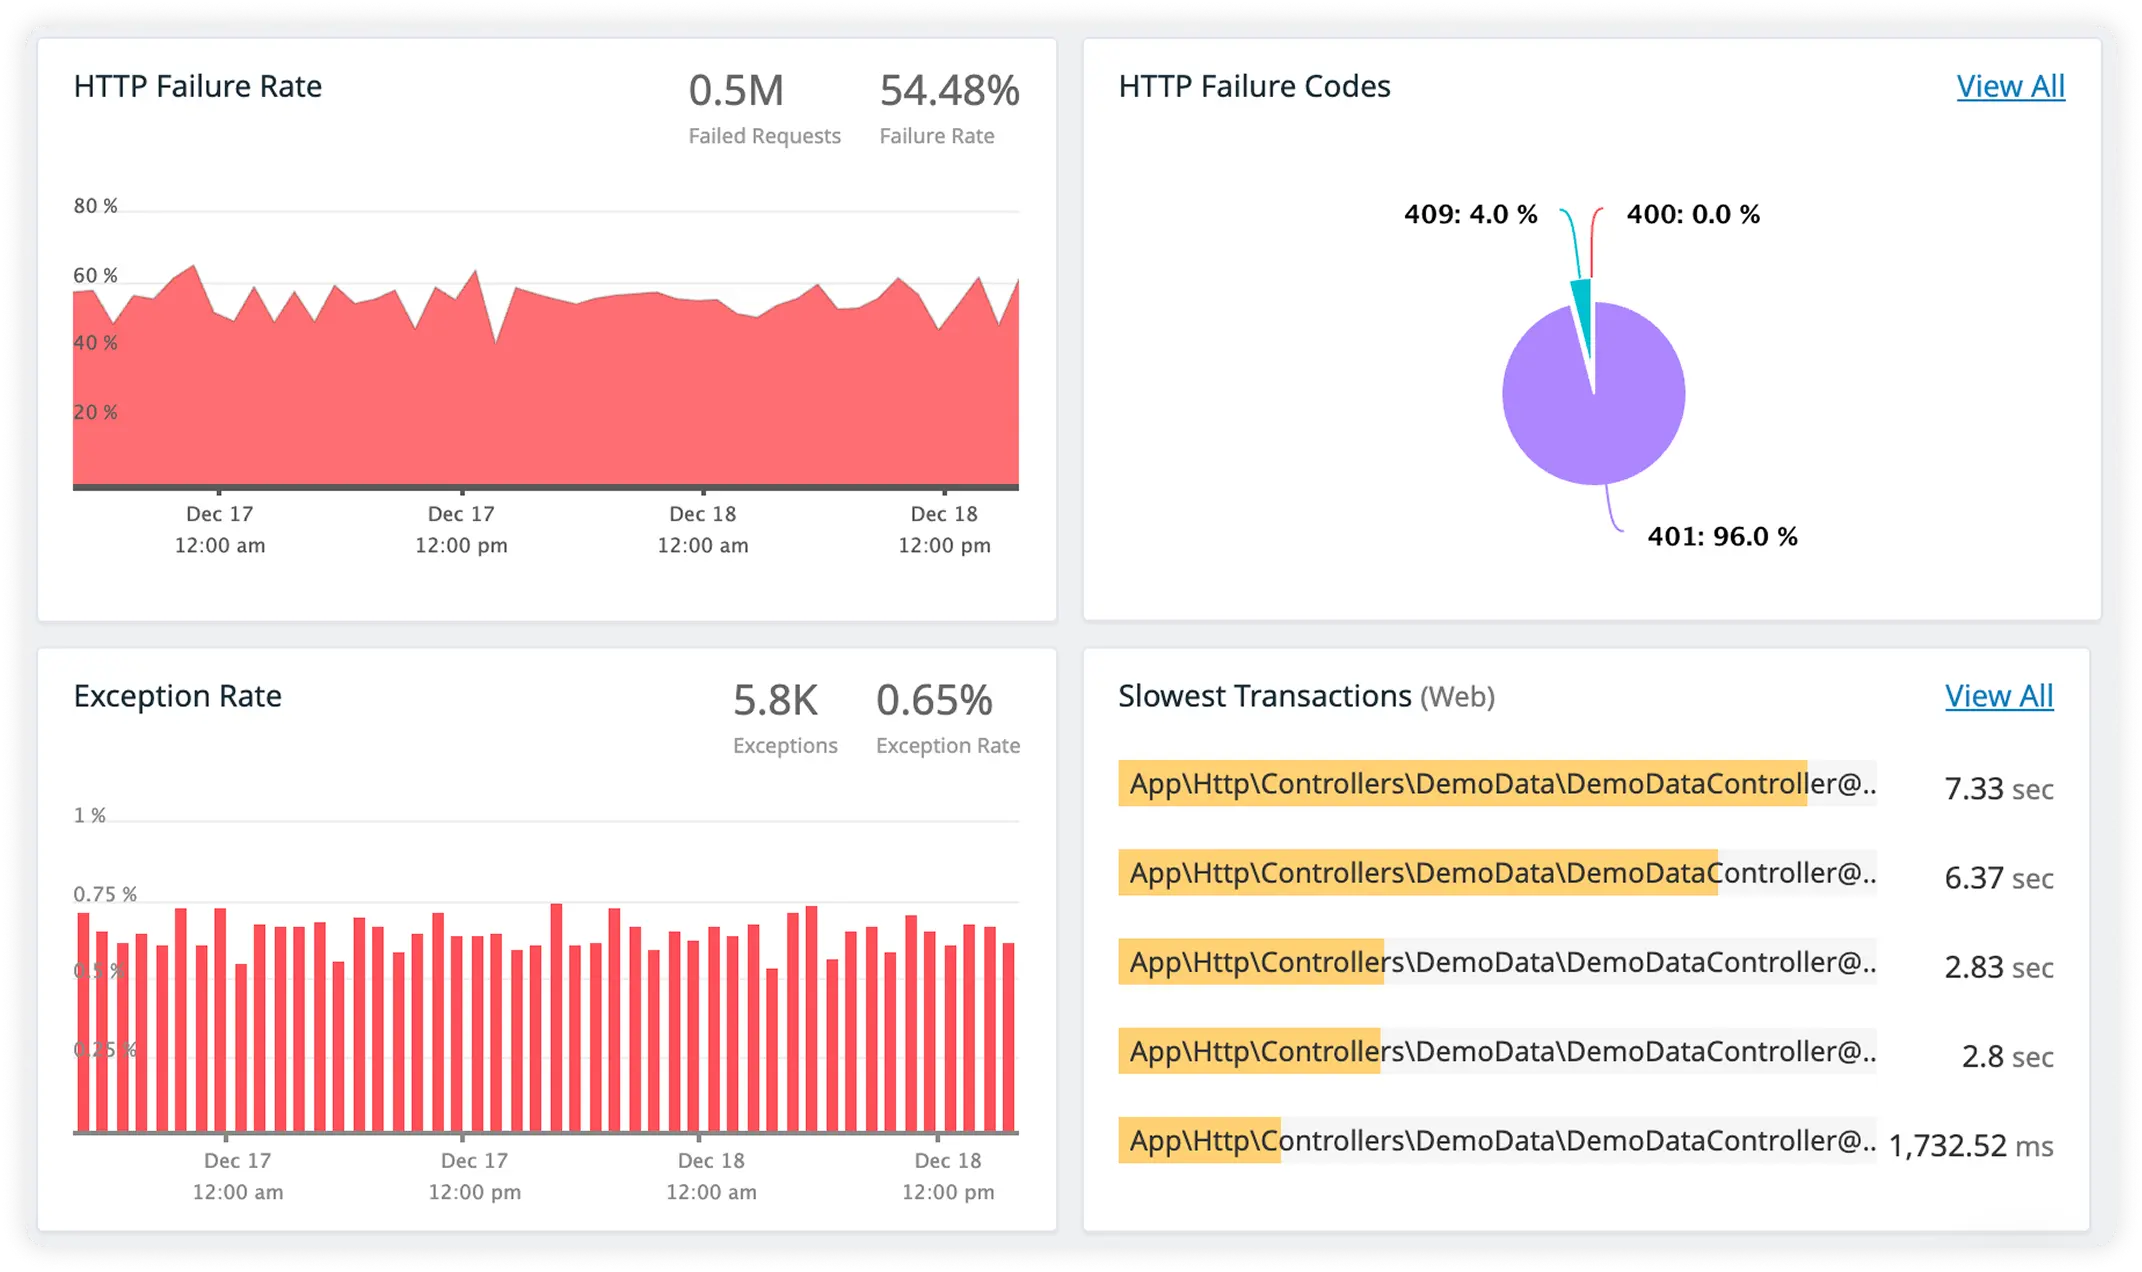
Track External Dependencies
Monitor connected APIs and services continuously to prevent external latency from impacting your application performance.
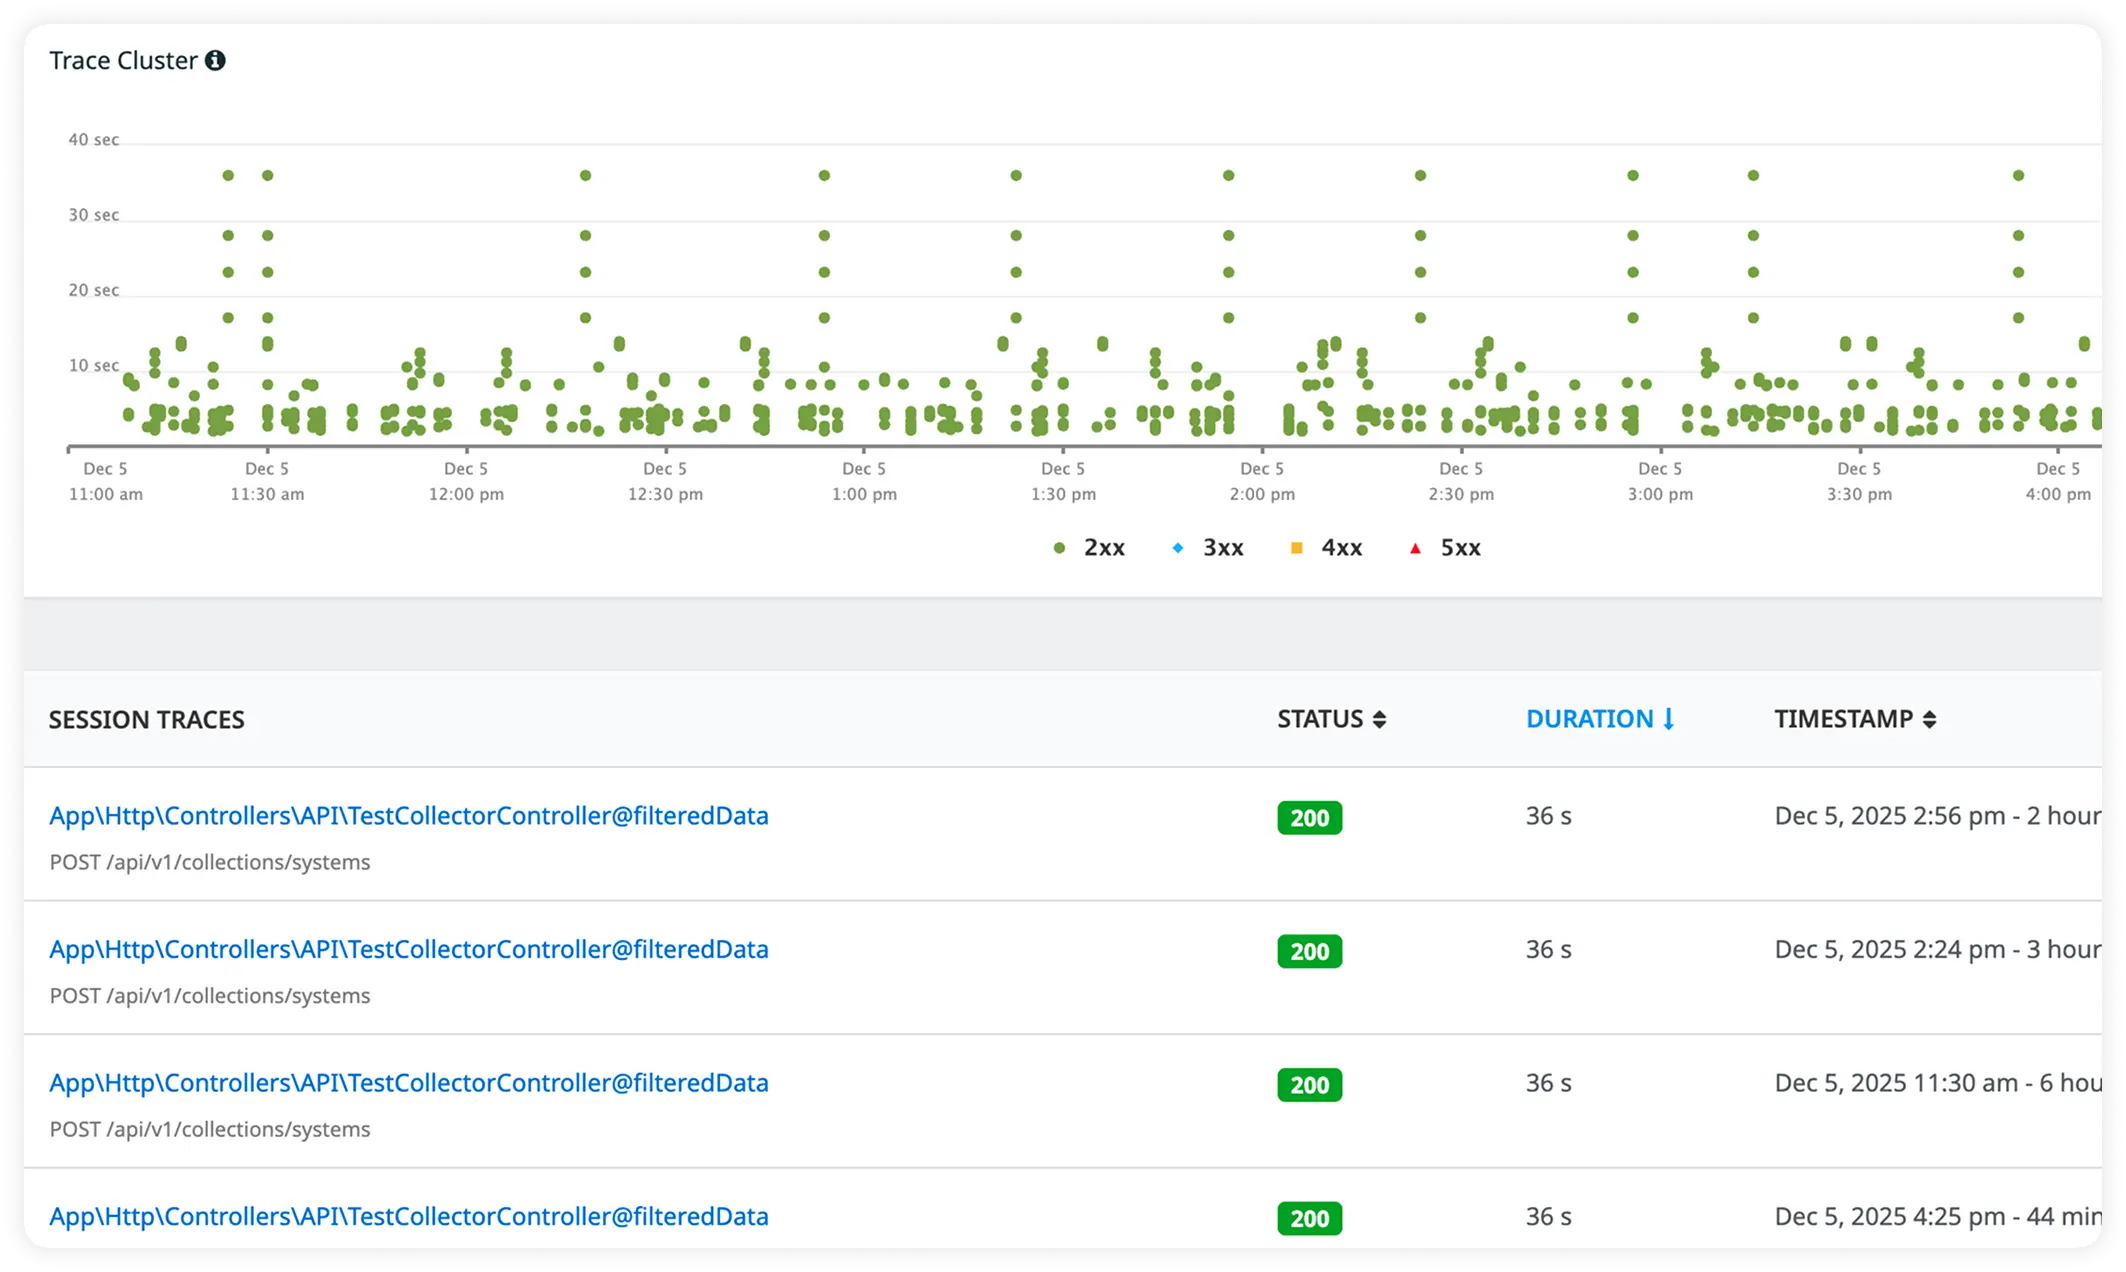
Why Teams Choose Atatus?
Echo platform leads demand Atatus for runtime fidelity that accelerates triage over tool sprawl. Backend crews lock in observability from first deploy.
Handler Span Precision
Request flows map exact middleware latencies post-startup. Devs pinpoint ordering faults in live cycles instantly.
Stdlib Context Fidelity
Preserves native Echo contexts without wrapper overheads. SREs trace cancellations through unmodified stacks cleanly.
Routine Profile Accuracy
Goroutine trees expose leak sources by allocation site. Platform teams prune memory paths with line-level data.
Grouped Route Insights
Traffic aggregates reveal endpoint silos at scale. SREs balance loads across versioned path clusters precisely.
Binding Cost Breakdowns
Parser latencies split from handler execution cleanly. Devs optimize validators against real payload distributions.
Shutdown Event Capture
Graceful closures log open handles pre-crash. Platform ops audit resource hygiene across deploys reliably.
Service Binding Traces
Dependency scopes link to concrete implementations natively. Backend tests mirror production injection faithfully.
Consistent Runtime Interpretation
Signals align directly with execution behavior, reducing ambiguity during investigation.
Long-Term Confidence
As architectures, traffic patterns, and ownership change, teams retain continuity in how production systems are understood and operated.
Unified Observability for Every Engineering Team
Atatus adapts to how engineering teams work across development, operations, and reliability.
Developers
Trace requests, debug errors, and identify performance issues at the code level with clear context.
DevOps
Track deployments, monitor infrastructure impact, and understand how releases affect application stability.
Release Engineer
Measure service health, latency, and error rates to maintain reliability and reduce production risk.