Flask Performance Monitoring
Get end-to-end visibility into your Flask performance with application monitoring tools. Gain insightful metrics on performance bottlenecks with Python monitoring to optimize your application.
Why flask Performance Degrades Unexpectedly?
Minimal Runtime Signals
Flask exposes very little execution context by default. Engineers lack visibility into how requests behave once traffic increases.
Handler Chain Opacity
Requests pass through view functions, decorators, and extensions. Execution context fragments, obscuring where time is actually spent.
Blocking Code Paths
Synchronous I/O and CPU-heavy logic stall worker threads silently, causing latency spikes under concurrency.
Memory Usage Drift
Object creation and caching grow gradually. Memory pressure accumulates without clear early indicators.
Worker Saturation Blindness
Gunicorn and uWSGI workers reach capacity quietly. Throughput plateaus before alerts signal trouble.
Slow Root Isolation
When response times degrade, isolating the responsible execution segment takes too long during incidents.
Scale Exposes Assumptions
Architectures that worked at low traffic fail unpredictably as request volume and concurrency increase.
After Impact Debugging
Teams investigate only after users are affected. Root causes remain unclear, increasing repeat failures.
Complete Performance Visibility for
Flask Applications
Real-time observability for Flask workloads that helps teams understand request behavior, optimize performance, and resolve production issues faster.
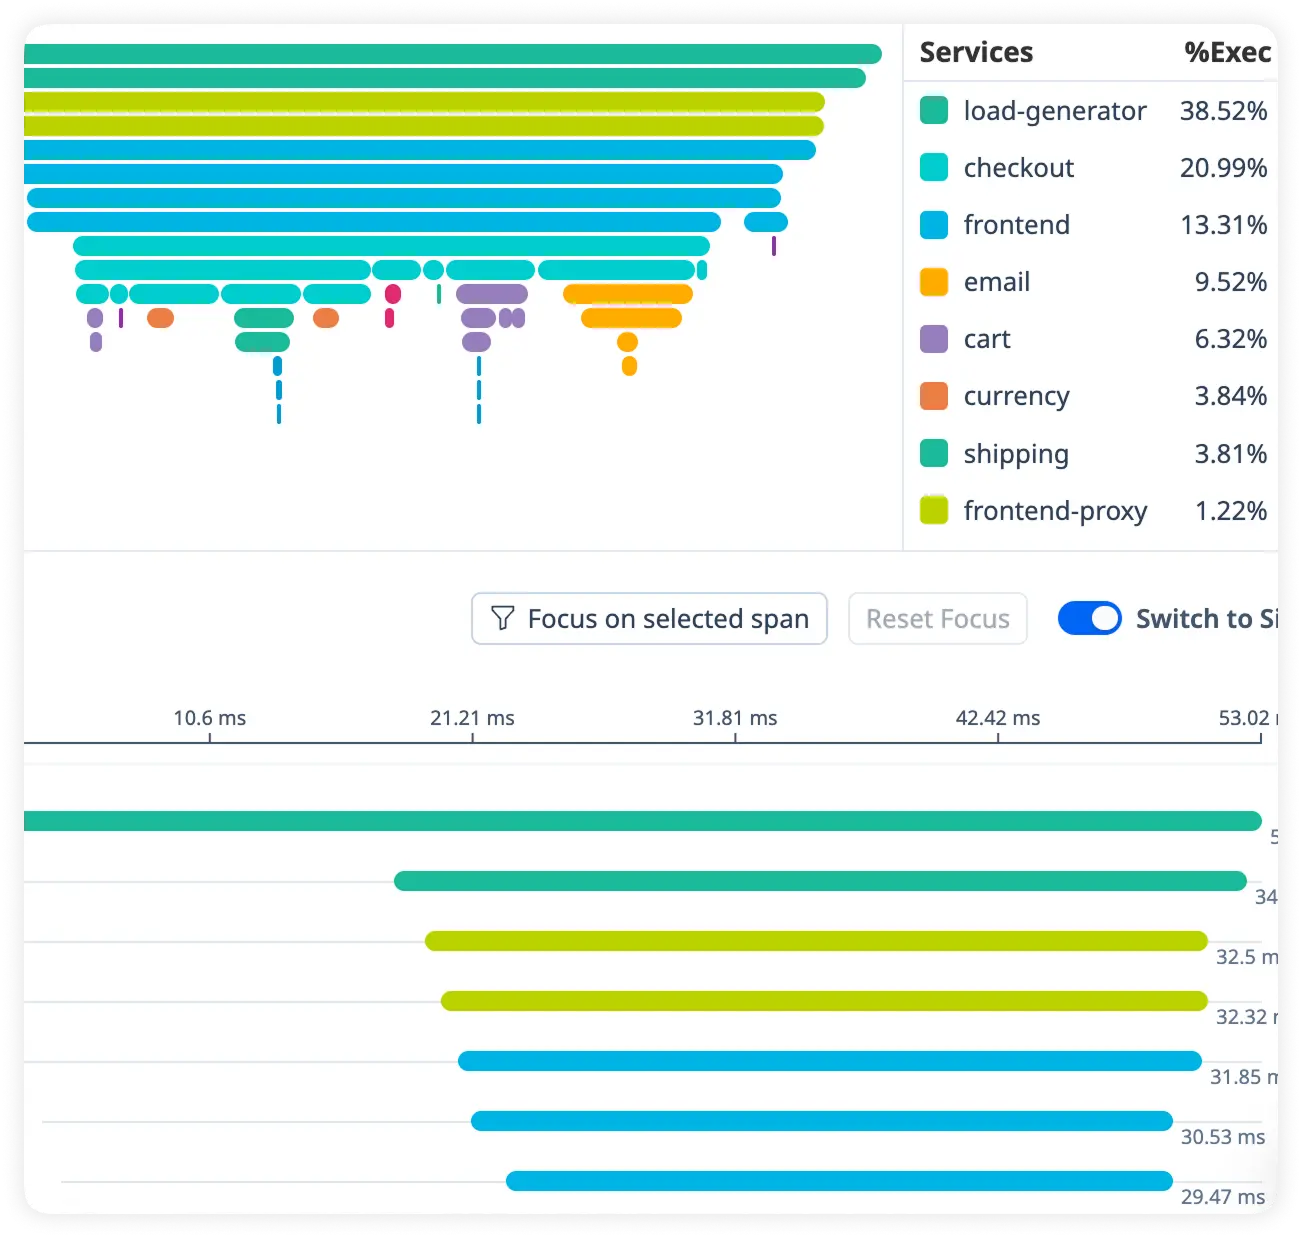
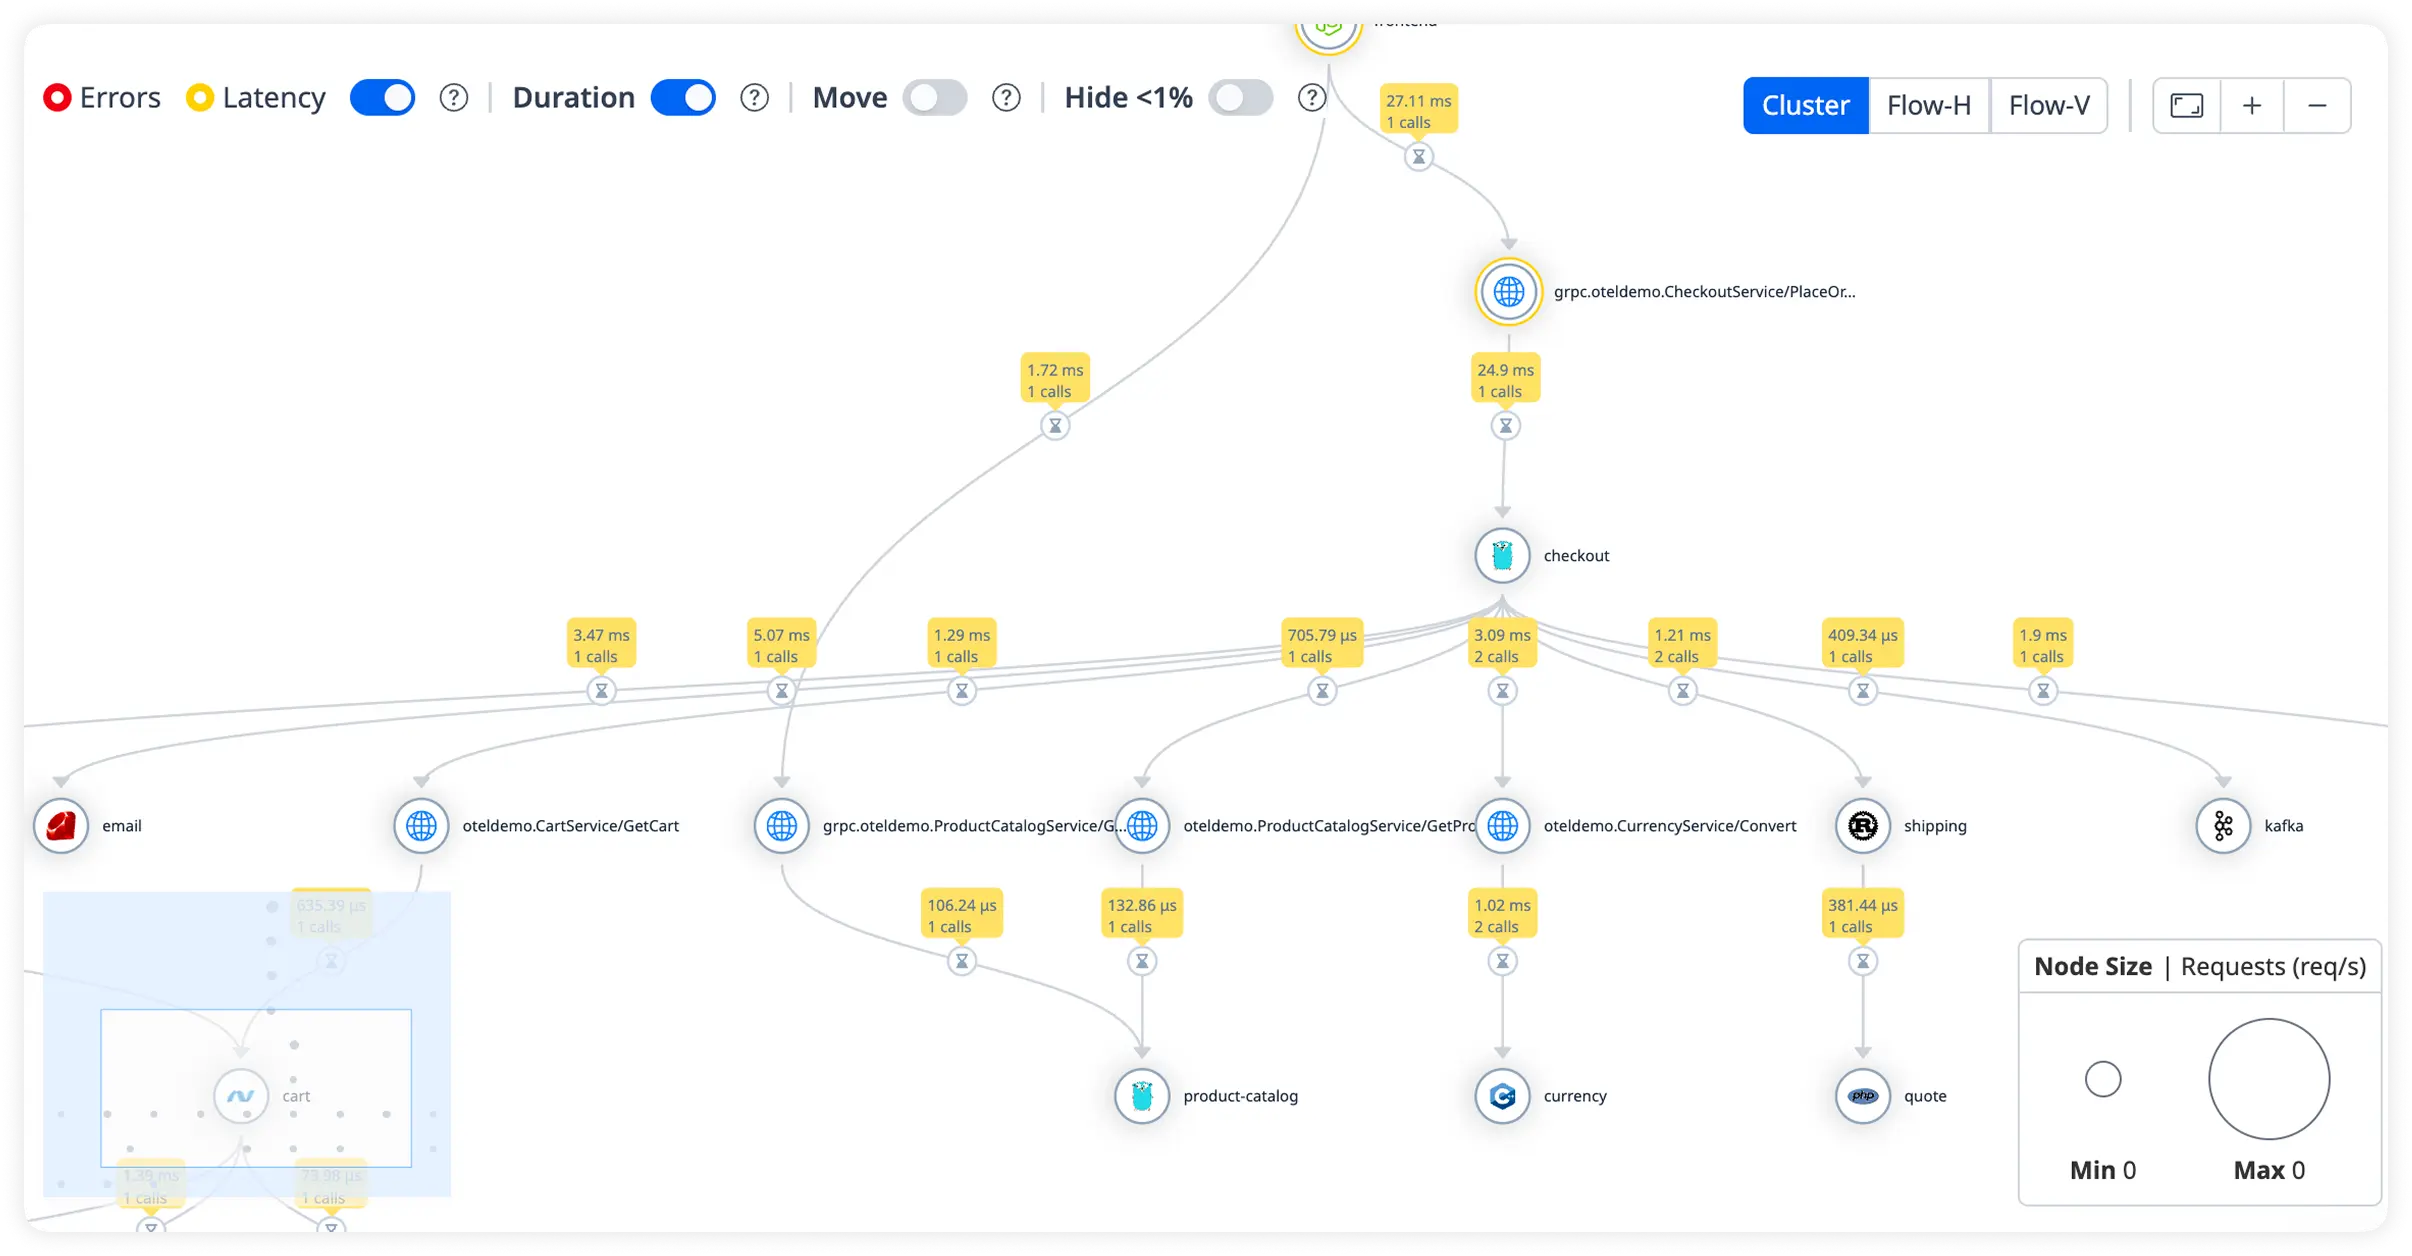
Detailed Request Duration Breakdown
Track how long each request takes from entry to response. Quickly uncover slow execution paths affecting application responsiveness.
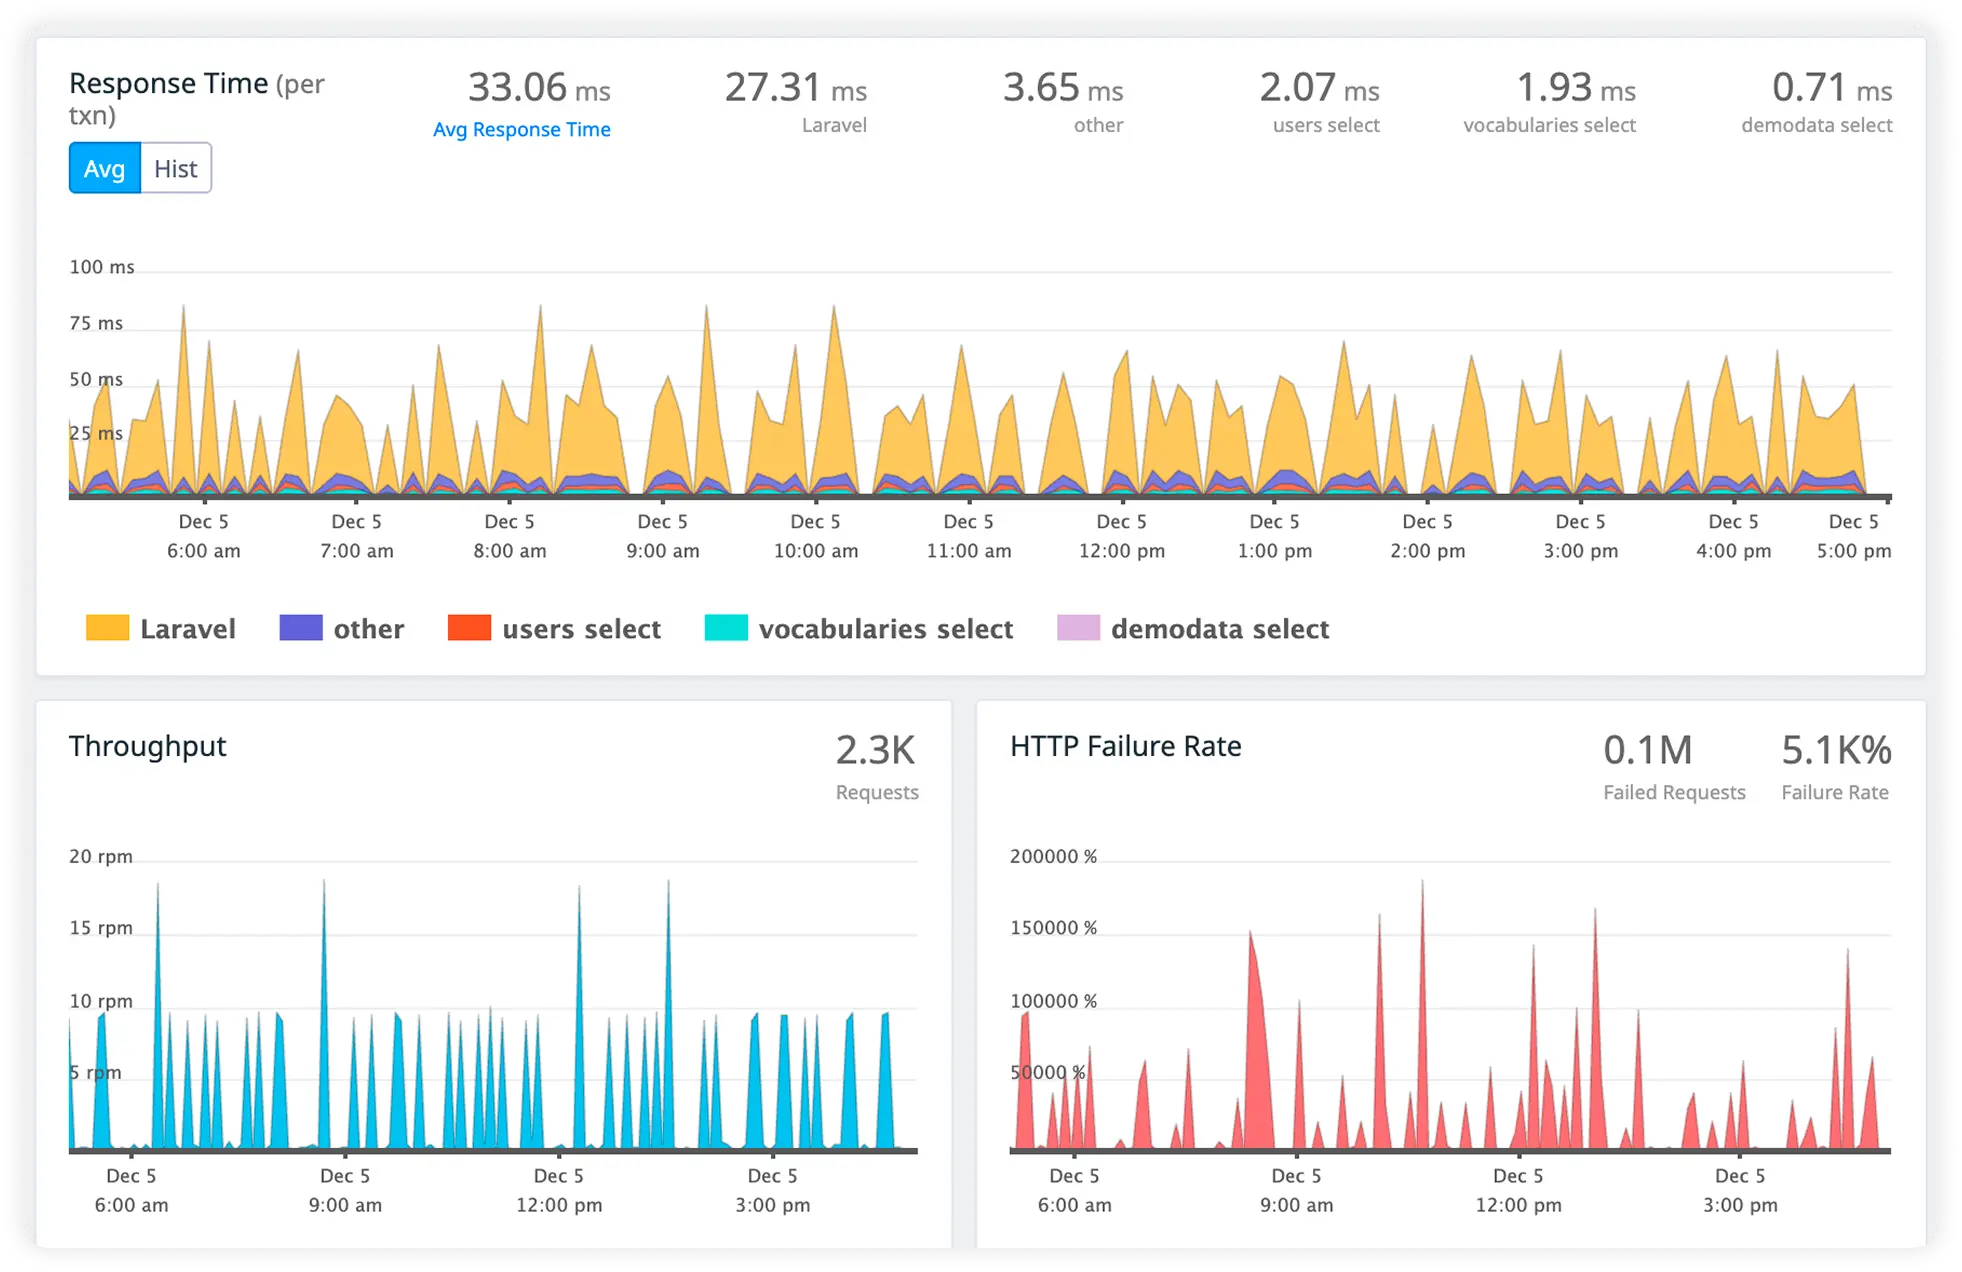
Actionable Query Insight
Monitor database query execution time and performance in real time. Eliminate inefficient queries slowing your application.
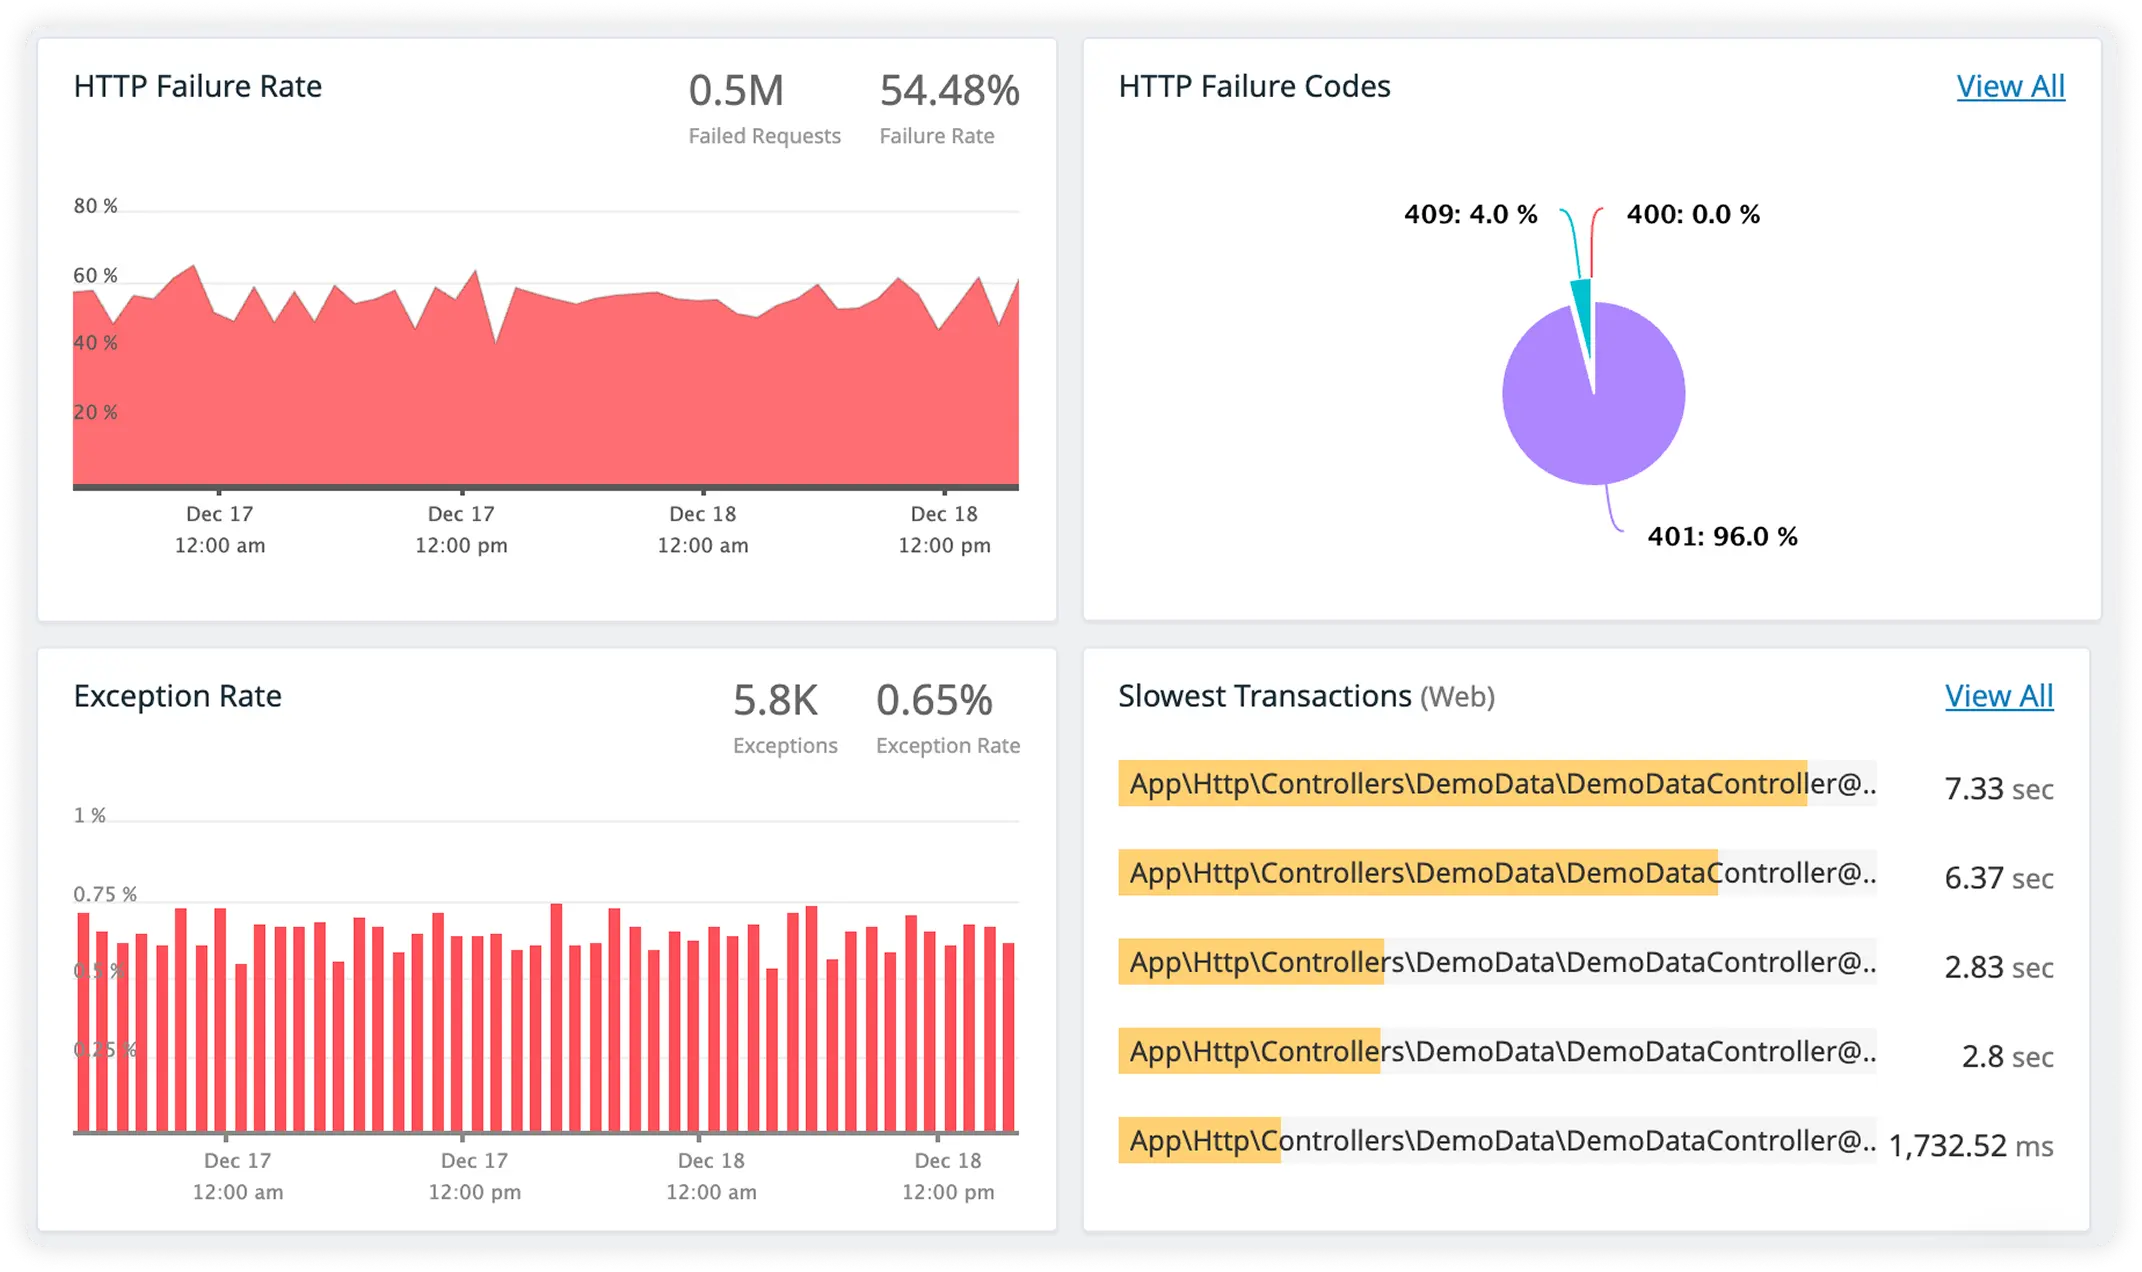
Measure Cache Efficiency Metrics
Analyze how caching layers improve response speed and reduce load. Identify cache misses and performance gaps impacting users.
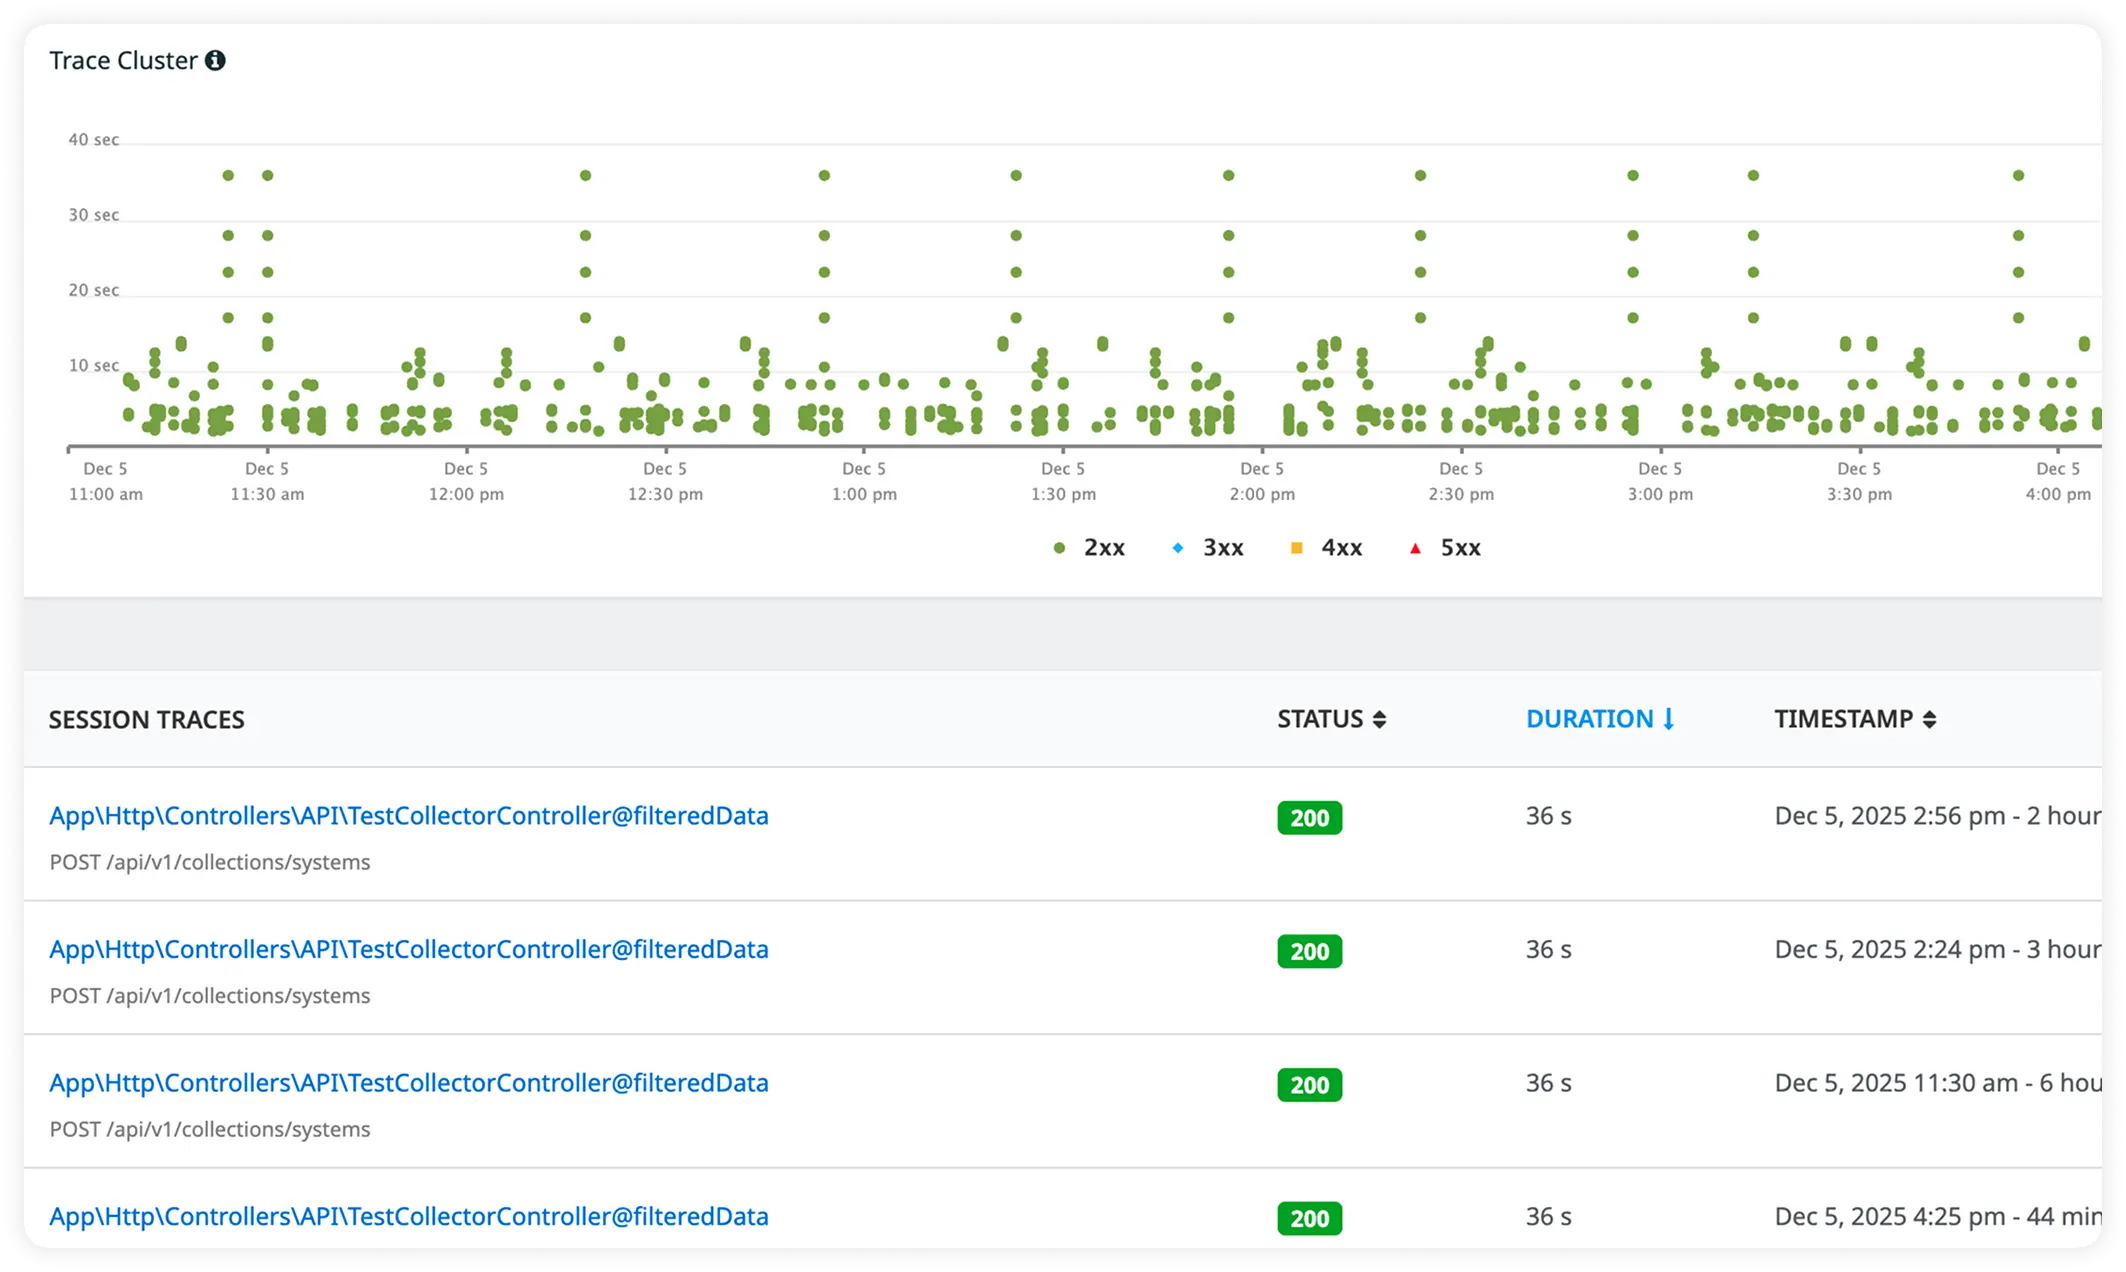
External Service Timing with Trace-Correlated Metrics
Track response times for third-party APIs while correlating metrics with request traces. Understand how dependencies influence overall application performance.
Why Teams Choose Atatus?
Teams choose Atatus when Flask services evolve into production-critical systems. It delivers execution clarity without disrupting lightweight application design.
Clear Execution Grounding
Engineers gain a precise view of request behavior across handlers, extensions, and runtime boundaries.
Fast Operational Clarity
Production insight becomes useful quickly, without prolonged setup or heavy operational effort.
Developer Trusted Signals
Data aligns with real execution paths, allowing engineers to debug confidently during incidents.
Safe Runtime Presence
Operates alongside live Flask workloads without destabilizing request processing.
Incident Ready Context
During failures, teams analyze concrete execution evidence rather than surface-level symptoms.
Scale Without Concurrency
As concurrency and request volume grow, runtime understanding remains consistent instead of degrading under load.
Low Operational Weight
Platform and SRE teams avoid managing heavy monitoring stacks for services designed to stay minimal.
Shared Runtime Understanding
Backend, SRE, and platform teams work from the same execution reality, reducing friction during incidents.
Confident Dependency Trust
Teams validate the runtime impact of code and configuration changes with clarity, lowering deployment risk.
Unified Observability for Every Engineering Team
Atatus adapts to how engineering teams work across development, operations, and reliability.
Developers
Trace requests, debug errors, and identify performance issues at the code level with clear context.
DevOps
Track deployments, monitor infrastructure impact, and understand how releases affect application stability.
Release Engineer
Measure service health, latency, and error rates to maintain reliability and reduce production risk.