Hapi Performance Monitoring
Get end-to-end visibility into your Hapi performance with application monitoring tools. Gain insightful metrics on performance bottlenecks with Node.js monitoring to optimize your application.
Why hapi Production Behavior Becomes Hard to Reason About?
Lifecycle Phase Blindness
hapi requests move through onRequest, auth, validation, handler execution, and response phases. In production, teams cannot see which lifecycle phase actually introduced latency or failure.
Extension Ordering Uncertainty
Multiple extensions attach to the same lifecycle events. Under real traffic, the execution order and cumulative cost of these extensions become unclear.
Auth Flow Opacity
Authentication strategies execute early and conditionally. When auth slows down or fails, engineers struggle to attribute impact to specific strategies or hooks.
Validation Cost Drift
Payload and query validation behave differently as request sizes and data shapes grow. Validation overhead silently increases without clear attribution.
Async Handler Fragmentation
Async handlers and pre-handlers resolve independently. When execution stalls, teams lose visibility into which async boundary delayed the response.
Dependency Injection Ambiguity
Shared services are injected across handlers and extensions. Under load, it becomes difficult to tell which dependency introduced blocking or contention.
Scale-Triggered Timing Shifts
At higher concurrency, lifecycle timing changes. Code paths that appear stable in staging behave differently when event loop pressure increases.
Post-Failure Context Loss
Errors surface after lifecycle state has already mutated. By the time investigation starts, the execution context that explains the failure is gone.
Real-Time Performance Insight for
Hapi Applications
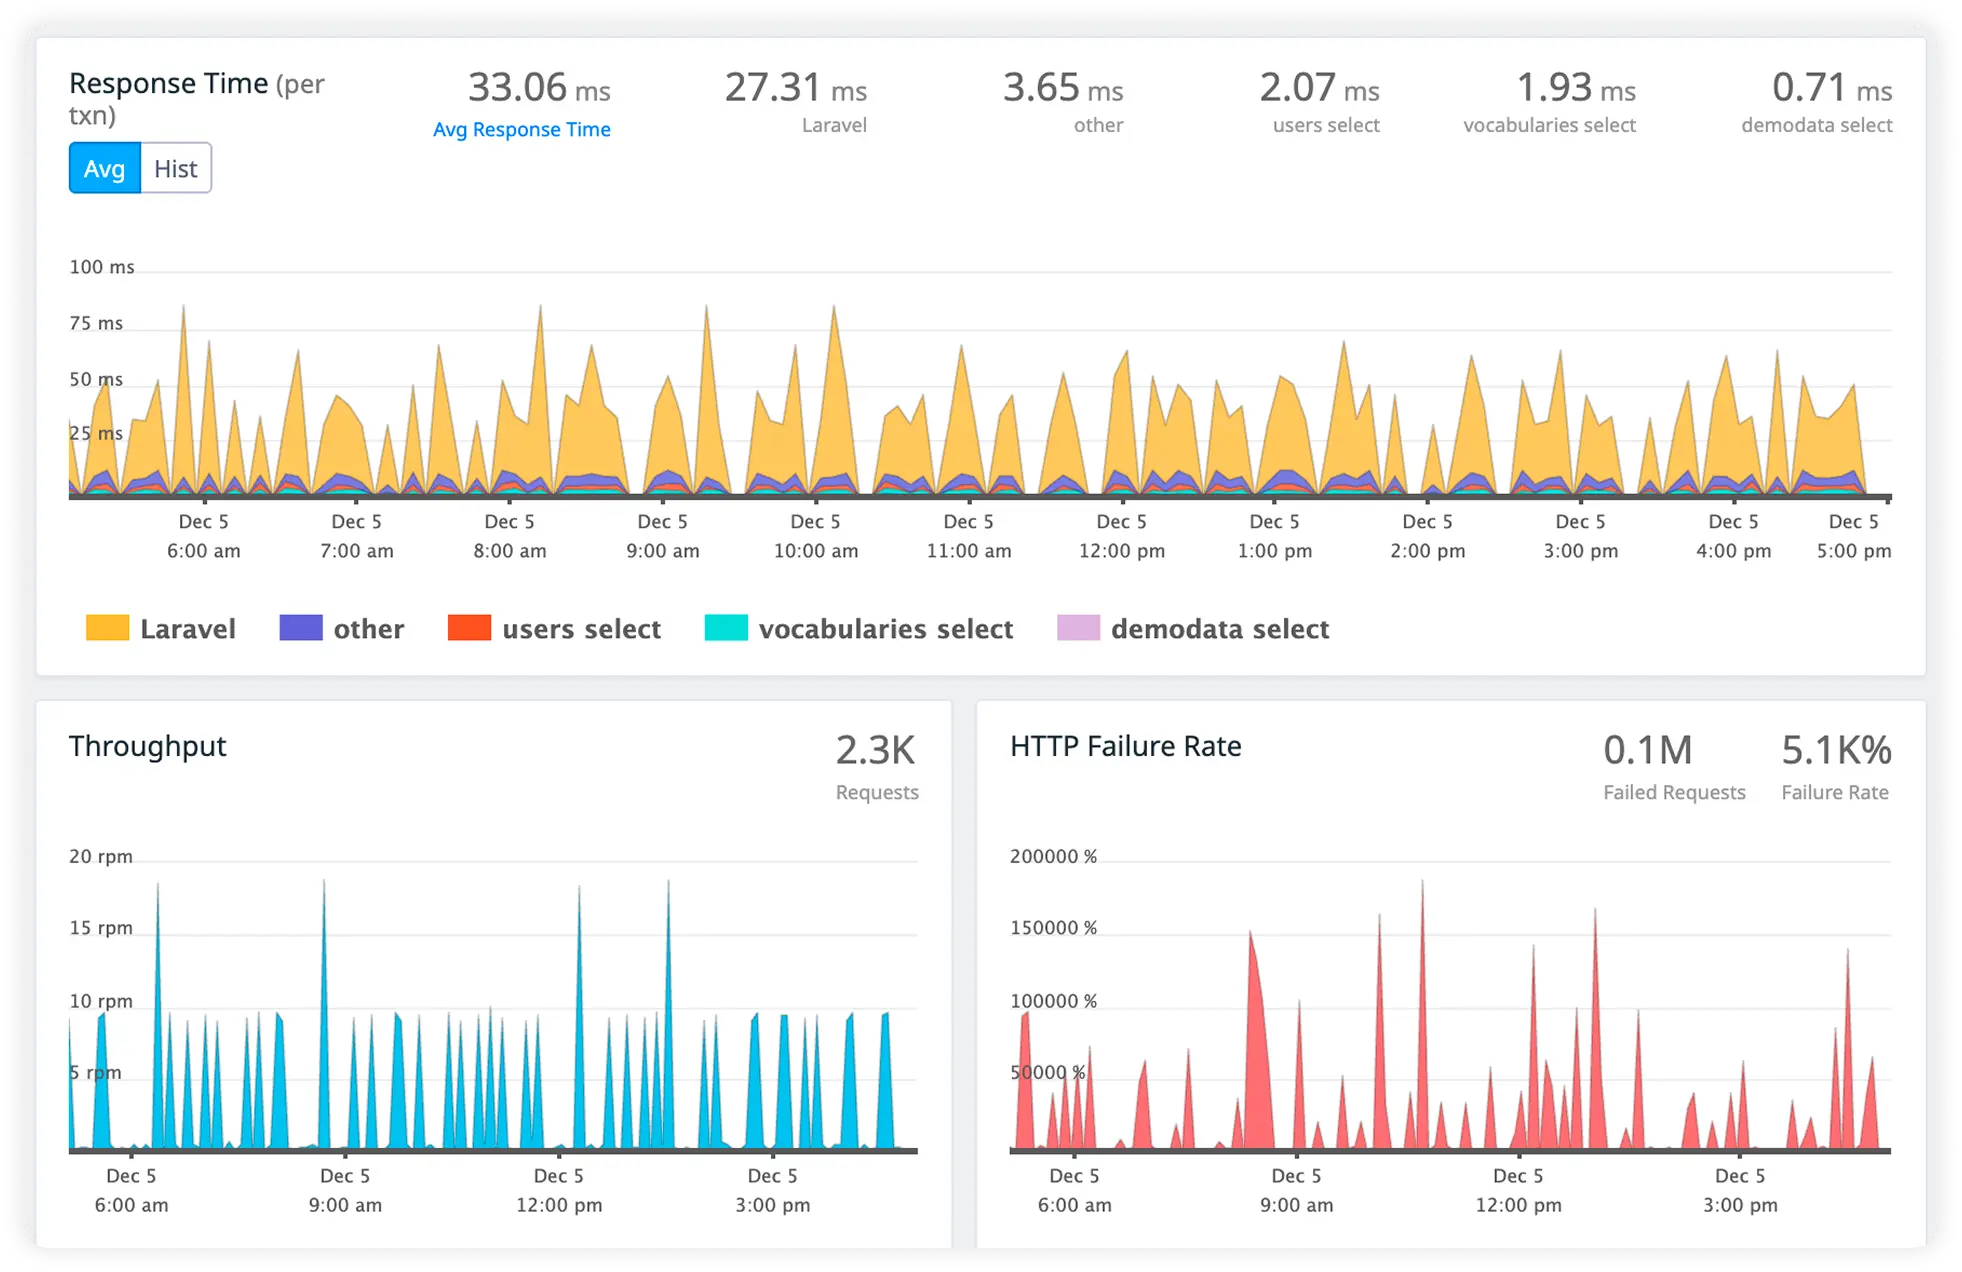
End-to-end observability for Hapi workloads that helps teams understand traffic behavior, optimize route performance, and maintain reliable production systems.
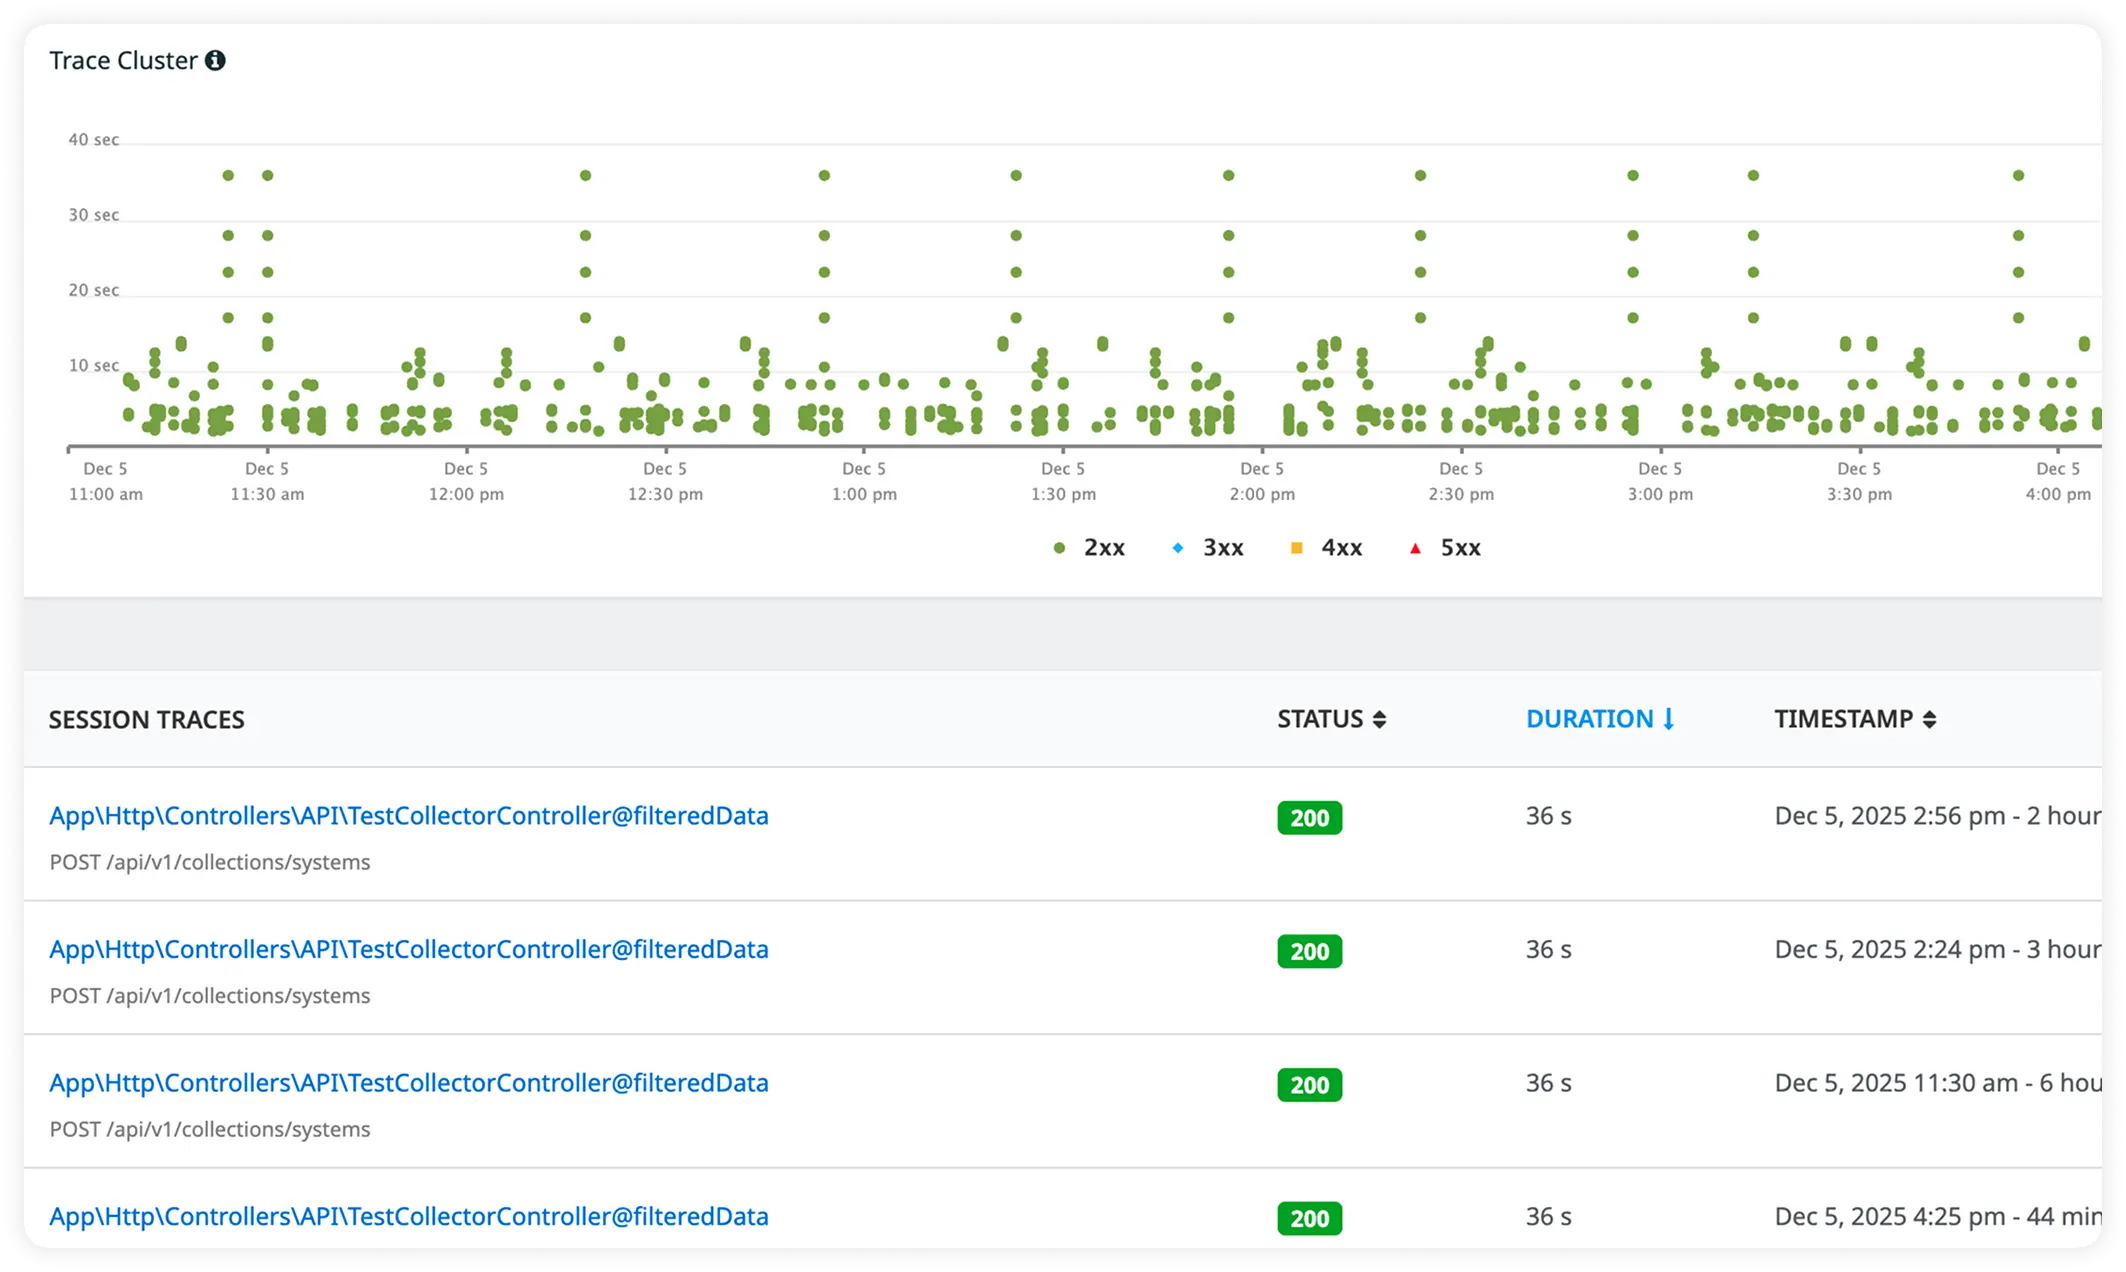
Identify the Slowest Routes
Quickly surface which routes consume the most processing time under real traffic. Focus optimization efforts where performance impact is highest.
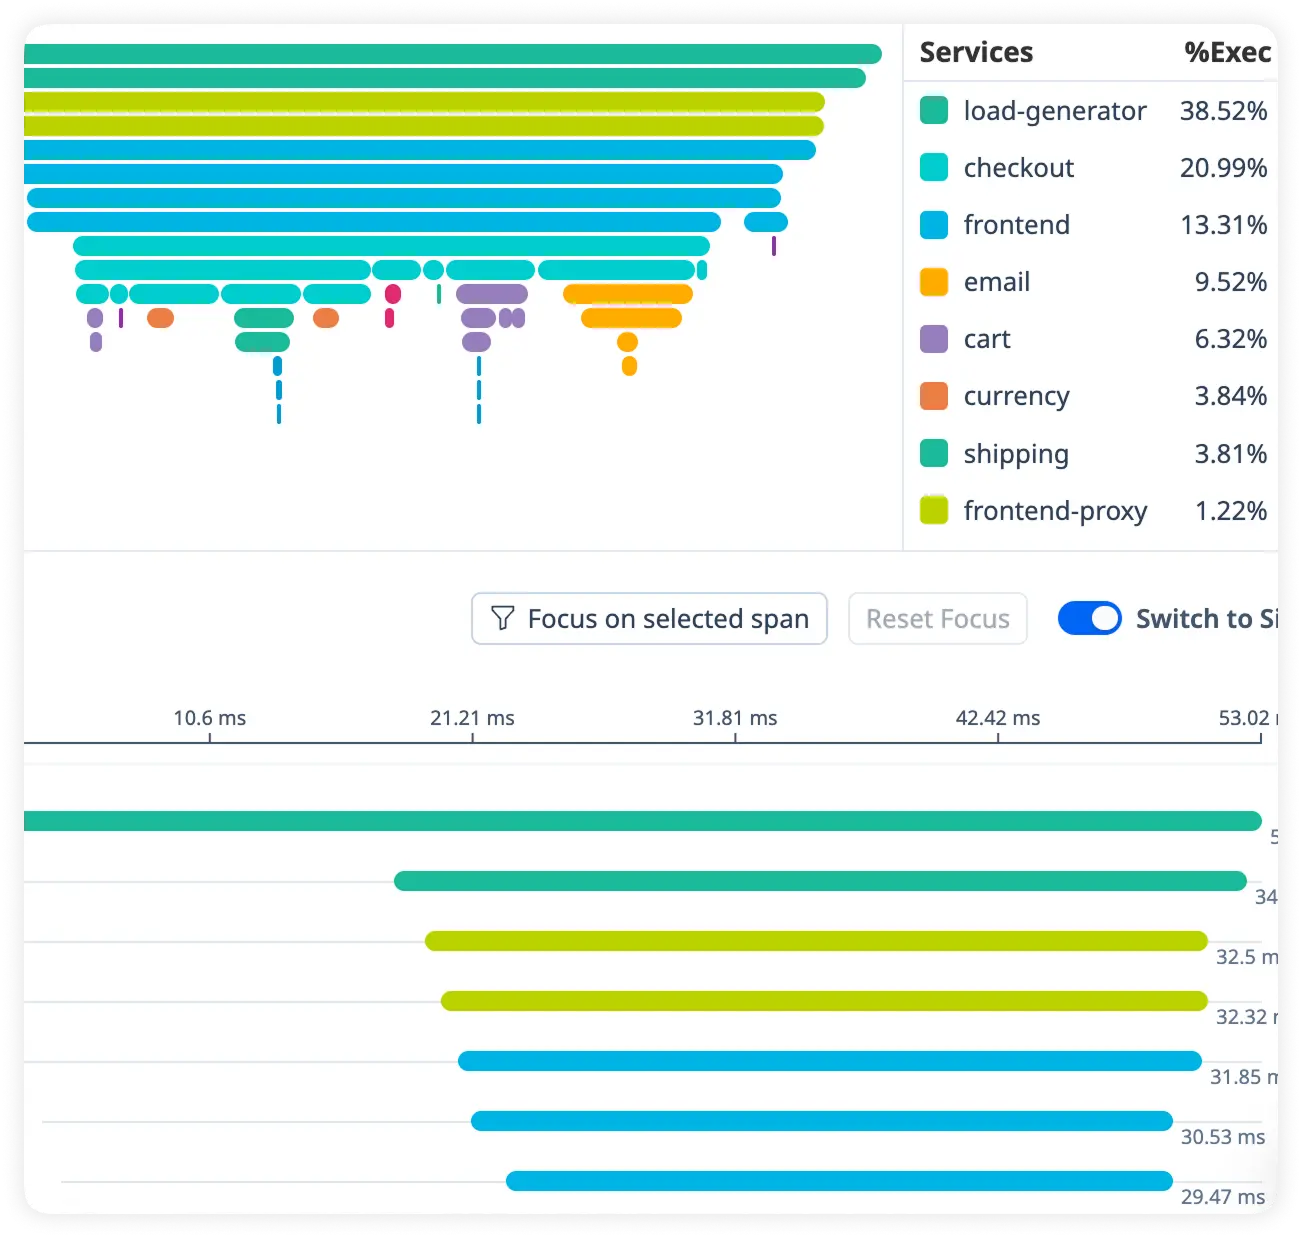
Track Request Duration in Detail
Measure how long each request takes across handlers, services, and dependencies. Uncover latency trends affecting user experience.
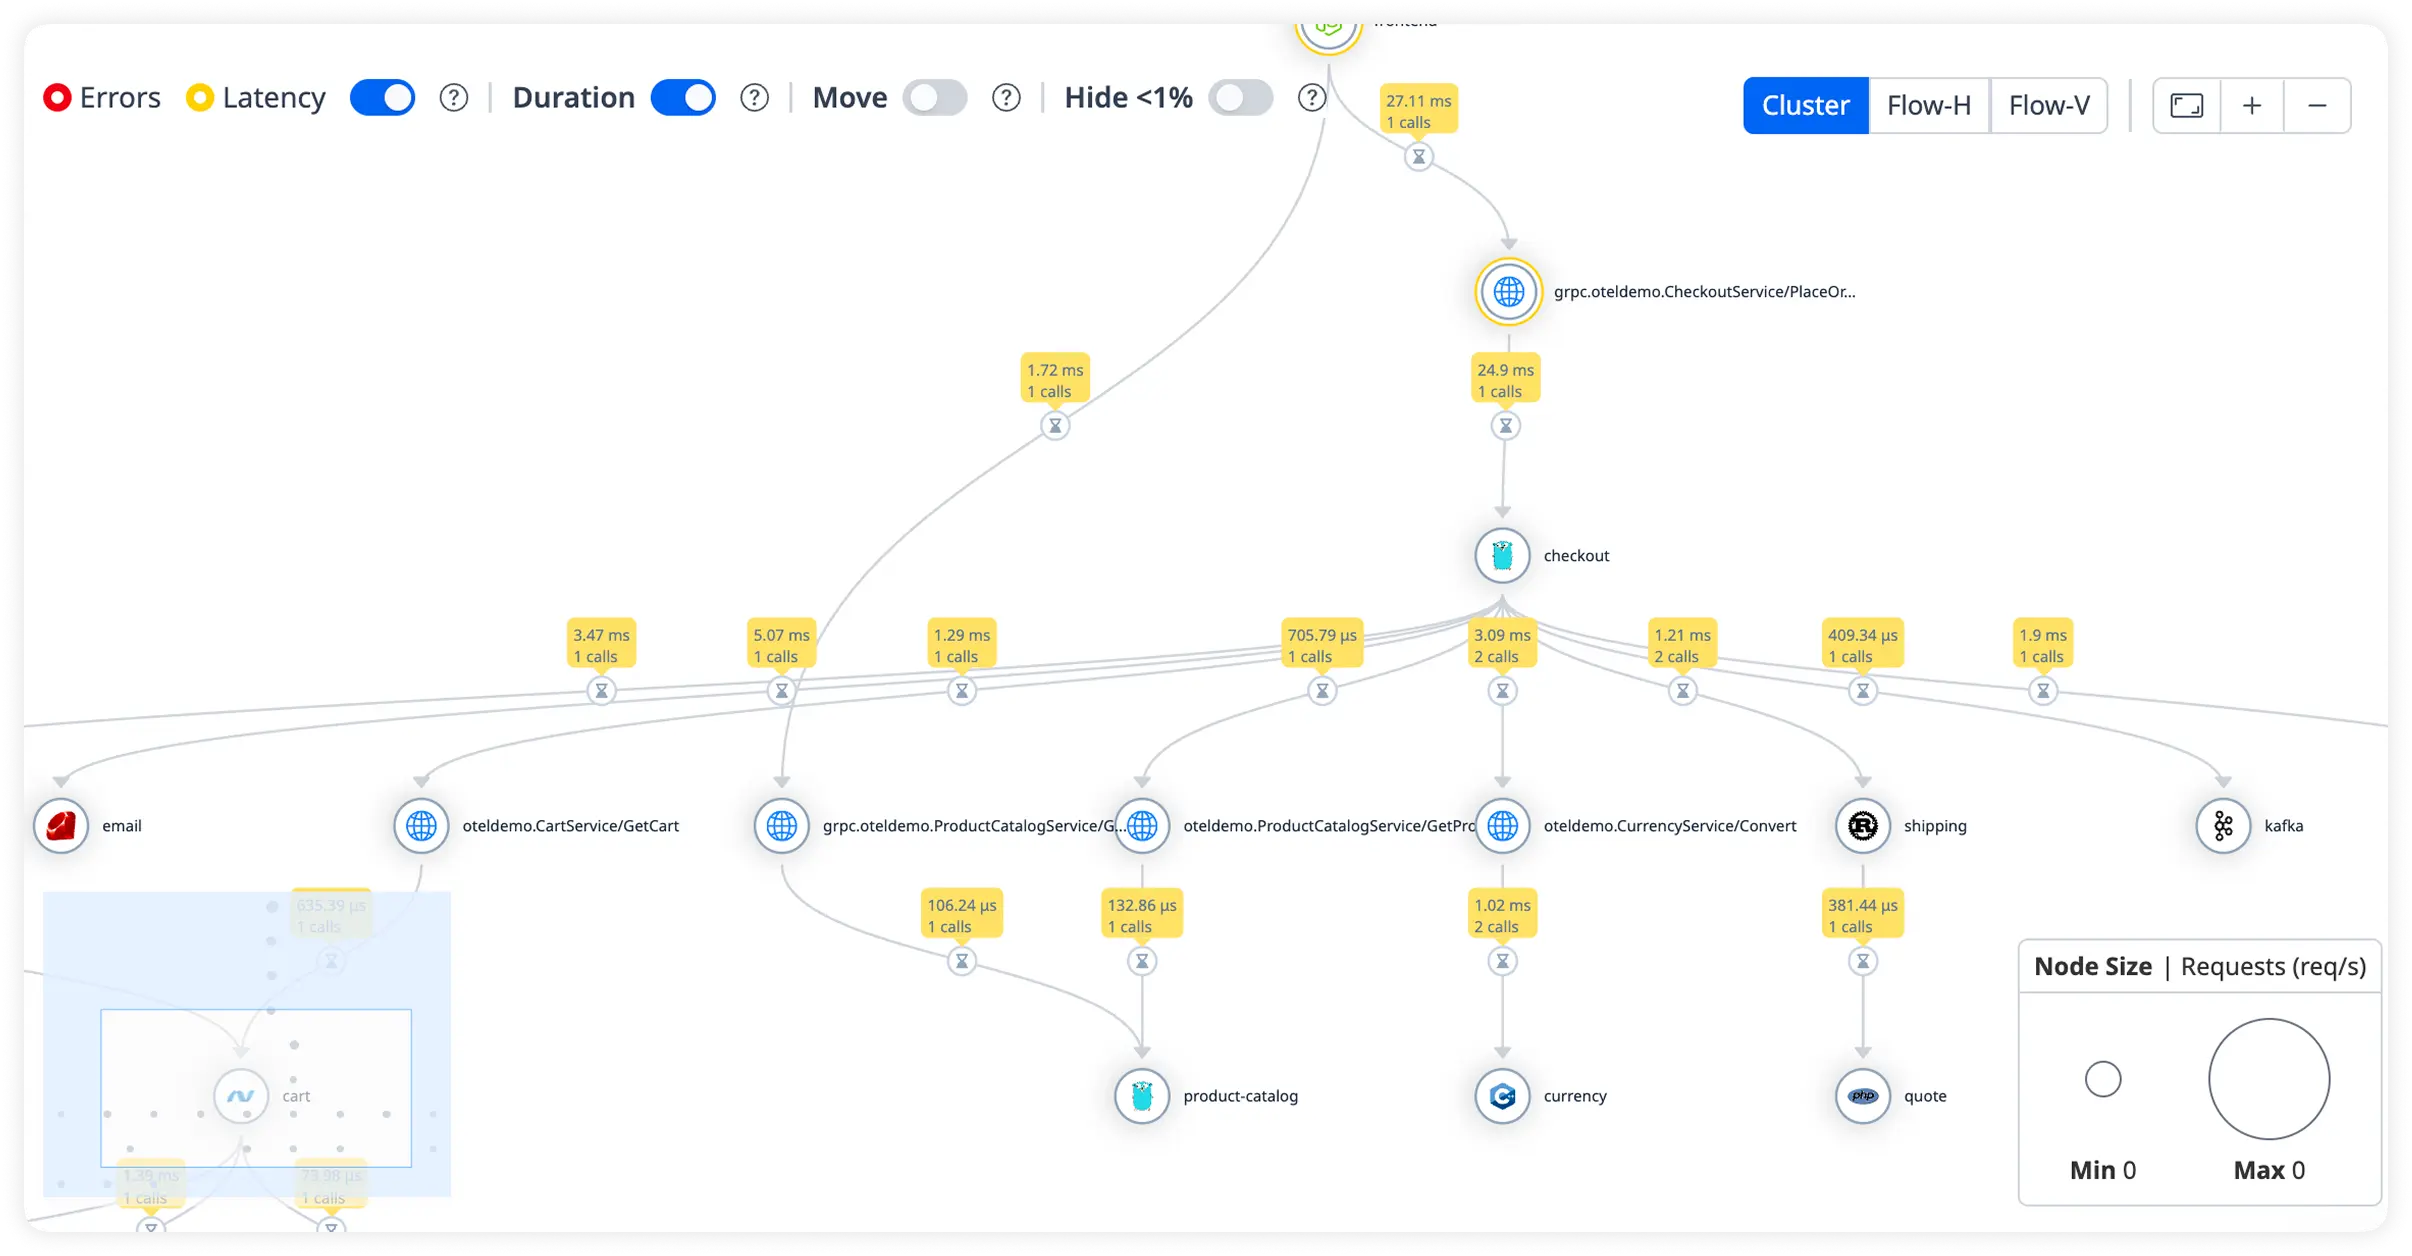
Understand Production Traffic Patterns
Visualize live production traffic volume, peak usage periods, and request distribution. Make data-driven decisions for scaling and optimization.
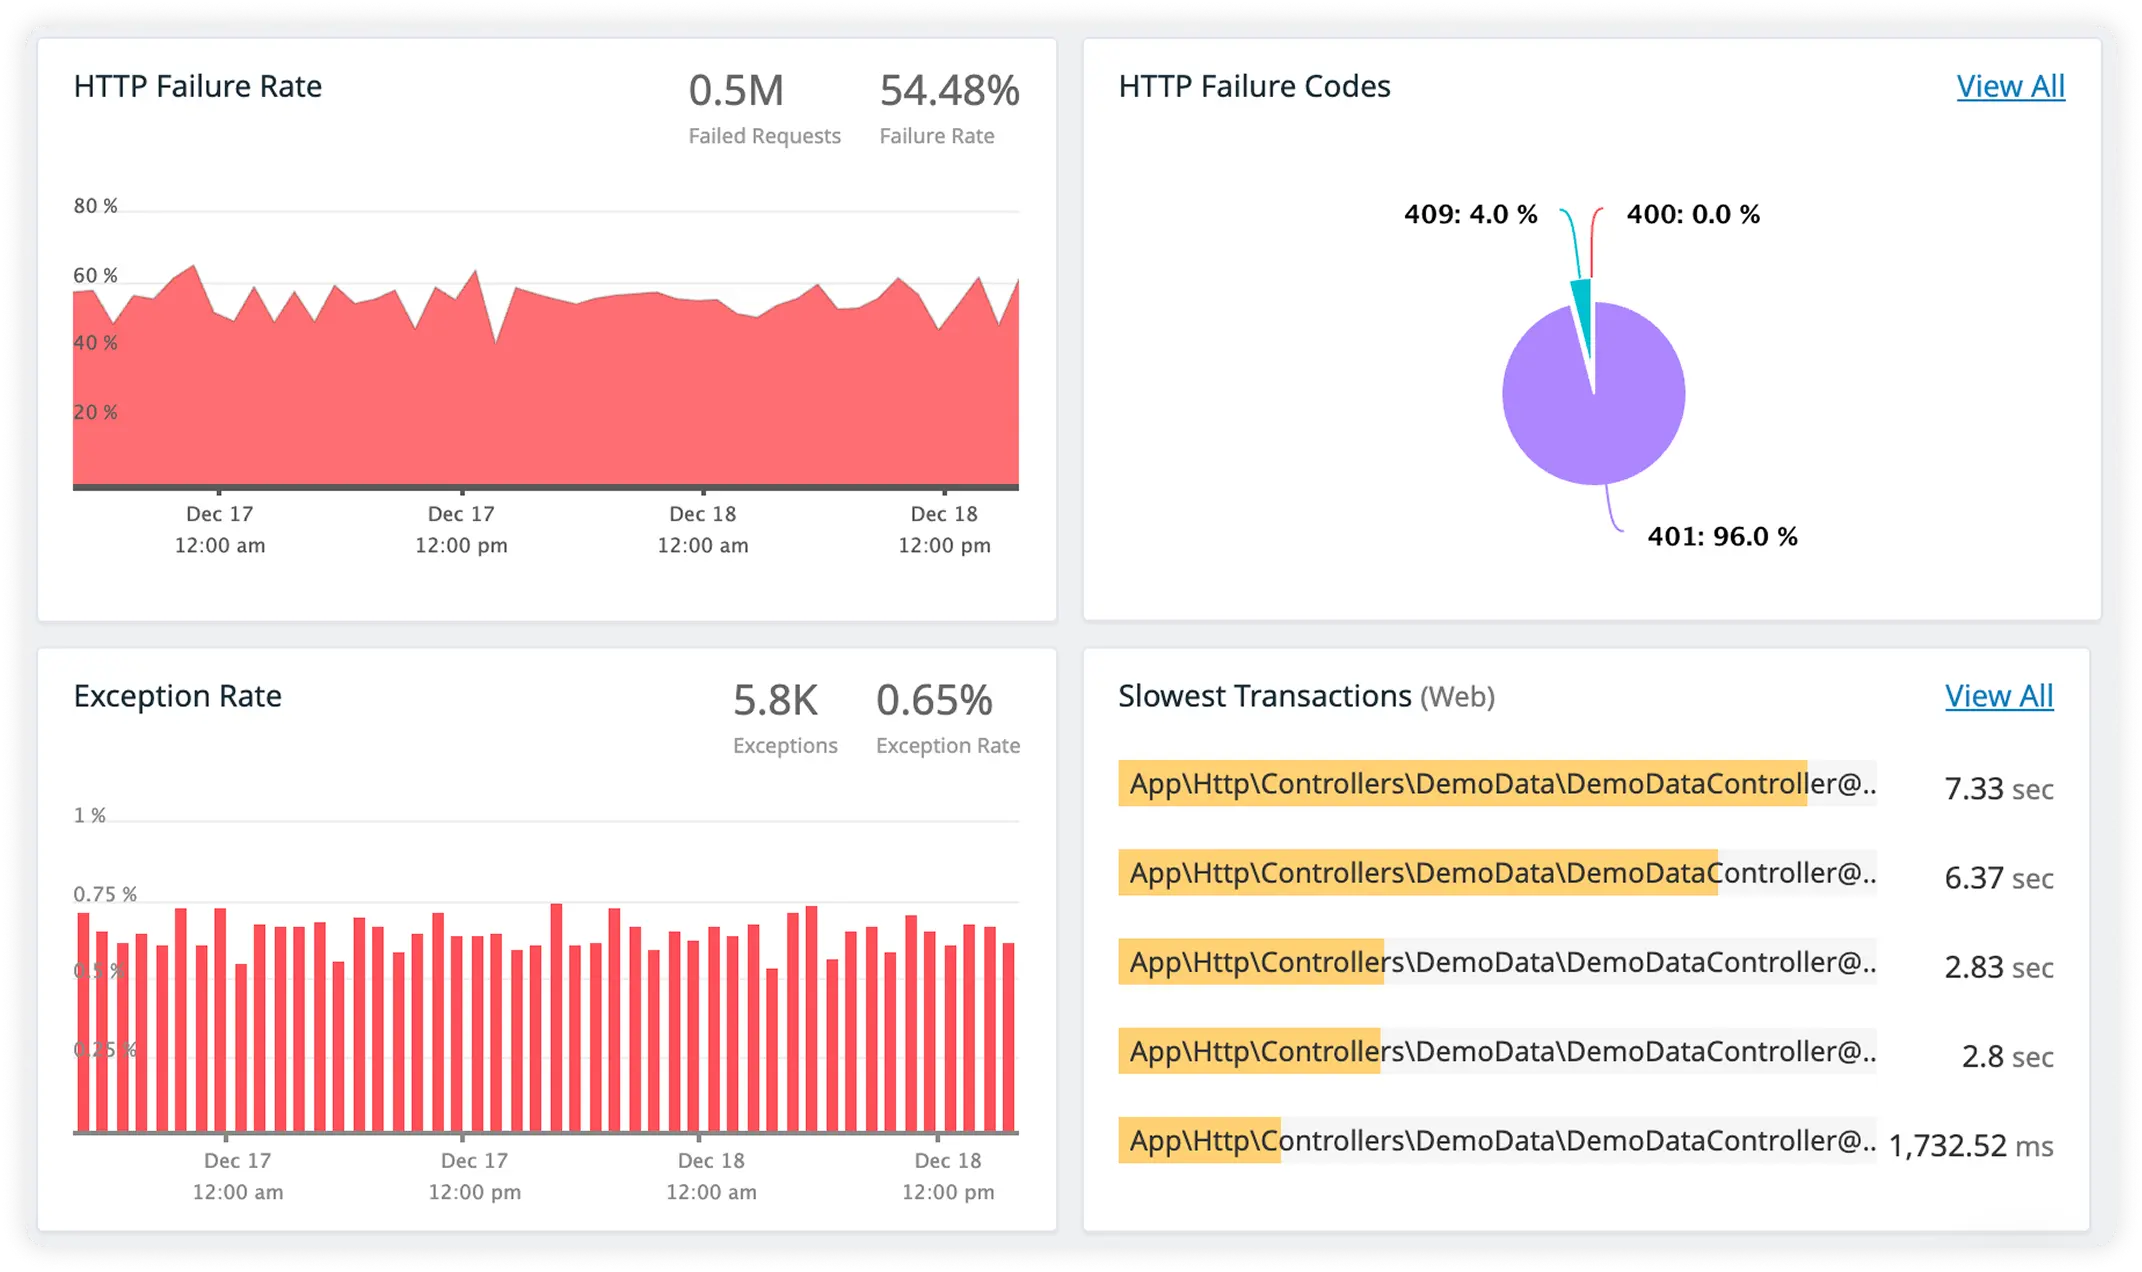
Compare Route Performance Using Real Usage
Compare route latency, throughput, and error rates based on real-world usage data. Identify underperforming routes and prioritize improvements effectively.
Why Teams Choose Atatus for Runtime-Aware hapi Observability?
Engineering teams running hapi choose Atatus when understanding lifecycle execution matters more than counting requests or averages.
Lifecycle-Aware Execution
Teams reason about request behavior in terms of hapi lifecycle phases instead of flattened request timings.
Extension-Level Clarity
Engineers understand how registered extensions interact, execute, and compound latency during real production traffic.
Async Execution Clarity
Asynchronous delays are exposed in context, allowing engineers to reason about timing instead of guessing.
Auth Path Confidence
Authentication behavior is evaluated as part of request execution, allowing teams to diagnose auth-related slowdowns without guesswork.
Validation Impact Awareness
Teams identify when validation logic becomes a bottleneck as payload size, schema complexity, or traffic patterns change.
Async Boundary Continuity
Async pre-handlers and handlers are understood as a continuous execution path, not isolated callbacks.
Shared Dependency Insight
Injected services are evaluated in runtime context, helping teams detect blocking behavior and contention under load.
Predictable Scale Behavior
As concurrency grows, lifecycle execution remains explainable instead of degrading into timing anomalies.
Incident-Time Certainty
During failures, teams rely on execution reality rather than reconstructing lifecycle flow from logs.
Unified Observability for Every Engineering Team
Atatus adapts to how engineering teams work across development, operations, and reliability.
Developers
Trace requests, debug errors, and identify performance issues at the code level with clear context.
DevOps
Track deployments, monitor infrastructure impact, and understand how releases affect application stability.
Release Engineer
Measure service health, latency, and error rates to maintain reliability and reduce production risk.