JBoss Performance Monitoring
Get end-to-end visibility into your JBoss performance with application monitoring tools. Gain insightful metrics on performance bottlenecks with Java monitoring to optimize your application.
Why jboss Production Issues Are Hard to Diagnose?
Undetected Cache Fragmentation
Infinispan entries evict prematurely under hot partition skew. Second-level cache misses spike database load untracked. Platform engineers overprovision nodes without hit ratio baselines.
Undertow Connector Blackouts
HTTP/2 streams pile up in acceptor threads during burst concurrency. NIO poller exhaustion drops persistent connections. SREs tune blindly across multi-port configs.
Clustered Domain Drift
JGroups multicast failures desync HA nodes without heartbeat profiles. Singleton deployments split-brain across partitions. Domain controllers mask member health until failover fails.
Silent Deadlock Propagation
MDBs deadlock on XA transactions spanning multiple datasources. Thread dumps bury EJB container locks in noise. Backend engineers kill processes instead of breaking cycles.
Untracked Datasource Leaks
Connection handles accumulate in JBossCLI data sources post-rollback. Max pool capacity hits zero under error storms. Platform teams recycle JNDI lookups without leak paths.
JMS Queue Backlogs
HornetQ persistence lags under high-volume producers without depth metrics. Message redelivery storms exhaust worker pools. SREs purge queues blind to consumer starvation.
Domain Controller Blindspots
Management realms lose audit trails across federated domains. CLI operations timeout without operation latency traces. Platform leads debug auth failures through console noise.
Immediate Runtime Telemetry
Connector metrics and thread states surface within seconds of agent attach. SREs correlate queue depth with JVM pauses instantly. Platform dashboards unify multi-instance health views.
Complete Performance Visibility for
JBoss Applications
Real-time observability for JBoss environments that helps teams understand request behavior, optimize processing flow, and resolve production issues faster.
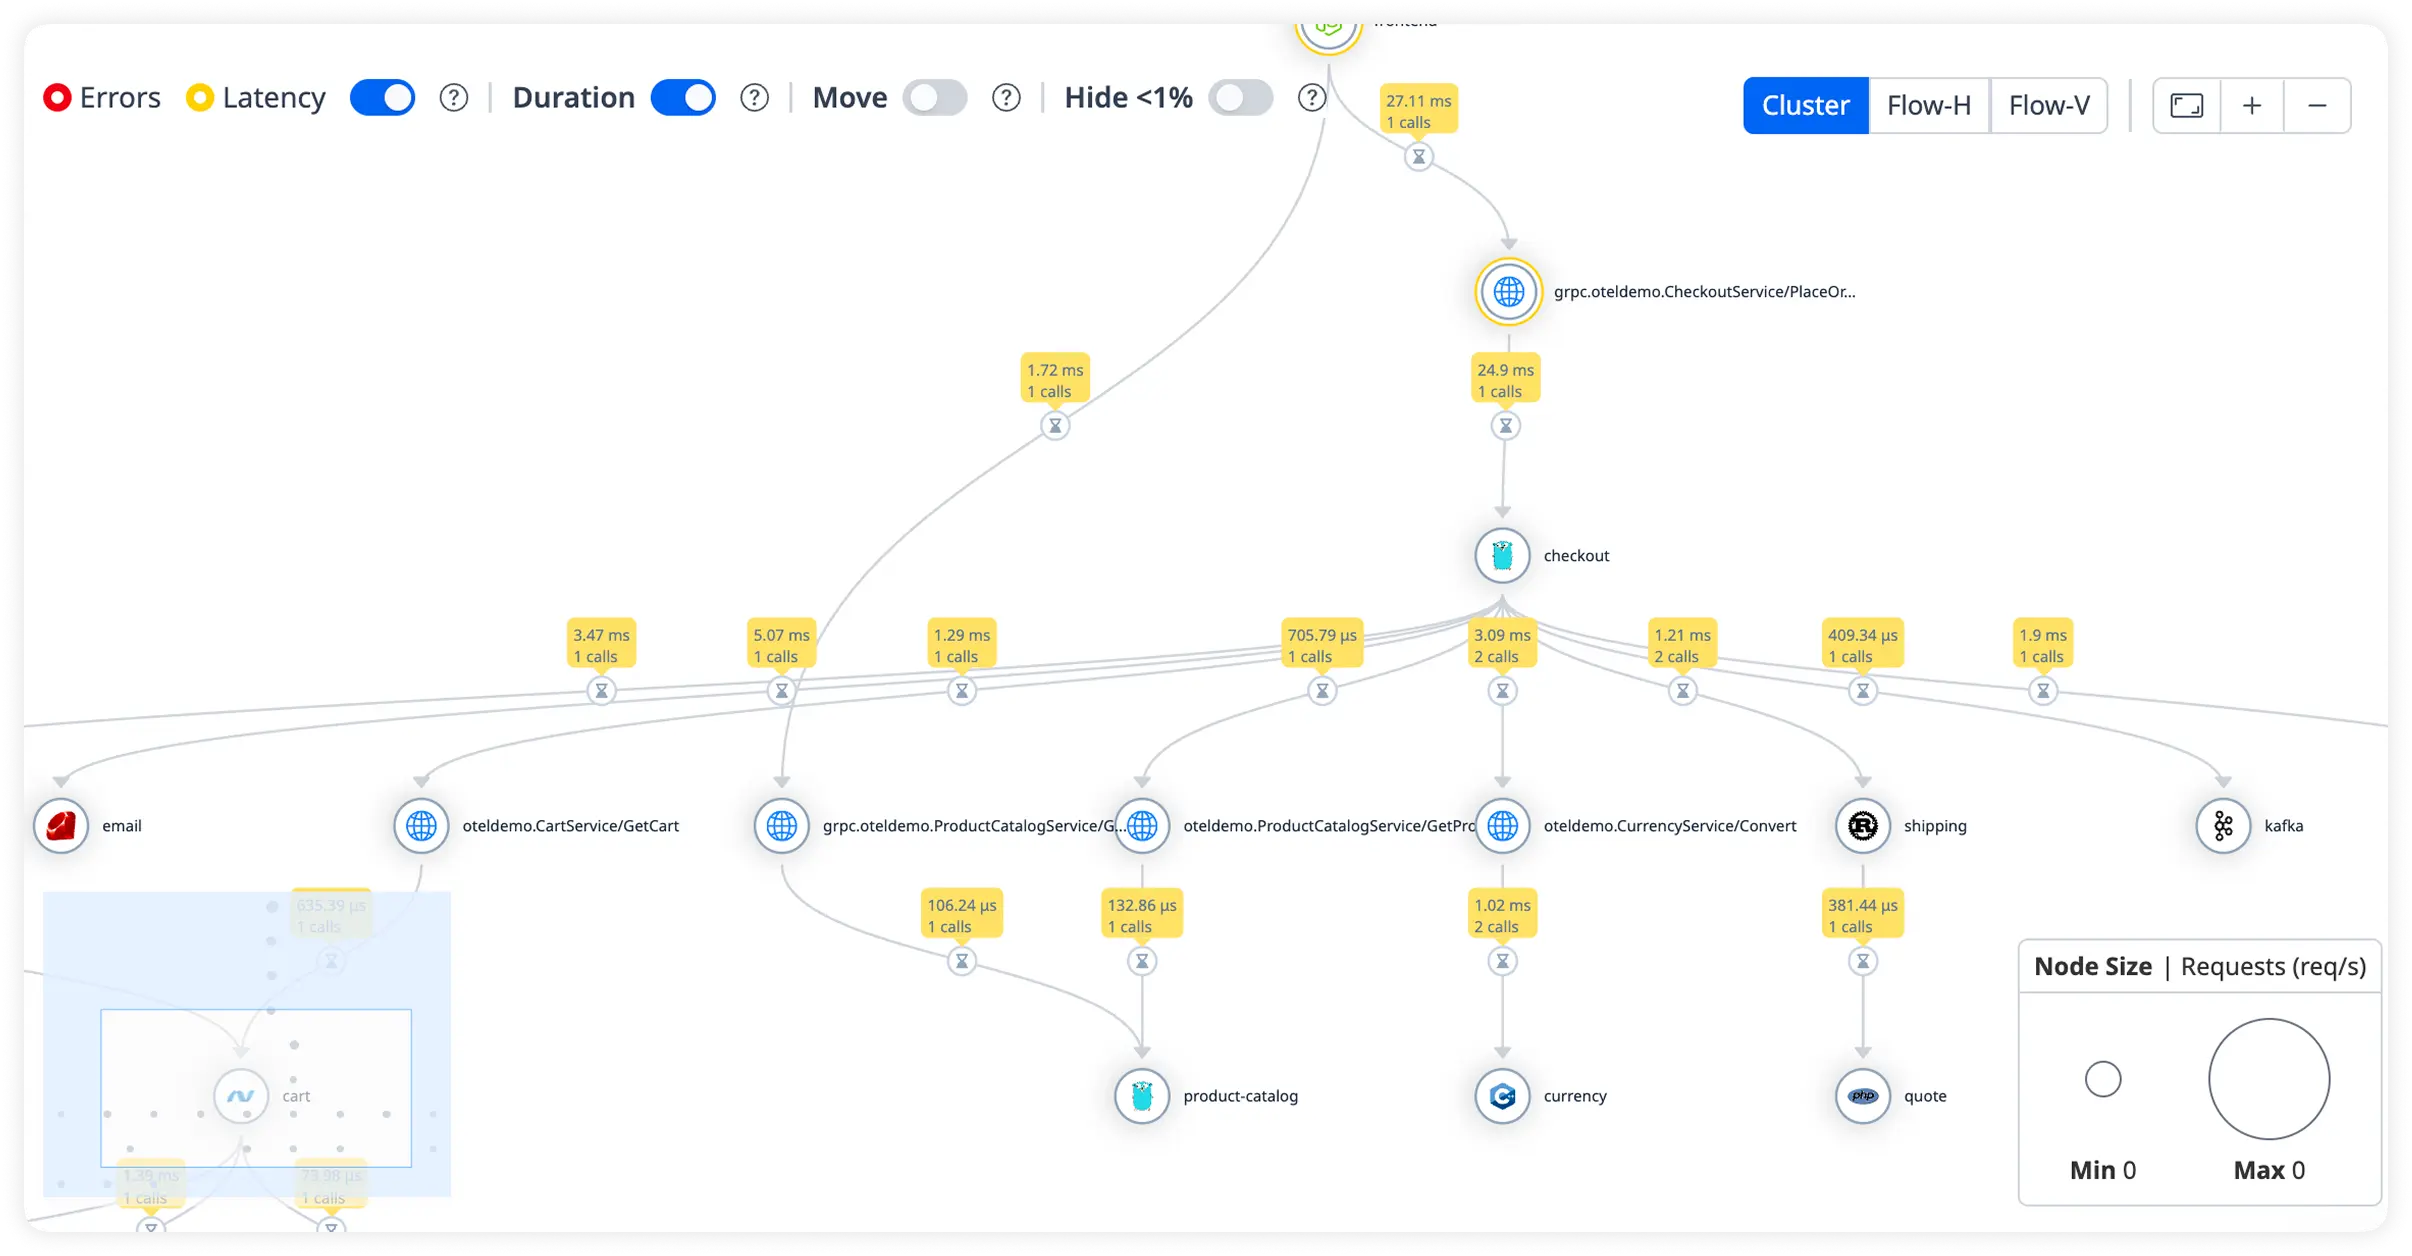
Detailed Request Duration Breakdown
Measure how long each request takes across servlets, handlers, and internal processing layers. Quickly uncover slow execution paths affecting response times.
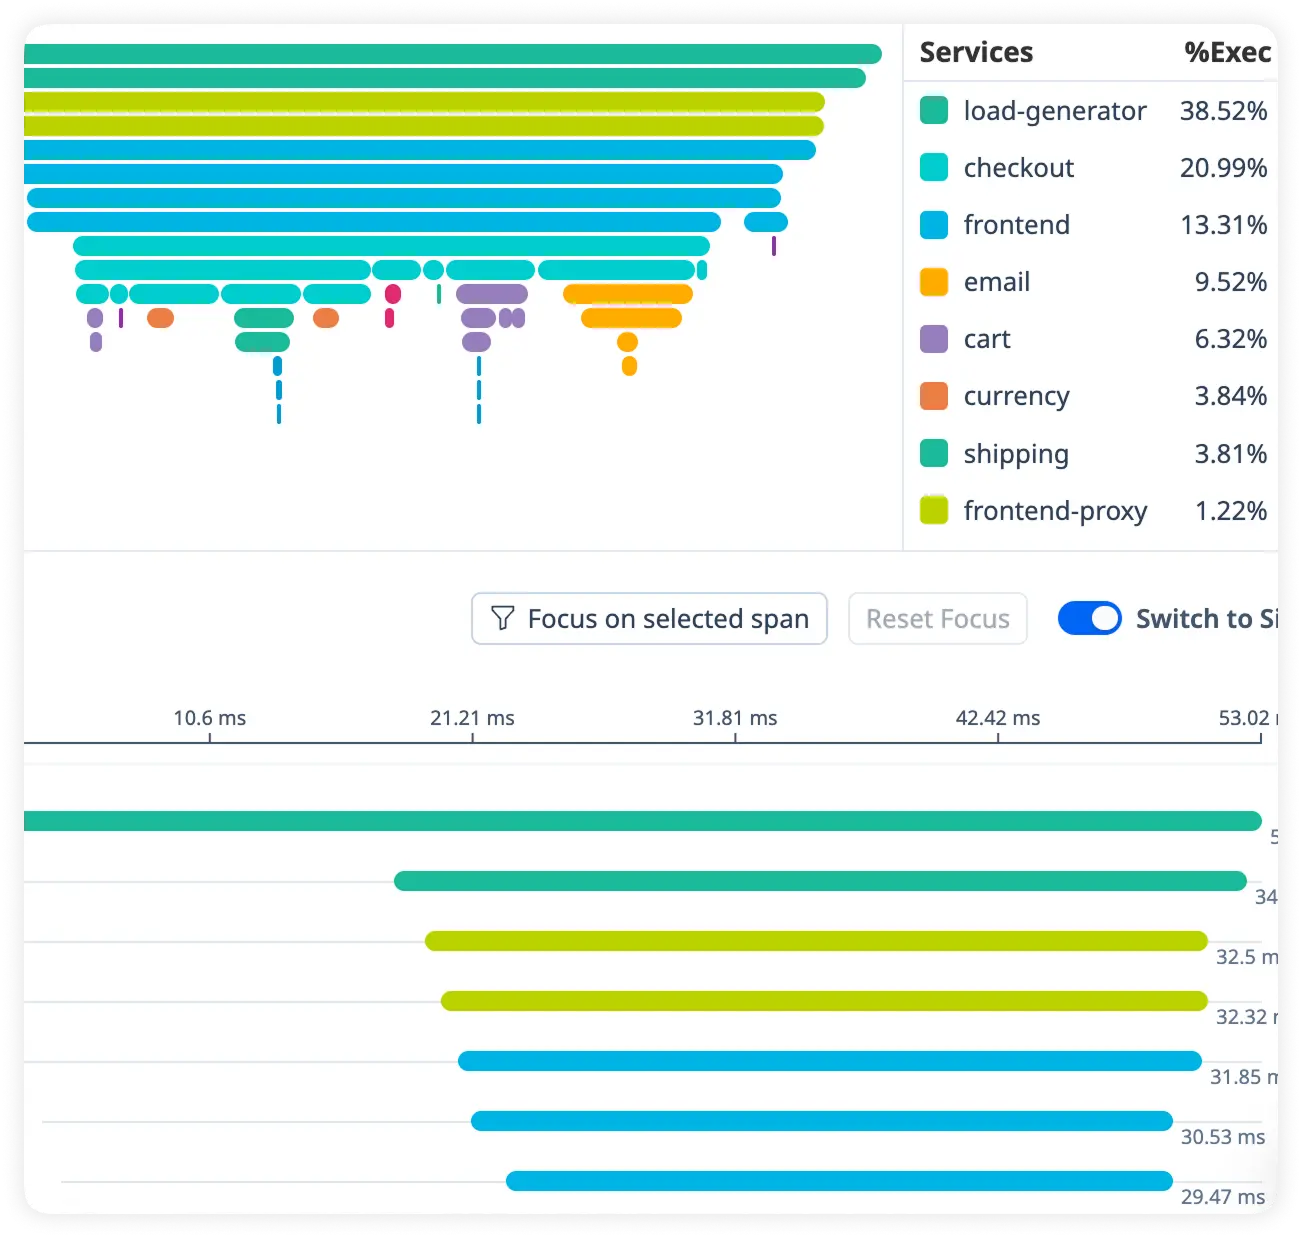
Identify Handler Bottlenecks
Pinpoint performance slowdowns within specific request handlers and processing components. Focus optimization efforts where delays originate.
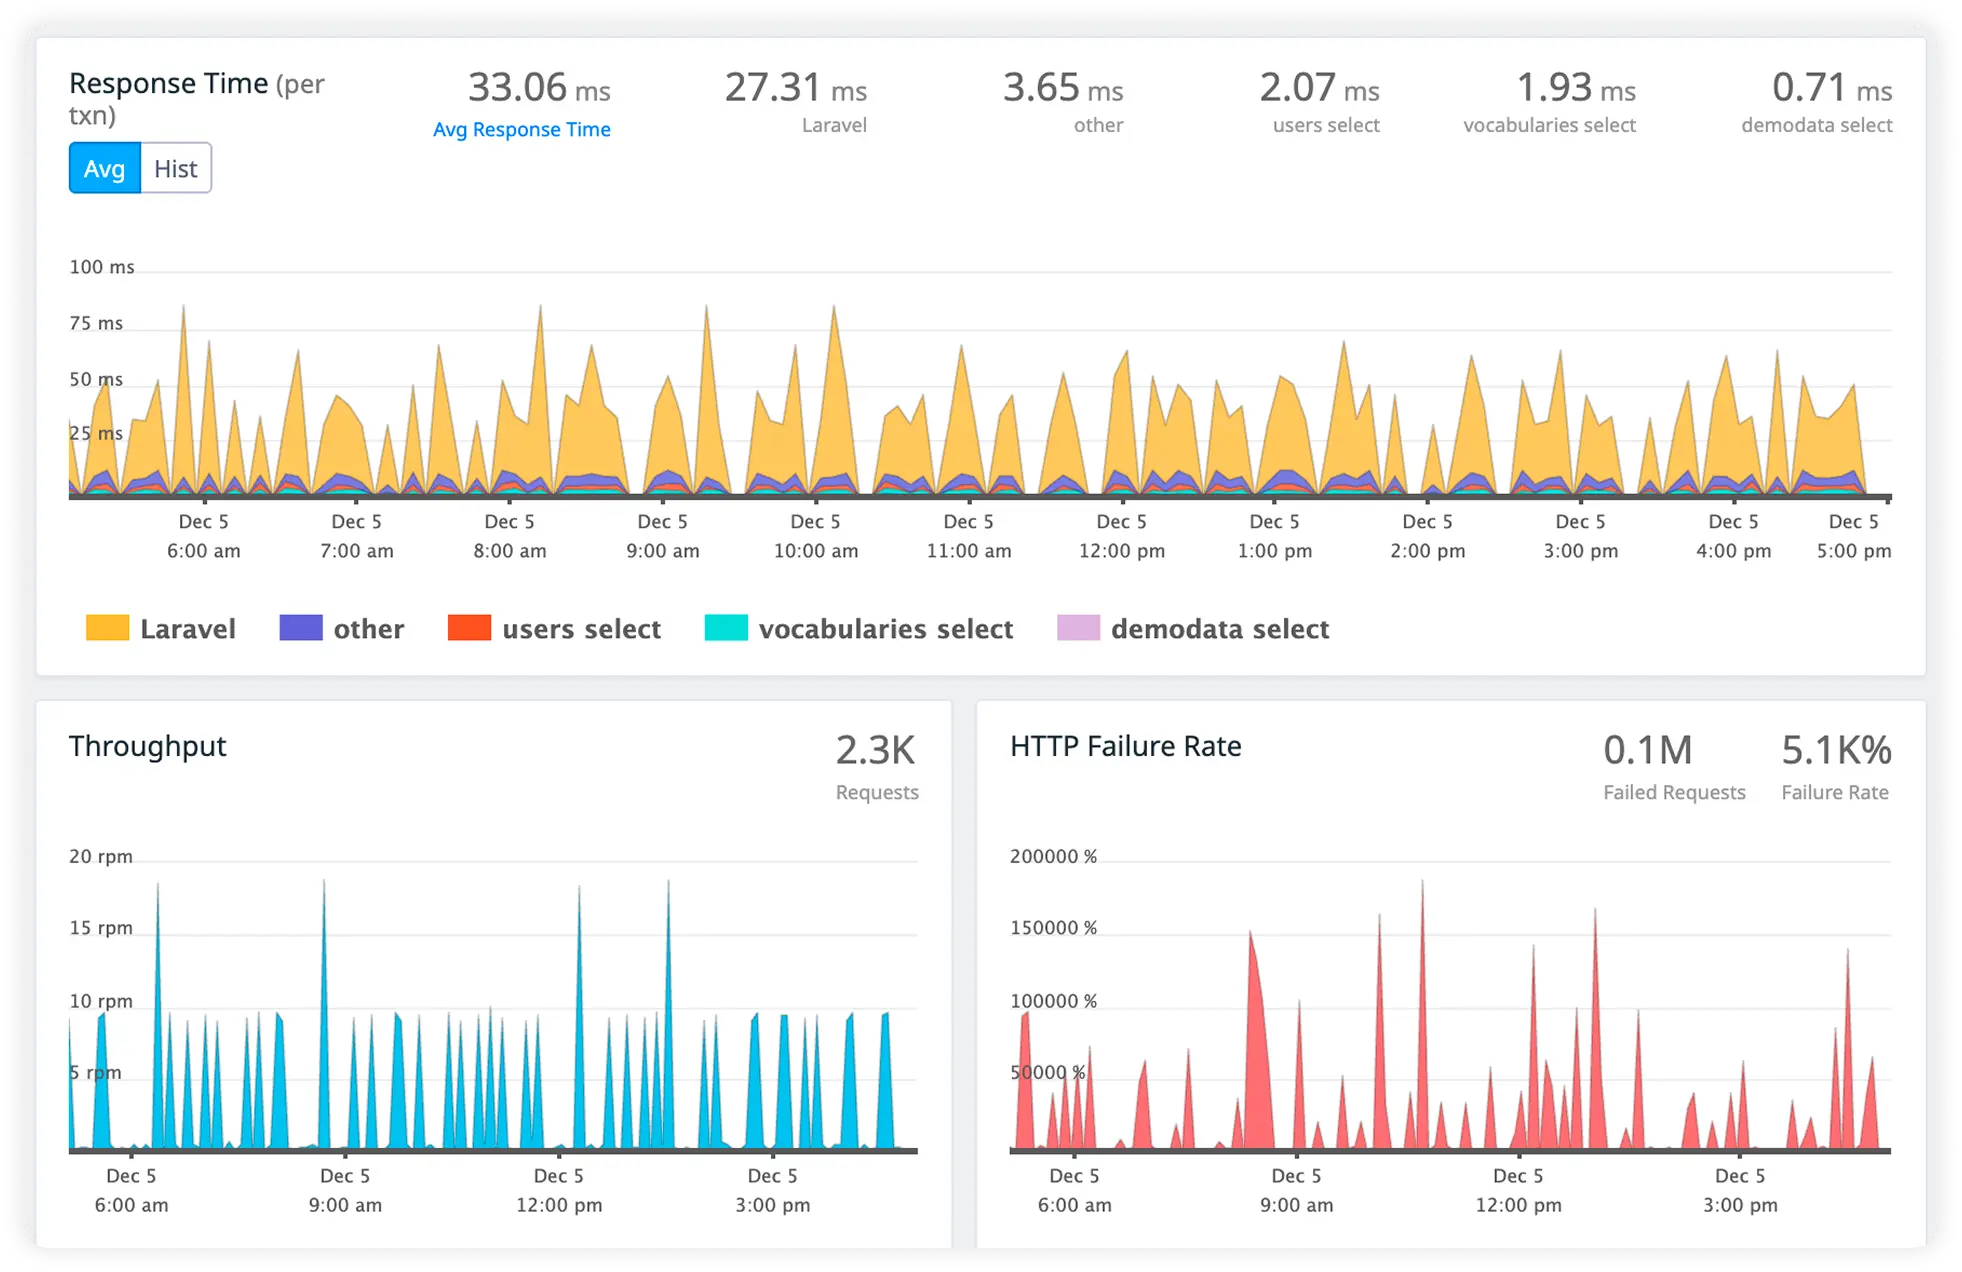
Track Downstream Call Timing
Monitor response times for dependent services, microservices, and external APIs. Detect latency introduced by downstream systems.
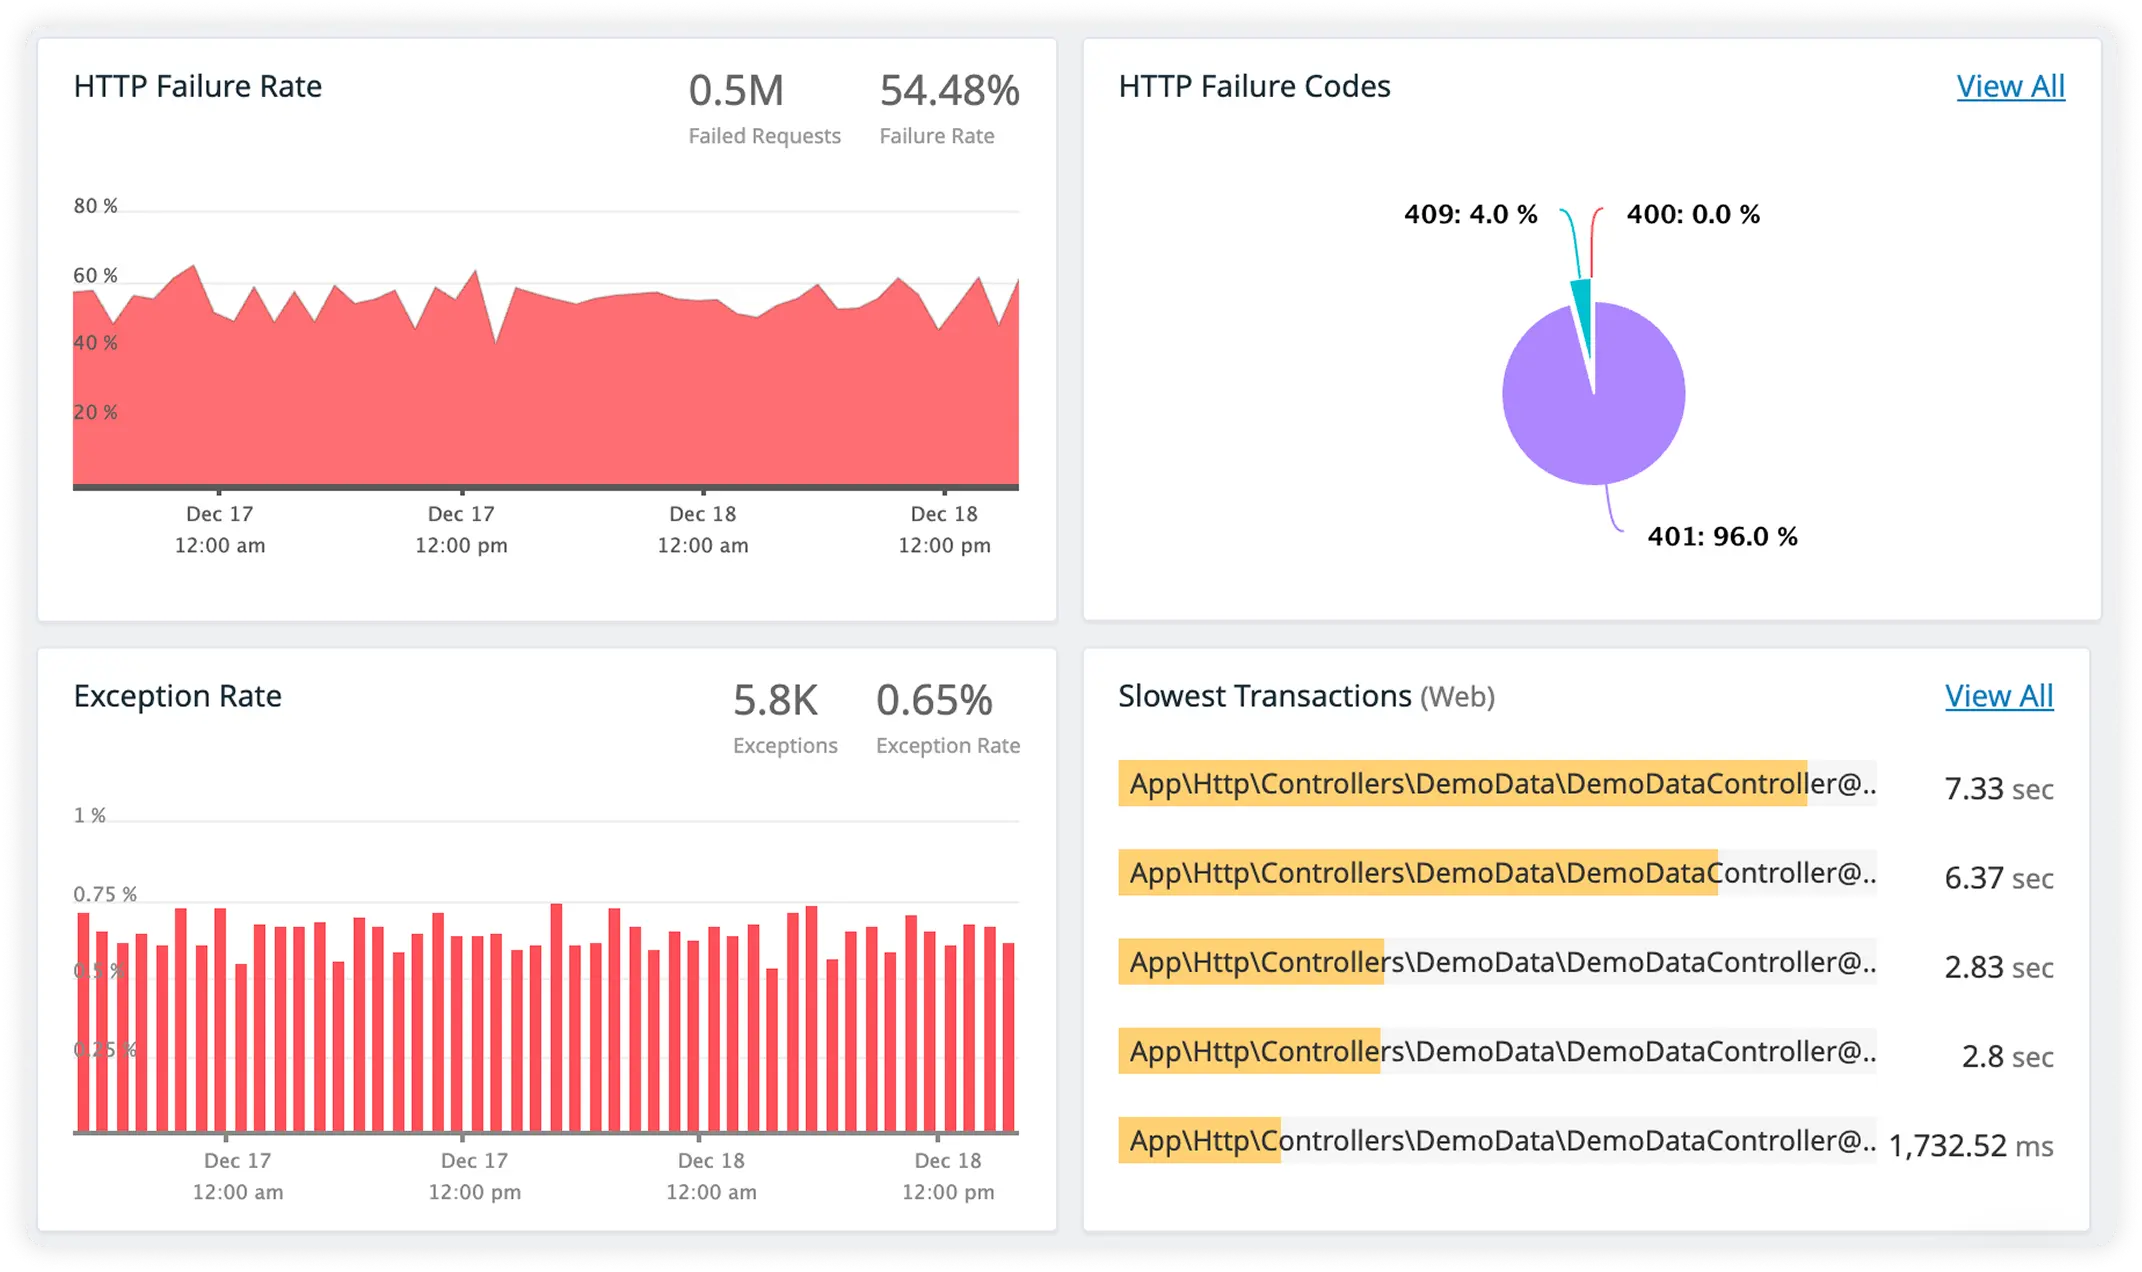
Rich Error Detail with Trace-Linked Logs
Capture detailed error context alongside correlated logs for every request. Debug faster with full visibility across errors, traces, and performance data.
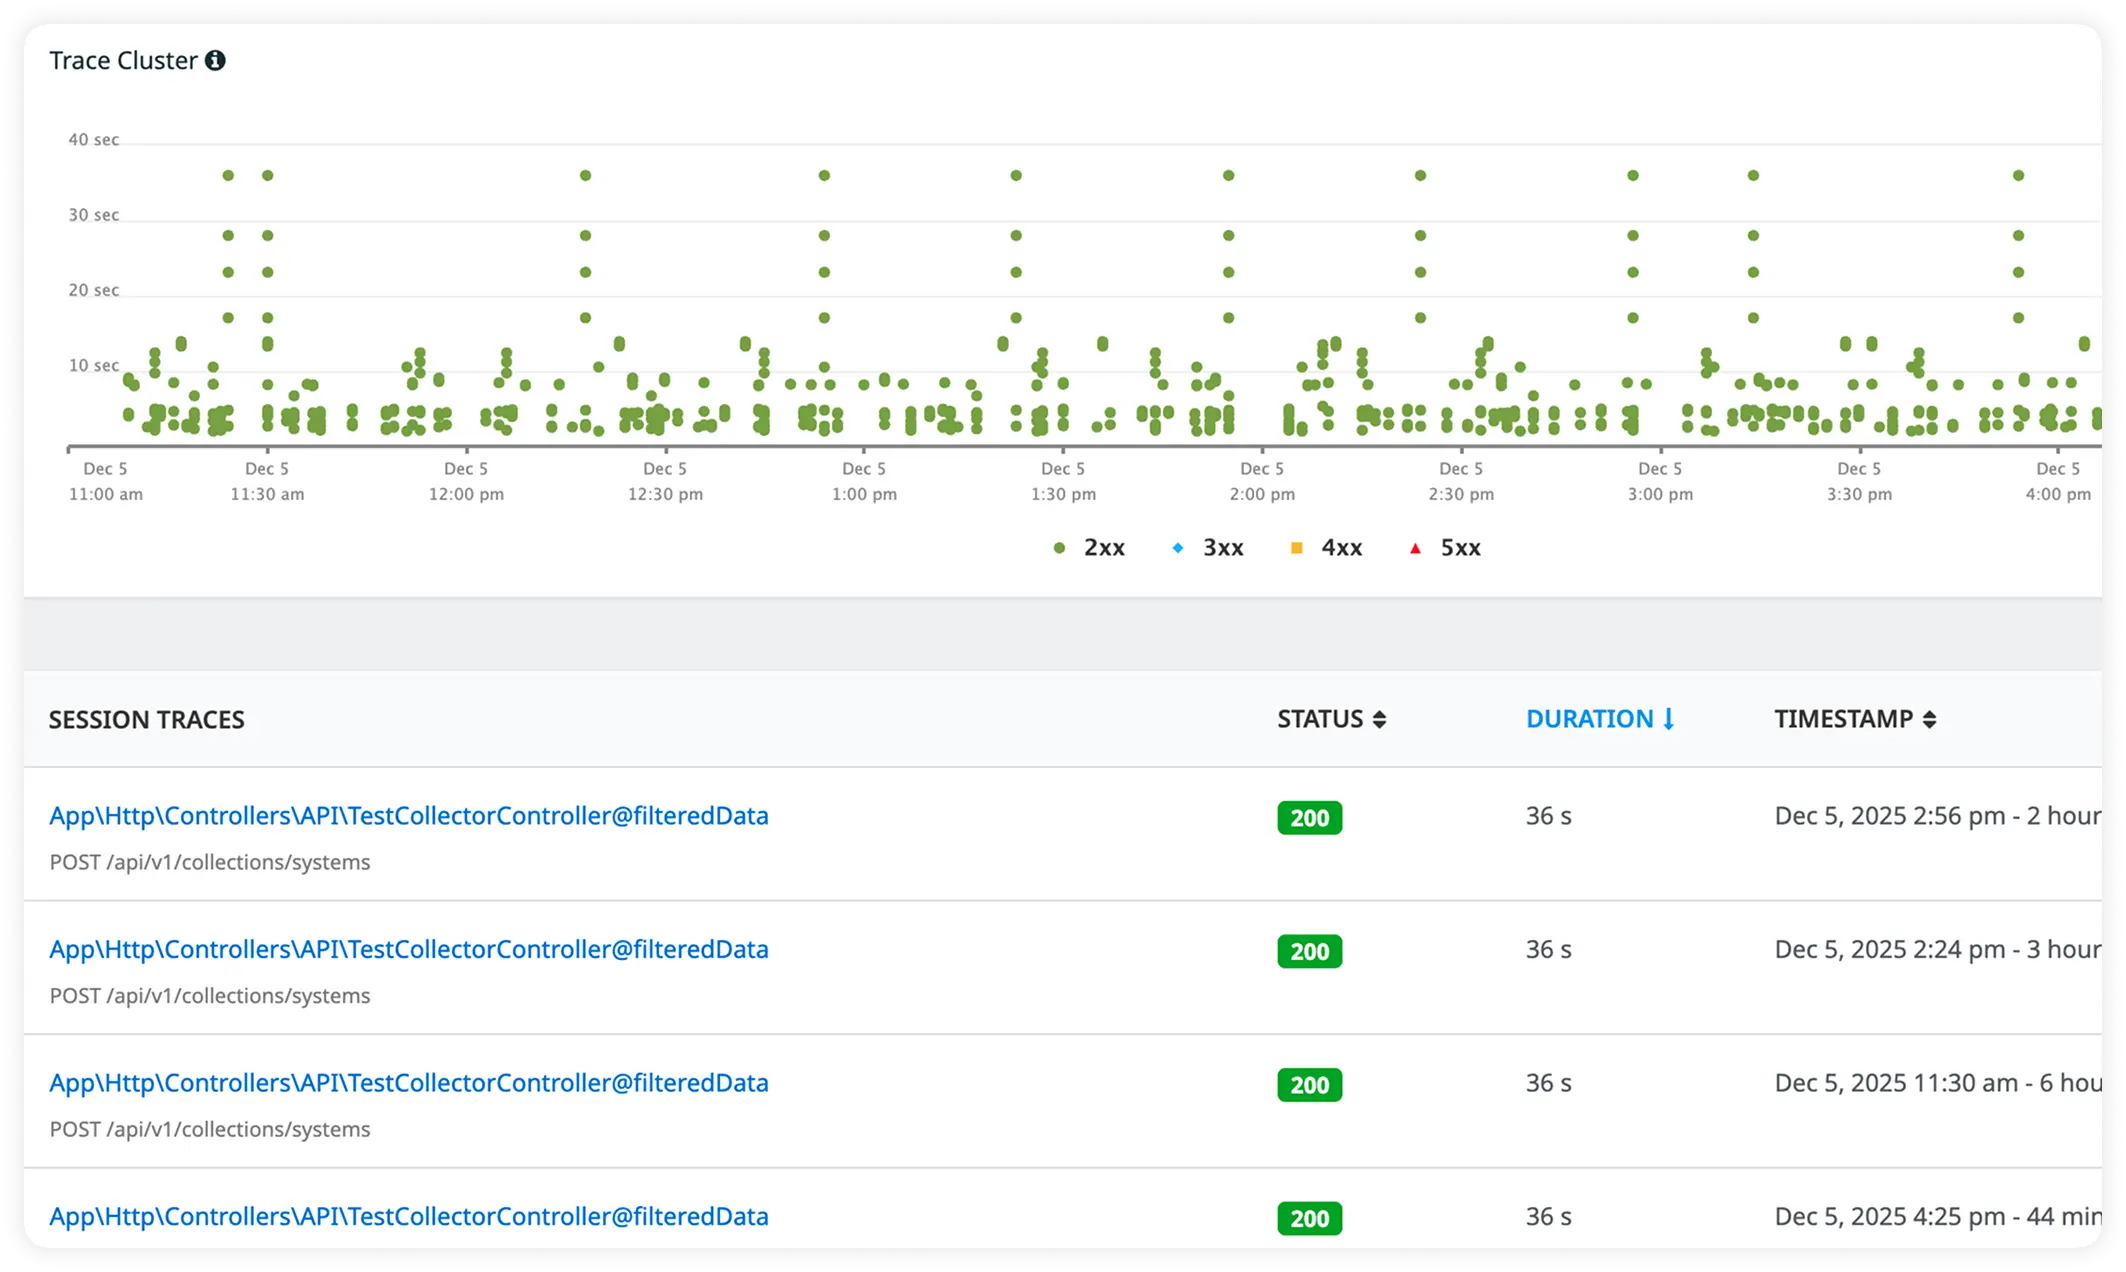
Why Teams Choose Atatus for jboss Observability?
JBoss teams choose Atatus to examine real production request execution directly, instead of inferring behavior from disconnected data or averages.
Domain Instant Visibility
EJB metrics and undertow states surface cluster-wide post-attach. Platform controllers correlate node drifts instantly. HA health unifies across domain partitions.
Zero-Config Domain Coverage
JMX hooks instrument standalone and domain modes without standalone.xml edits. Backend fleets deploy without controller coordination. Full visibility hits prod Day Zero.
EJB-Level Stack Fidelity
Transaction rollbacks map to exact interceptor chains in prod dumps. Developers repro XA failures with container-equivalent traces. Debugging flows match runtime exactly.
Clustered Alert Correlation
Infinispan skew and pool exhaustion pagers trigger at 90% thresholds. SREs get cross-node runbooks per partition. Domain noise collapses to validated risks.
Observed Runtime Behavior
Debugging relies on what actually executed during live traffic, not assumptions about server or application flow.
Production Execution Evidence
Runtime evidence reflects real concurrency, real data, and real load patterns seen only in production.
Comparable Request Review
Failing and successful requests can be examined side by side using observed execution behavior.
Repeatable Issue Inspection
Recurring production issues can be reviewed consistently without unreliable local reproduction attempts.
Production-Driven Actions
Release, rollback, and mitigation actions are taken using observed production execution rather than intuition.
Unified Observability for Every Engineering Team
Atatus adapts to how engineering teams work across development, operations, and reliability.
Developers
Trace requests, debug errors, and identify performance issues at the code level with clear context.
DevOps
Track deployments, monitor infrastructure impact, and understand how releases affect application stability.
Release Engineer
Measure service health, latency, and error rates to maintain reliability and reduce production risk.