Magento Performance Monitoring
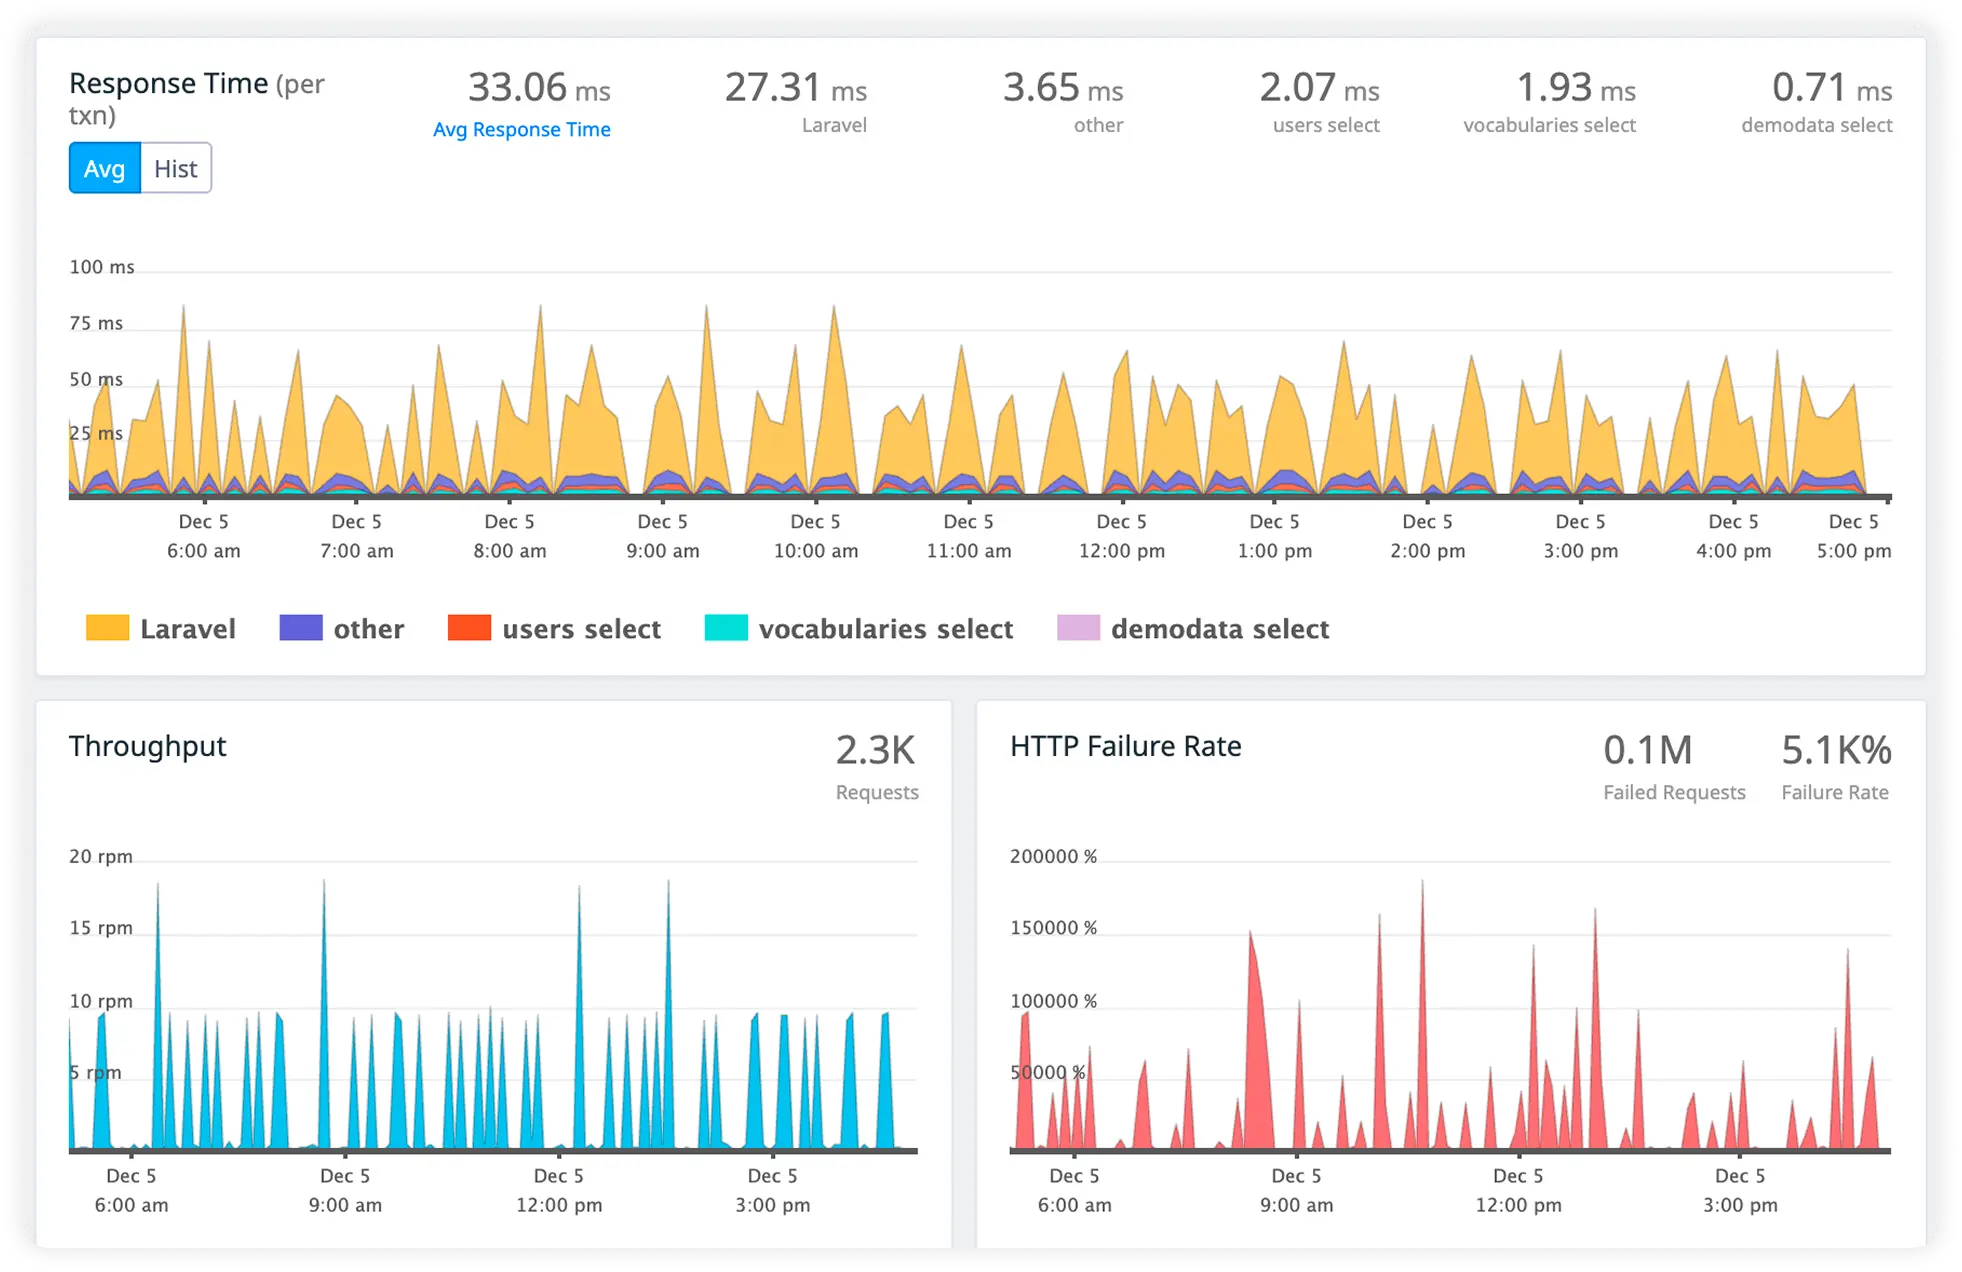
Get end-to-end visibility into your Magento performance with application monitoring tools. Gain insightful metrics on performance bottlenecks with PHP monitoring to optimize your application.
Why Magento Production Issues Are Hard to Isolate?
Request Flow Explosion
A single Magento request fans out across controllers, blocks, plugins, observers, and helpers. Under production load, teams cannot reconstruct which execution path actually dominated runtime.
Plugin Interception Opacity
Plugins wrap core and custom logic dynamically. Execution order and cumulative cost become invisible once multiple plugins intercept the same method.
Dependency Resolution Overhead
Magento’s dependency injection container resolves large object graphs at runtime. Under load, resolution cost increases without clear attribution.
Checkout Execution Drift
Checkout flows span validation, pricing, inventory, and external services. Failures emerge mid-flow, but execution context fragments before completion.
Indexing Side Pressure
Background indexing and reindex triggers overlap with live traffic. Performance degradation appears unrelated to user requests, masking the true cause.
Cache Invalidation Uncertainty
Cache invalidations propagate unevenly across requests. Teams see inconsistent performance without understanding what execution path bypassed cache.
Cron Execution Interference
Scheduled jobs compete with frontend and admin traffic. Under scale, cron-driven execution alters runtime behavior in non-obvious ways.
Observer Cascade Effects
Observers trigger side effects across unrelated workflows. When latency spikes, engineers struggle to connect the slowdown to the original event trigger.
Complete Performance Visibility for
Magento Applications
Real-time observability for Magento that helps teams optimize shopping experiences, resolve issues faster, and maintain reliable eCommerce performance at scale.
Optimize Checkout Speed
Track every step of the checkout flow to identify latency, errors, and drop-off points. Ensure fast and frictionless purchase experiences for customers.
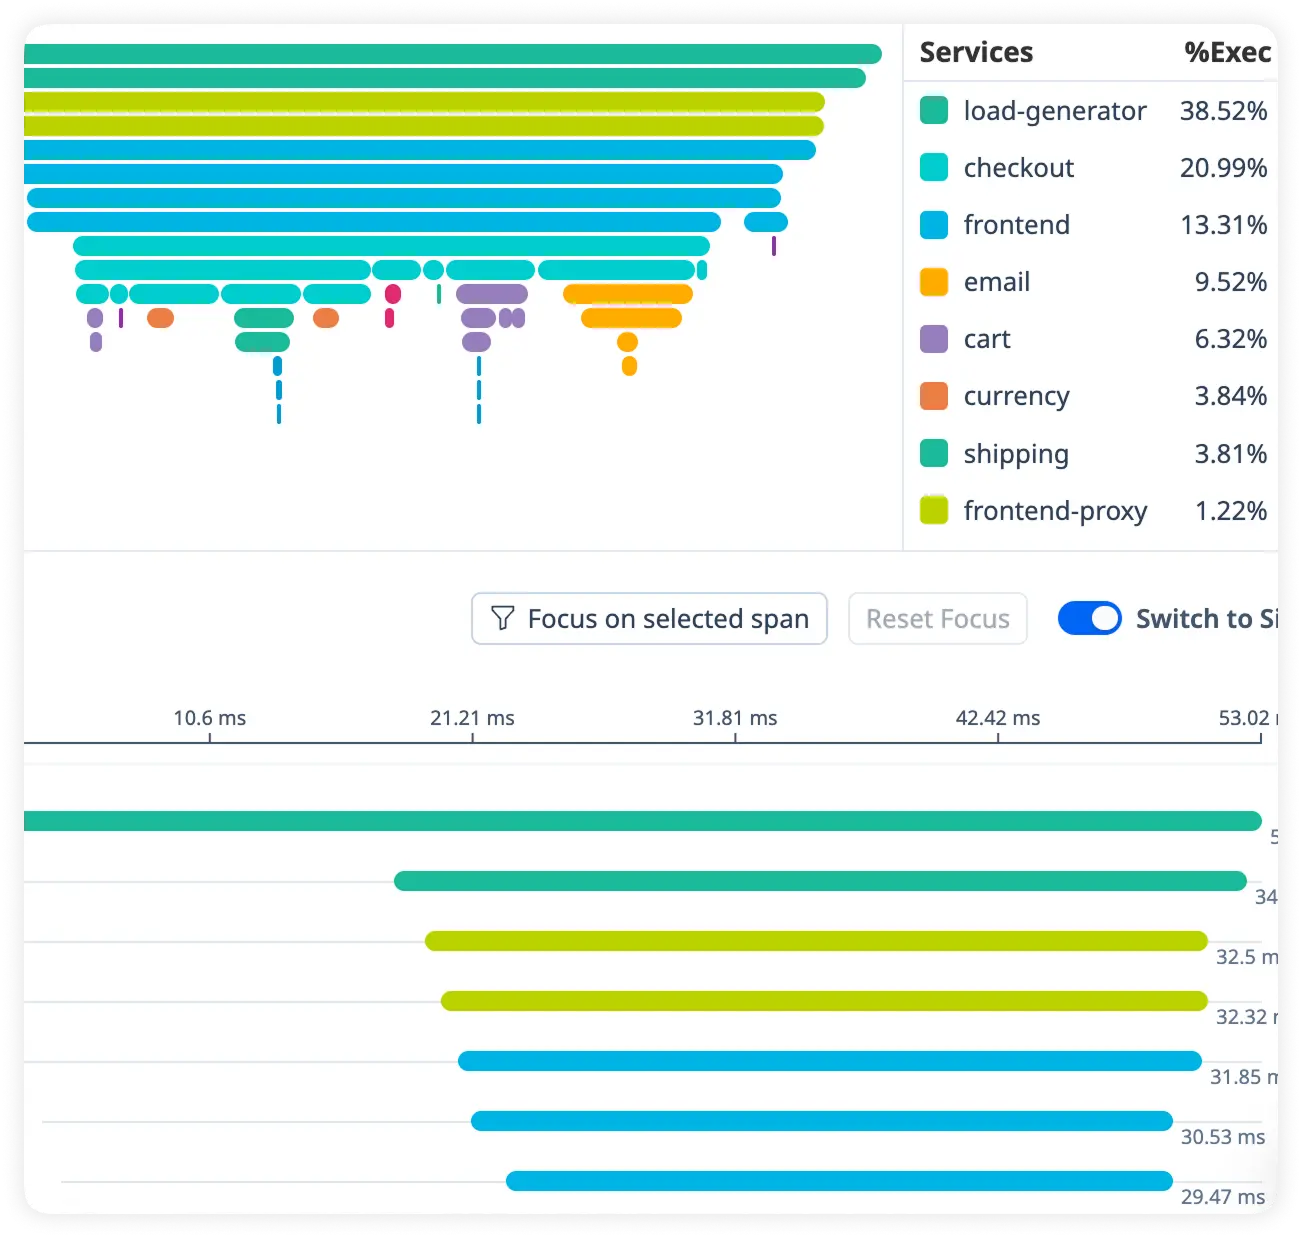
Monitor Real-Time Cart Updates
Measure how quickly cart actions process under live traffic. Detect slowdowns that impact user engagement and conversion rates.
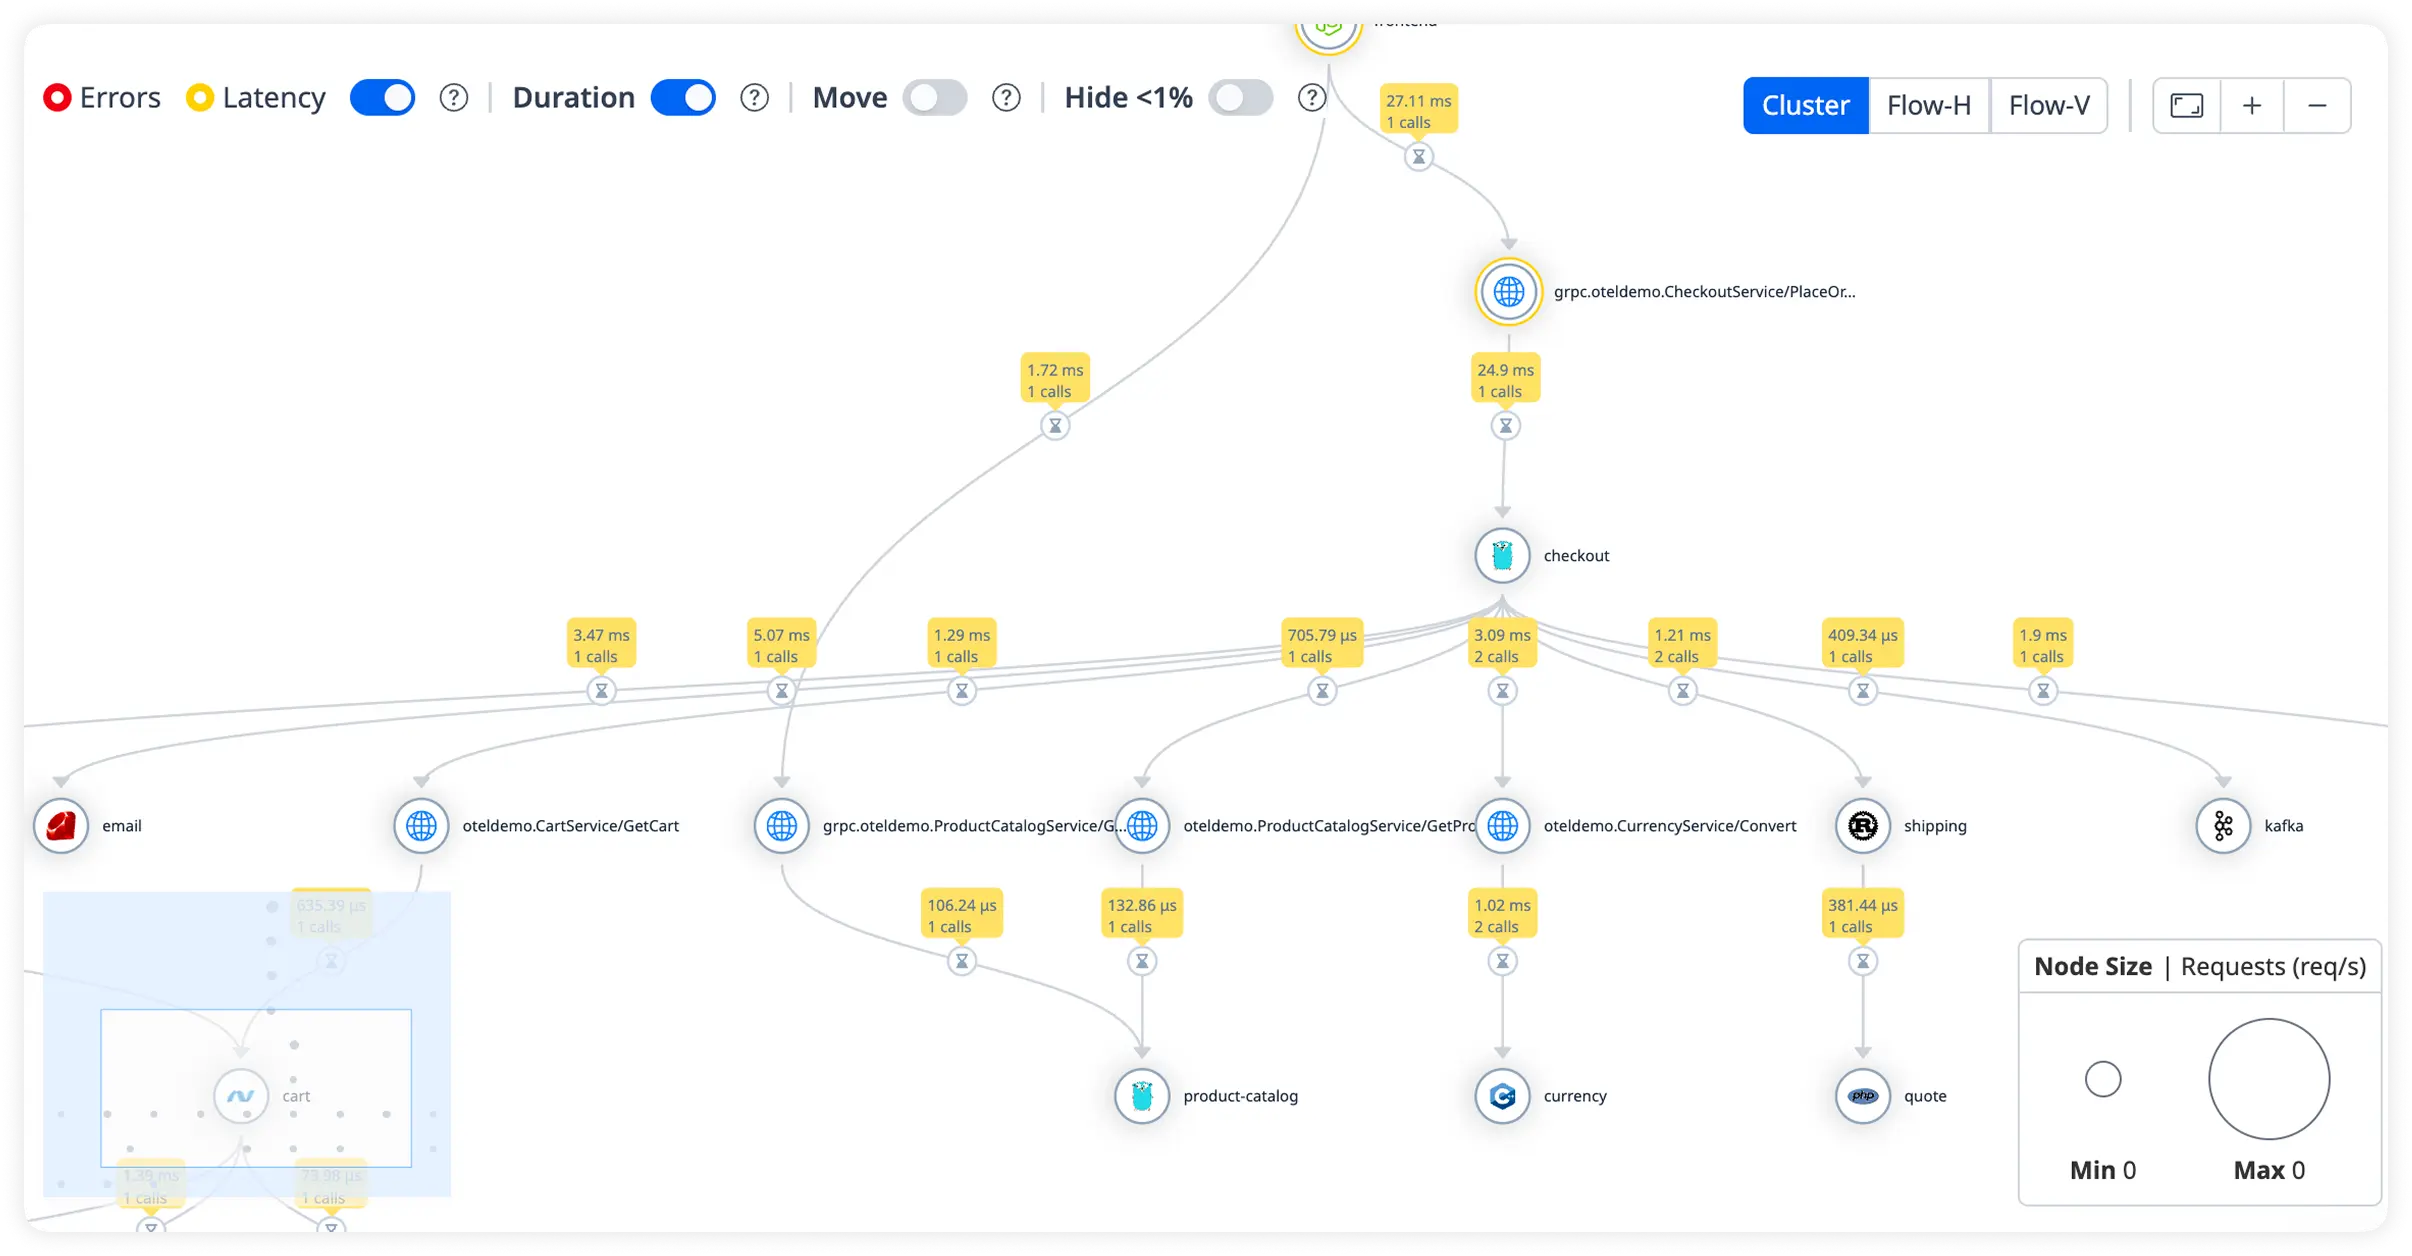
Understand Database Query Impact
Analyze query execution time and database load across your Magento environment. Eliminate inefficient queries that slow storefront performance.
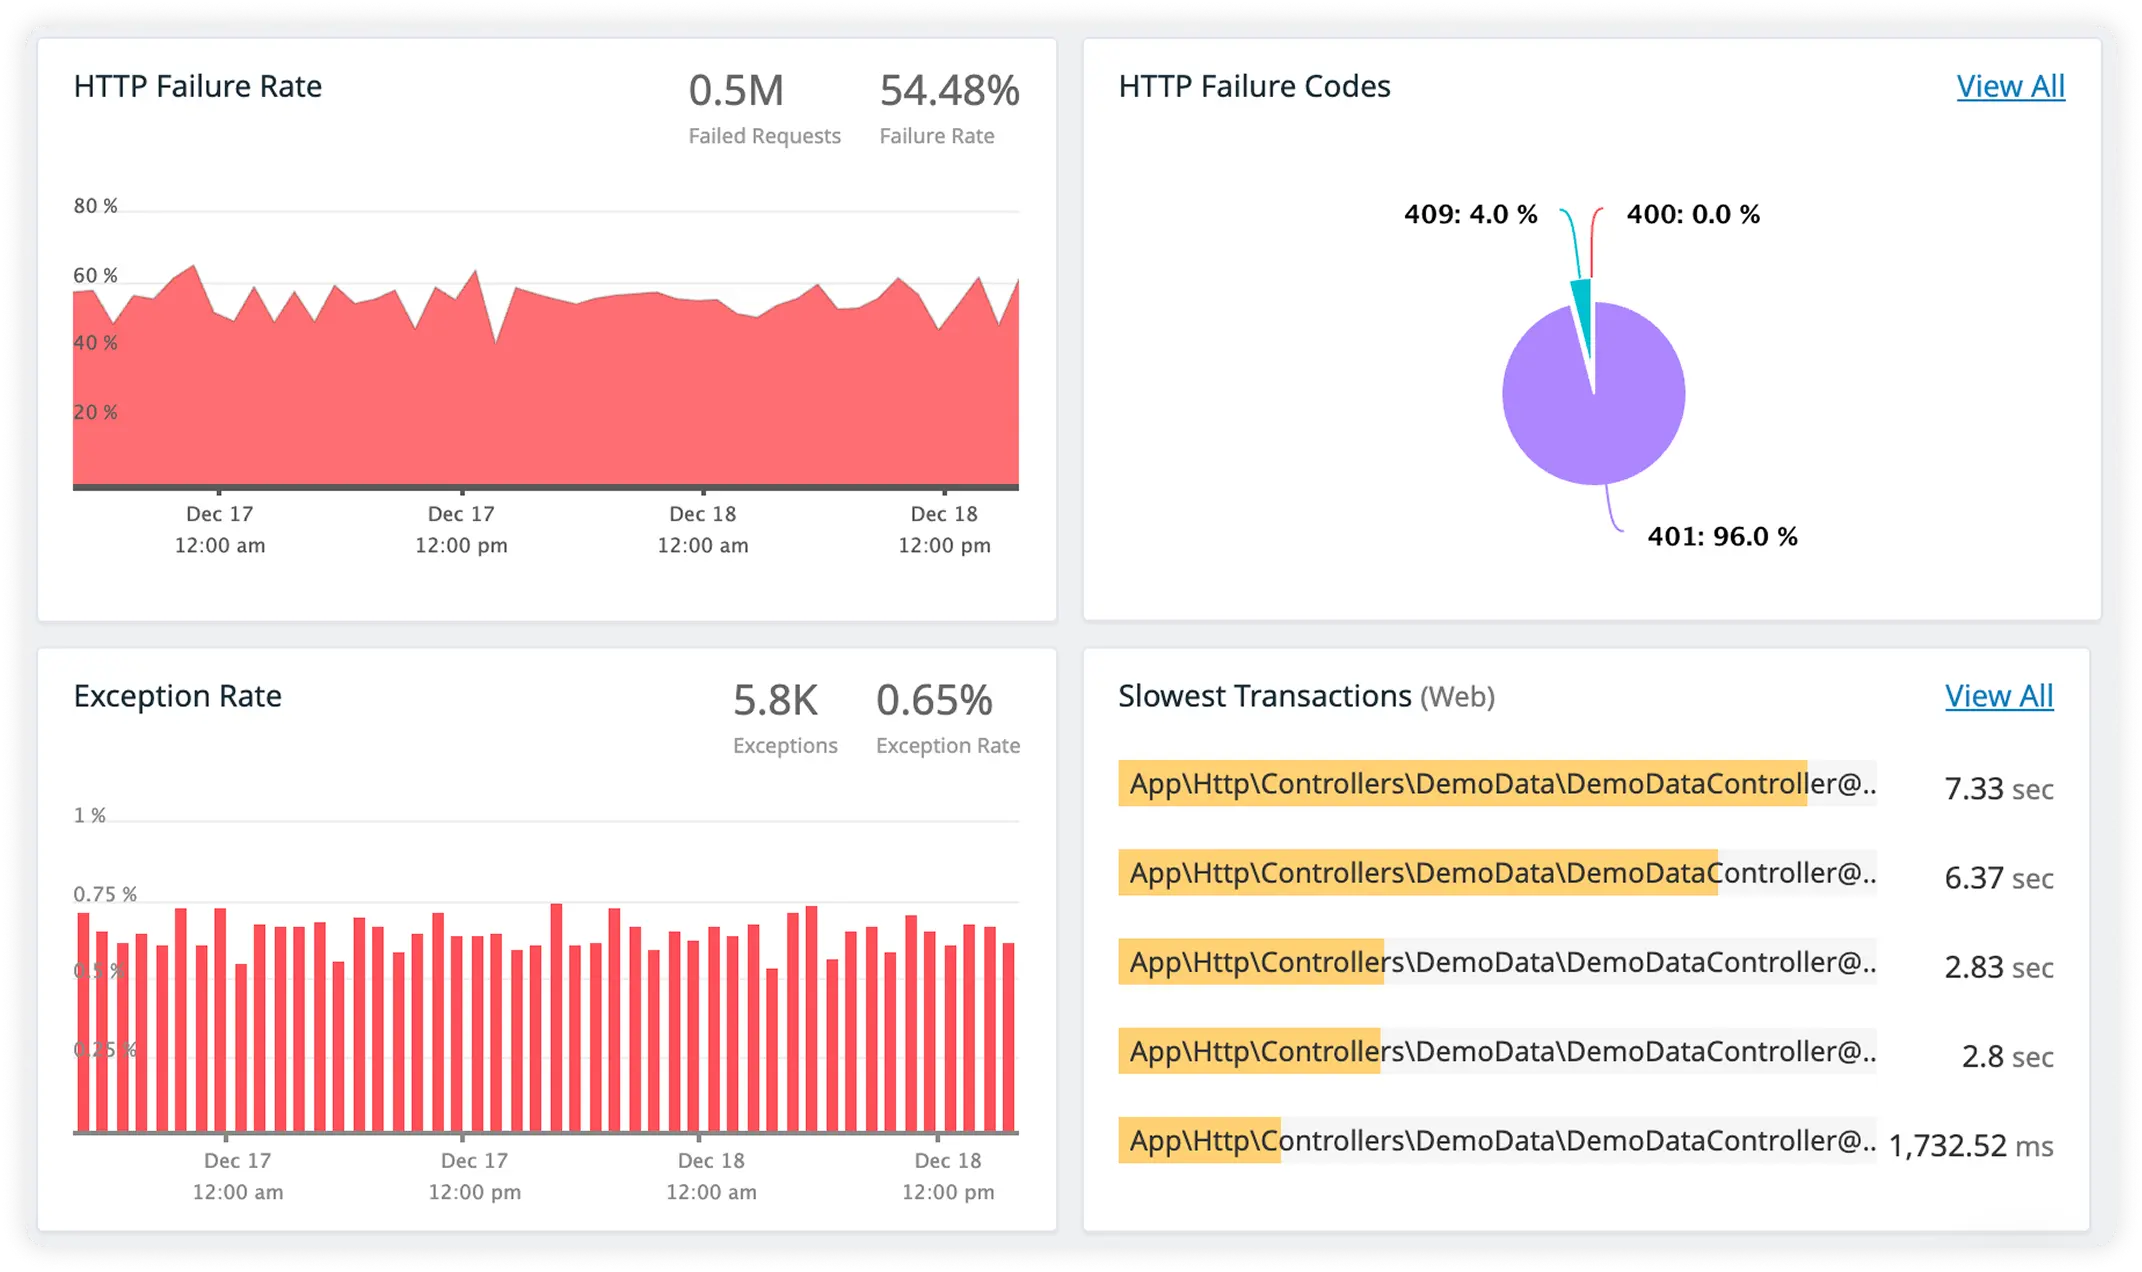
Third-Party Integrations with Request-Linked Logs
Track payment gateways, shipping APIs, and external services alongside correlated request logs. Debug faster with full context across performance data and runtime behavior.
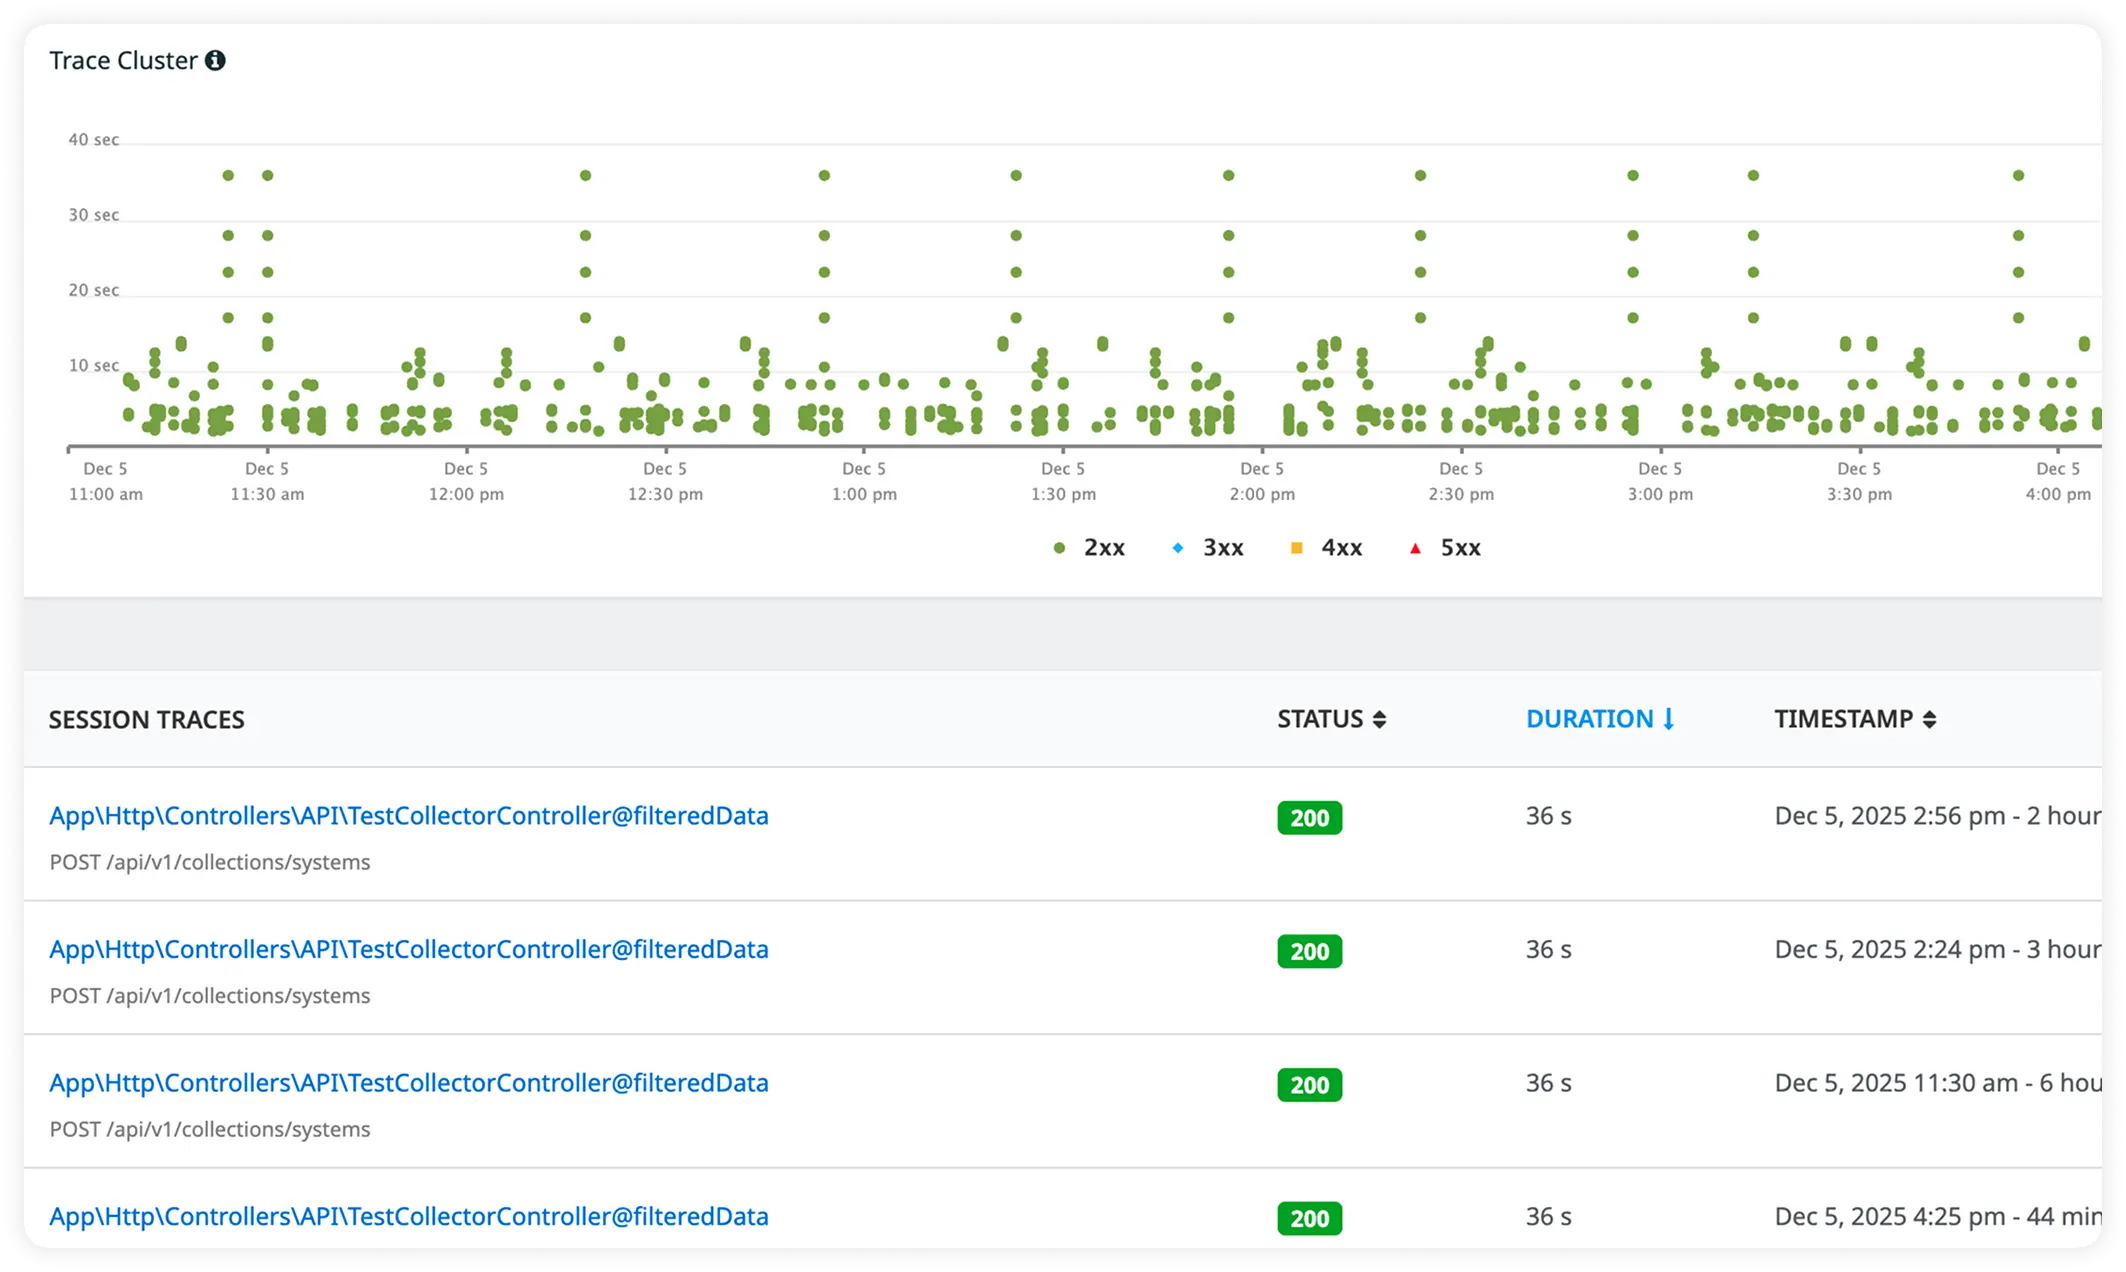
Why Teams Choose Execution-Aware Observability for Magento?
Magento teams choose Atatus when they need to reason about complex execution paths, not just page speed, across storefront, admin, and background workflows.
Execution Path Grounding
Teams understand how Magento requests actually execute across plugins, observers, and services instead of assuming linear flow.
Plugin Interaction Clarity
Engineers reason about how multiple plugins interact at runtime without manually untangling interception chains.
Observer Impact Awareness
Side effects triggered by observers are evaluated in execution context, reducing misattribution during investigations.
Checkout Flow Confidence
Teams diagnose checkout-specific execution issues with confidence, even when failures occur mid-transaction.
Background Work Context
Indexing and cron execution are understood alongside live request behavior, preventing false conclusions.
Low Disruption Adoption
Insight is gained without refactoring Magento modules or changing deployment workflows.
Shared Runtime Understanding
Platform, SRE, and backend teams align on the same execution reality instead of fragmented signals.
Reduced Diagnostic Guesswork
Engineers debug production issues using observed runtime behavior instead of stitching logs, metrics, and assumptions during high-pressure situations.
Unified Execution View
Teams view latency, errors, and execution behavior in a single runtime context instead of correlating multiple disconnected signals during production issues.
Unified Observability for Every Engineering Team
Atatus adapts to how engineering teams work across development, operations, and reliability.
Developers
Trace requests, debug errors, and identify performance issues at the code level with clear context.
DevOps
Track deployments, monitor infrastructure impact, and understand how releases affect application stability.
Release Engineer
Measure service health, latency, and error rates to maintain reliability and reduce production risk.