Martini Performance Monitoring
Get end-to-end visibility into your Martini performance with application monitoring tools. Gain insightful metrics on performance bottlenecks with Go monitoring to optimize your application.
Where Martini Simplicity Breaks?
Handler Chain Ambiguity
Martini resolves handlers at runtime based on request context, making it difficult to confirm which handlers executed and in what sequence under real production traffic.
Dependency Injection Variability
Runtime binding decisions change based on request state and environment, leading to inconsistent behavior that is hard to reason about during failures.
Context Propagation Loss
Critical identifiers and execution state fail to persist through the full request lifecycle, slowing correlation during incident analysis.
Error Origin Unclear
Runtime errors bubble up detached from their originating execution path, forcing engineers to backtrack through multiple handlers manually.
External Call Shadows
Failures and slowdowns appear within the service while the true cause originates from outbound calls that are not immediately visible.
Configuration Drift Effects
Differences in environment variables, injected services, and runtime assumptions cause production behavior to deviate from non-production expectations.
Concurrency Pressure Growth
Execution pressure accumulates across concurrent requests, leading to contention and degraded responsiveness before limits are clearly reached.
Scaling Without Guardrails
Martini services degrade as concurrency and request volume increase, without clear indicators of where execution limits are being crossed.
Complete Performance Visibility for
Martini Applications
Real-time observability for Martini workloads that helps teams trace request performance, optimize execution flow, and resolve production issues faster.
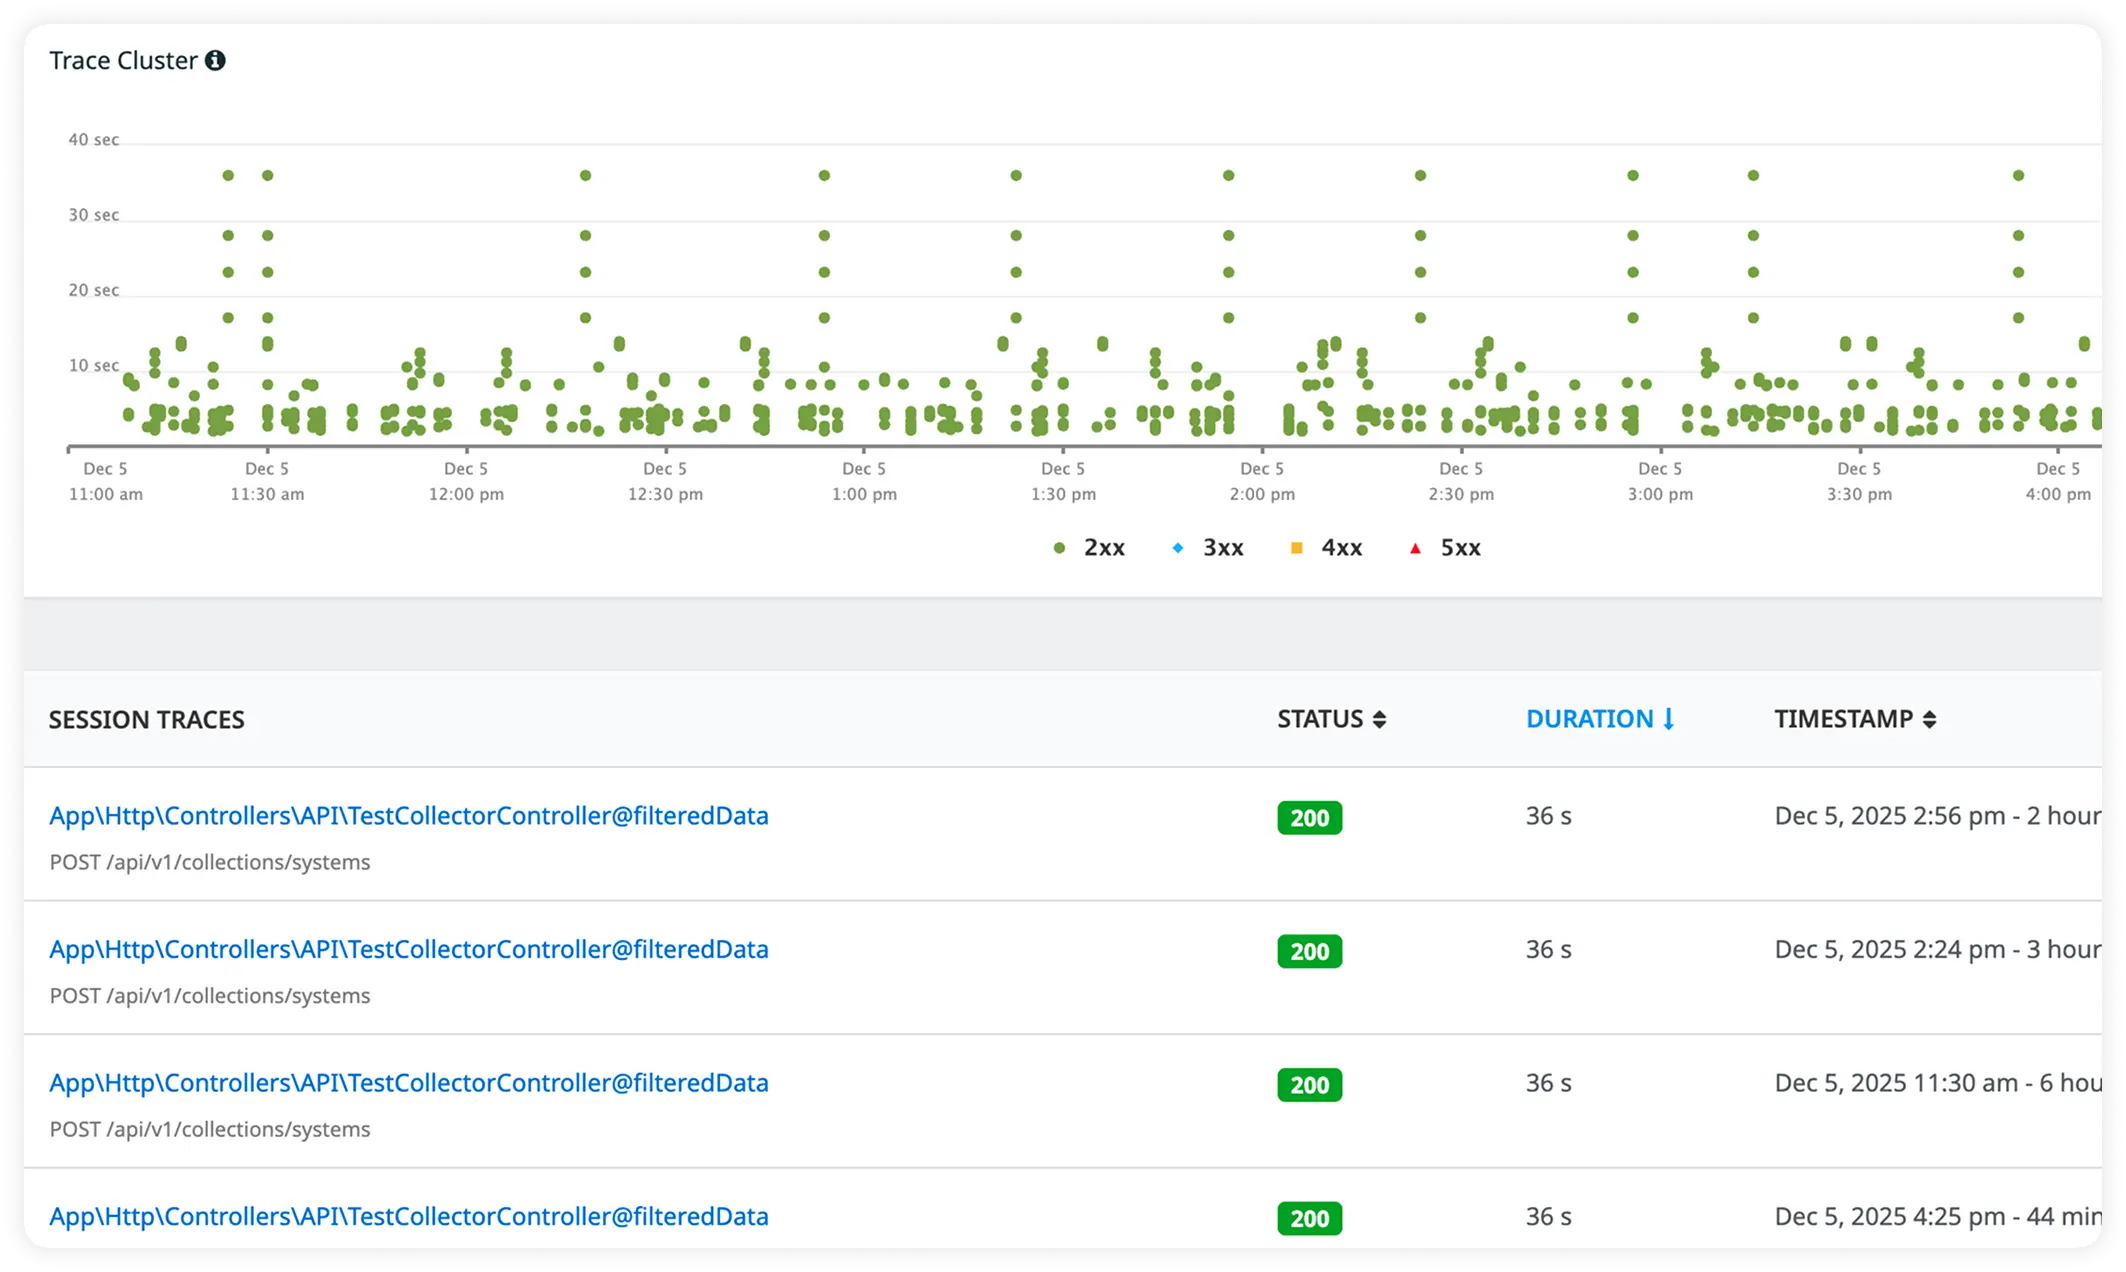
End-to-End Request Timing
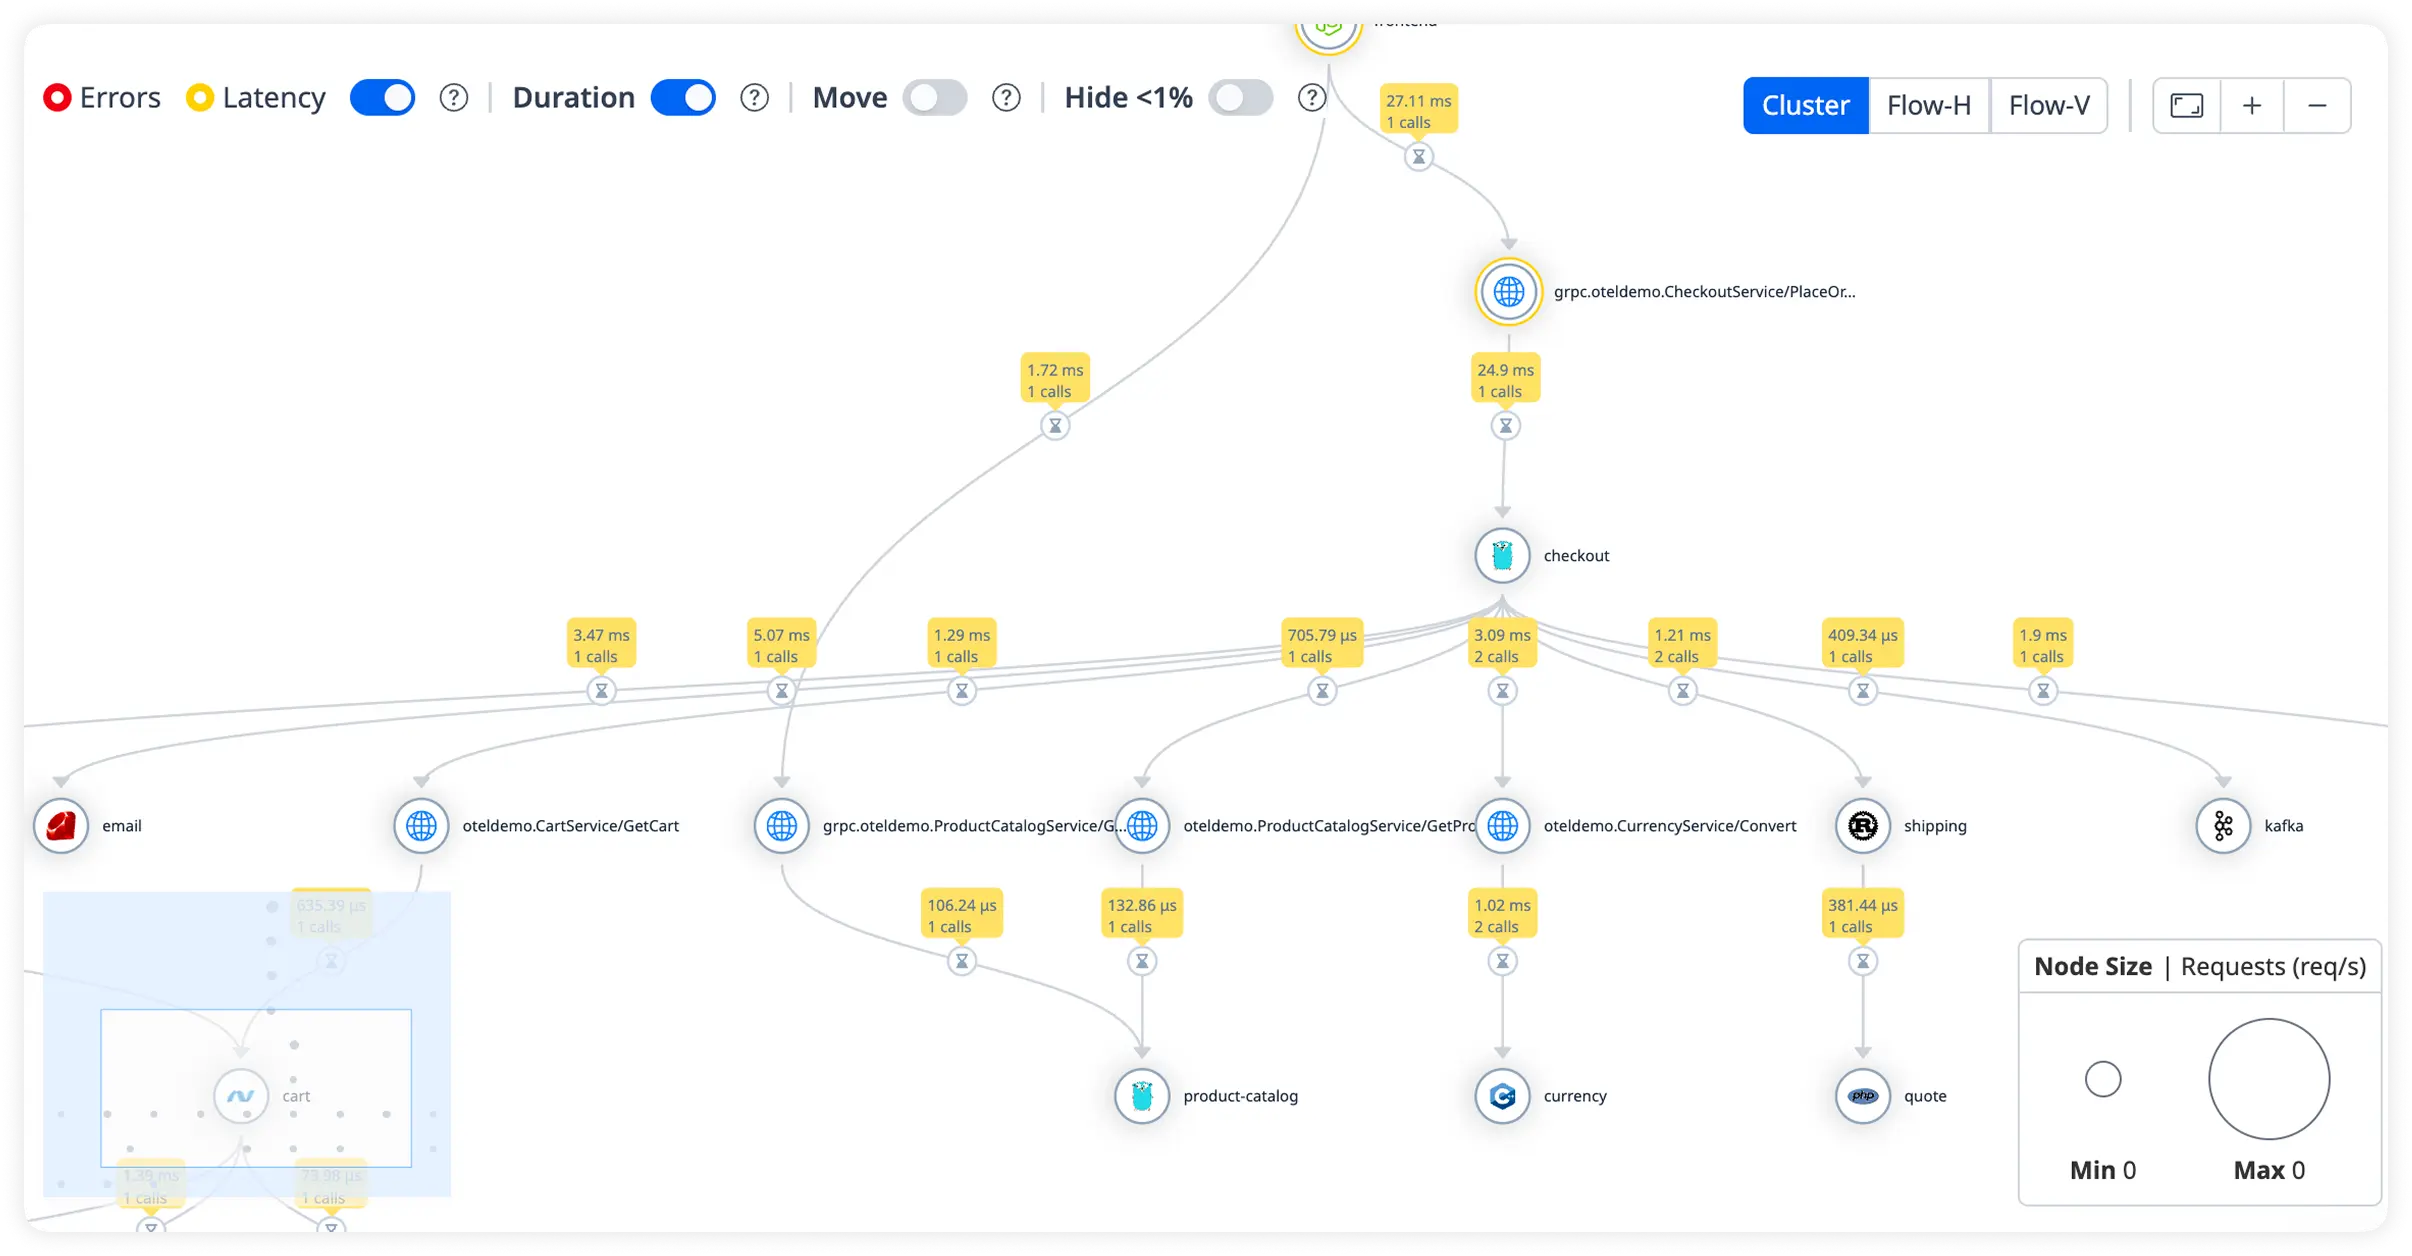
Track the full lifecycle of every request from entry to response. Quickly identify latency introduced across handlers, services, and dependencies.
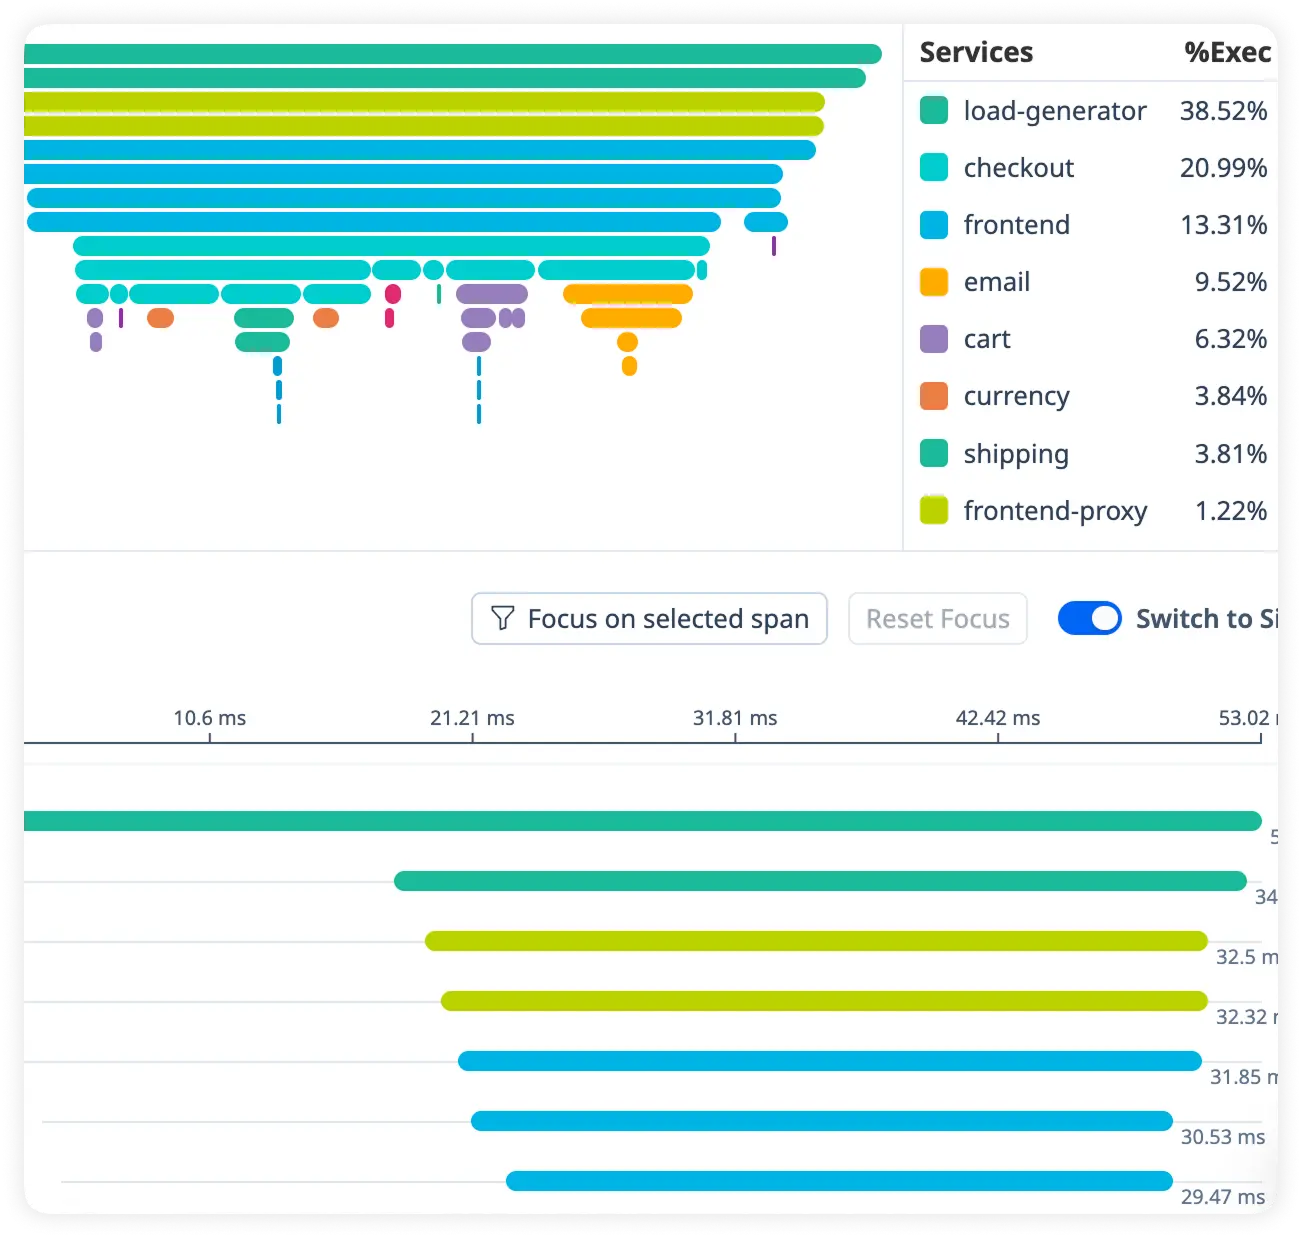
Handler Execution Profiles
Analyze how individual handlers perform during request processing. Pinpoint slow execution steps impacting overall application responsiveness.
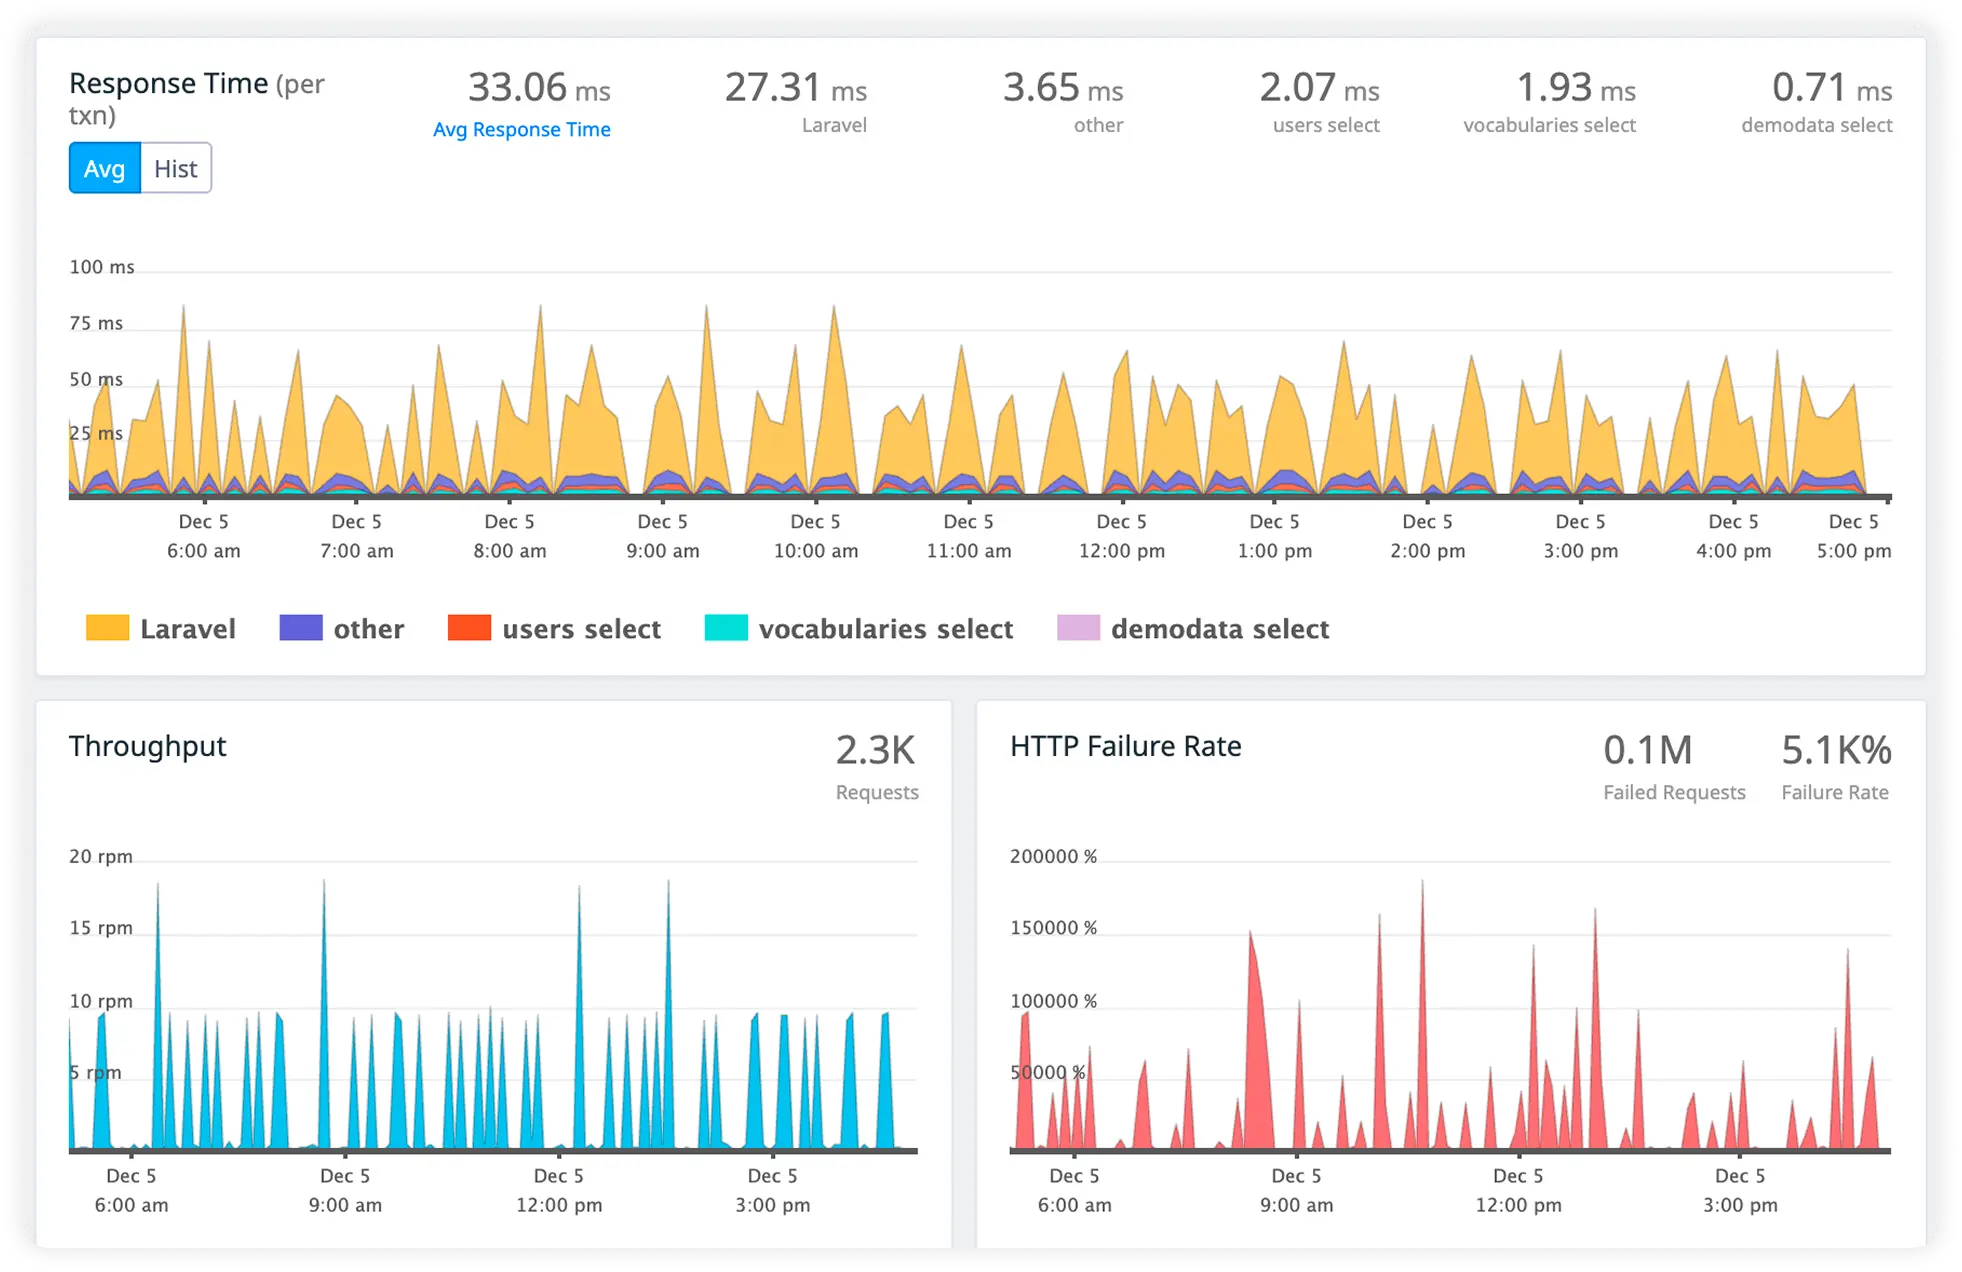
DB Call Weight
Measure database query execution time and resource impact in real time. Eliminate inefficient database operations slowing request performance.
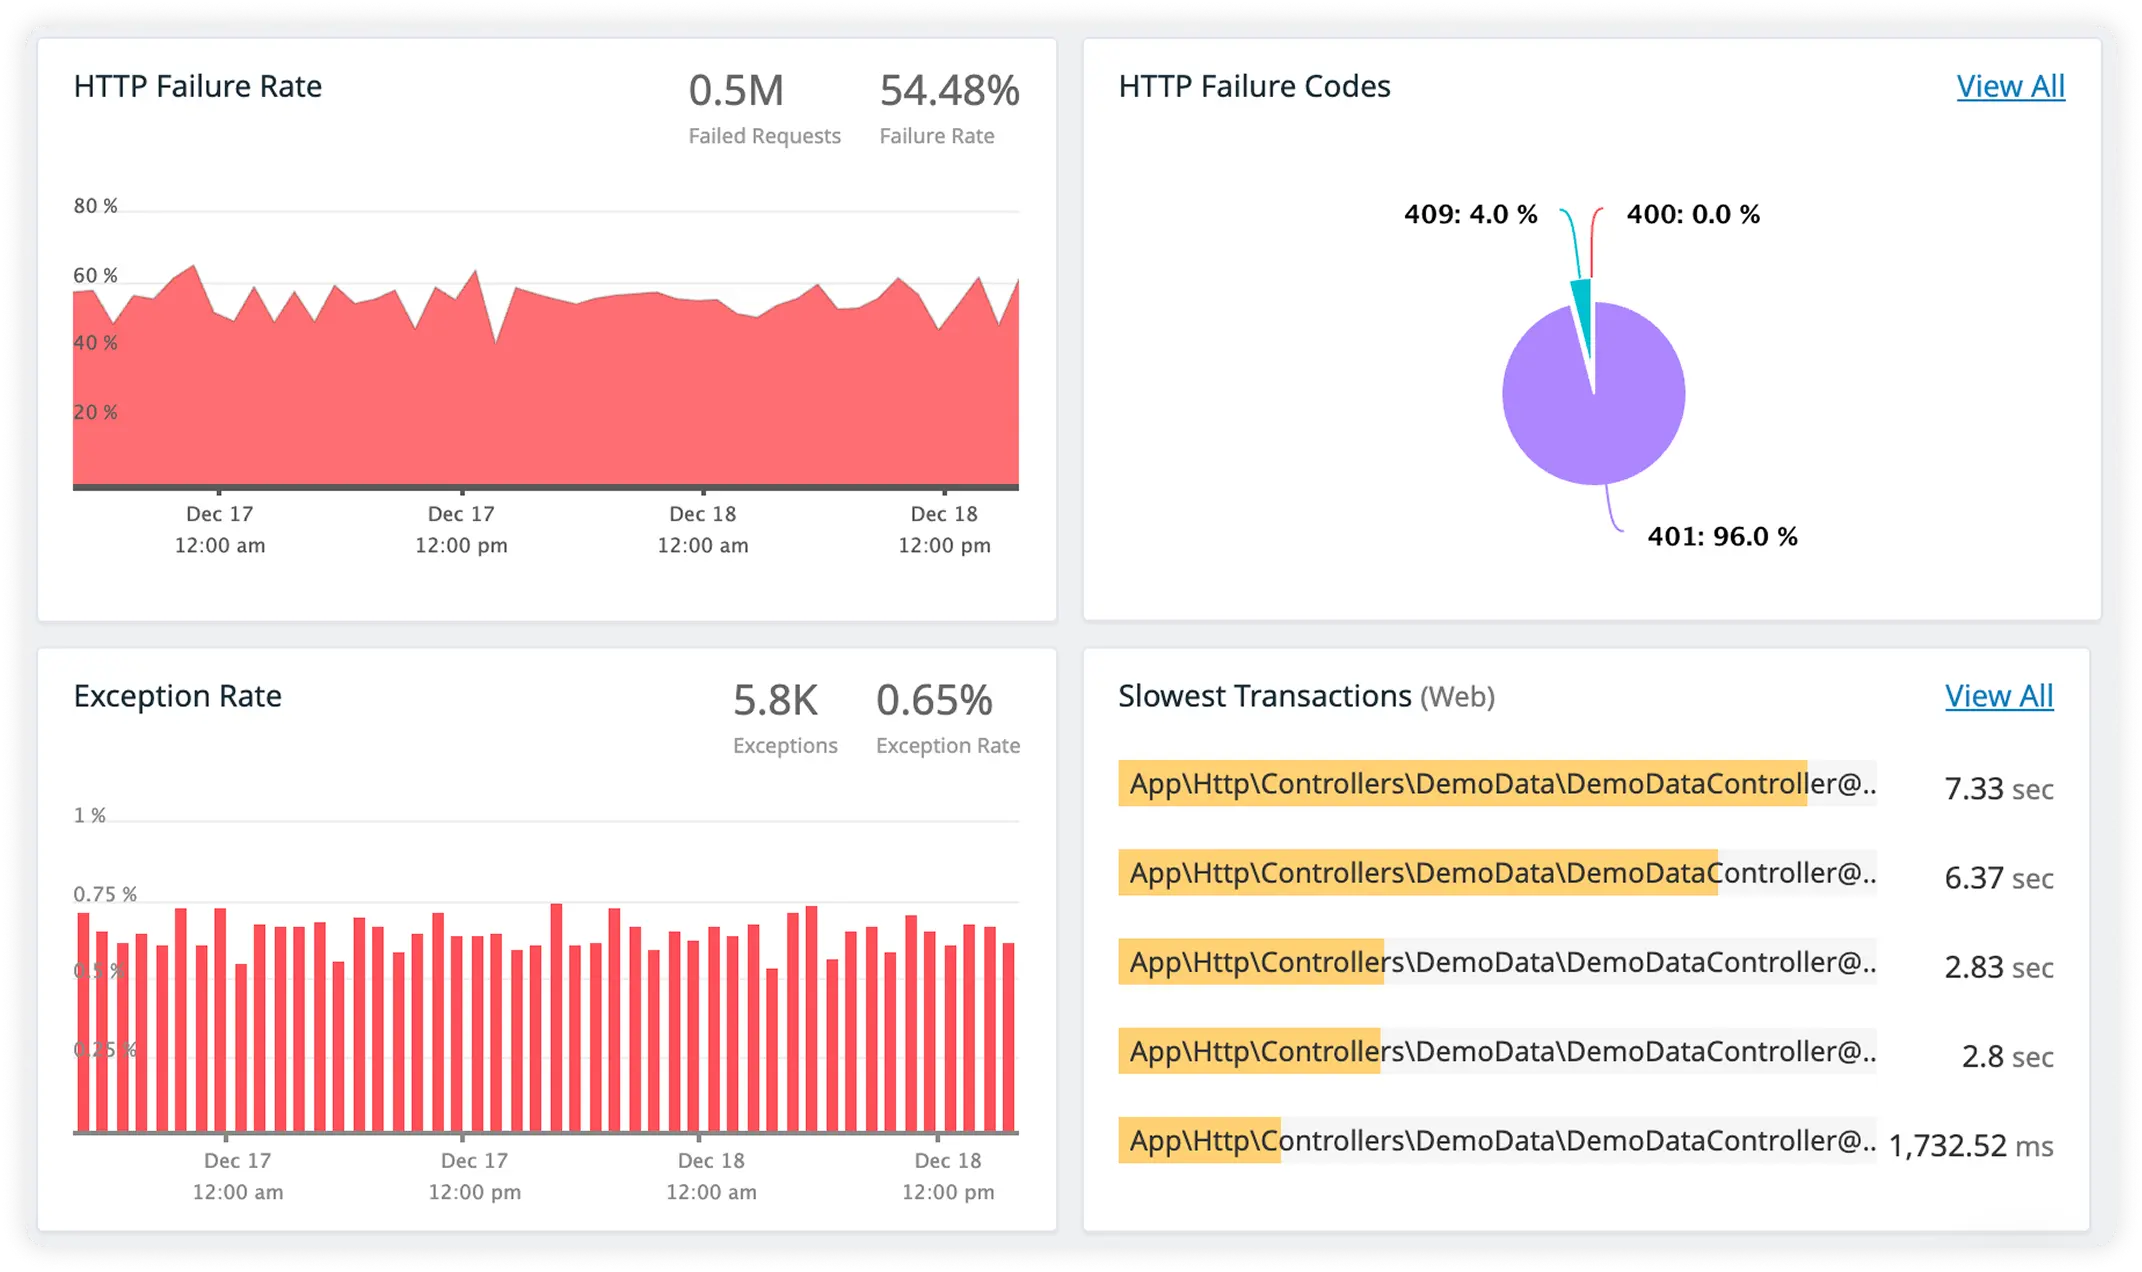
External Call Latency with Host Resource Metrics
Track response times for third-party services while monitoring host CPU and memory usage. Understand how external dependencies and system resources affect performance.
Why Teams Choose Atatus?
Martini teams choose Atatus when lightweight frameworks require dependable production insight under real-world traffic.
Clear Execution Order
Request execution paths remain explicit in production, reducing ambiguity when tracing how a request was processed under real traffic conditions.
Fast Developer Confidence
Engineers trust production data early in the investigation, allowing them to act without spending time validating assumptions.
Low Adoption Friction
Instrumentation fits naturally into existing pipelines, avoiding changes that slow releases or increase operational risk.
Predictable Debug Paths
Engineers move from symptom to cause using repeatable analysis steps, independent of individual experience levels.
Reduced On-Call Load
On-call engineers resolve issues faster with fewer context switches and less guesswork during high-pressure situations.
Cross-Team Consistency
Incident discussions align around the same runtime evidence, minimizing miscommunication and redundant validation.
Stable Under Concurrency
Signal quality holds steady even as parallelism increases, preventing blind spots during peak load.
Trust During Failures
Teams retain visibility when systems are unstable, enabling faster containment and recovery.
Long-Term Operational Trust
As services grow and ownership shifts, observability remains a stable foundation rather than a recurring problem.
Unified Observability for Every Engineering Team
Atatus adapts to how engineering teams work across development, operations, and reliability.
Developers
Trace requests, debug errors, and identify performance issues at the code level with clear context.
DevOps
Track deployments, monitor infrastructure impact, and understand how releases affect application stability.
Release Engineer
Measure service health, latency, and error rates to maintain reliability and reduce production risk.