Restify Performance Monitoring
Get end-to-end visibility into your Restify performance with application monitoring tools. Gain insightful metrics on performance bottlenecks with Node.js monitoring to optimize your application.
Why Restify APIs Break Down Under Real Traffic?
Pre Routing Opacity
server.pre() runs before routing and version resolution. When latency or failure happens here, requests disappear before reaching handlers, leaving no execution visibility.
Versioned Route Drift
Restify route versioning changes execution paths silently. Under mixed client versions, teams struggle to understand which route logic actually ran.
Streaming Boundary Loss
Restify supports streaming responses where execution continues after headers flush. Errors mid-stream surface without a clear request completion boundary.
Handler Async Skew
Async handlers resolve differently under load. Timing variance breaks the assumption that request execution is linear and predictable.
Connection Lifecycle Blindness
Persistent connections and keep-alive reuse alter request timing. Slowdowns emerge from socket behavior rather than handler logic.
Payload Parsing Pressure
Large payloads are parsed before handler execution. Parsing cost increases with payload shape and size, but appears as unexplained latency.
Error Surface Delay
Errors thrown during async execution surface after request state mutates, disconnecting failures from their triggering logic.
Concurrency Shape Mismatch
Restify services behave differently under bursty API traffic. Behavior that is stable at low volume degrades non-linearly at scale.
End-to-End Visibility for
Restify Applications
Real-time observability for Restify services that helps teams trace requests, optimize route performance, and resolve production issues with confidence.
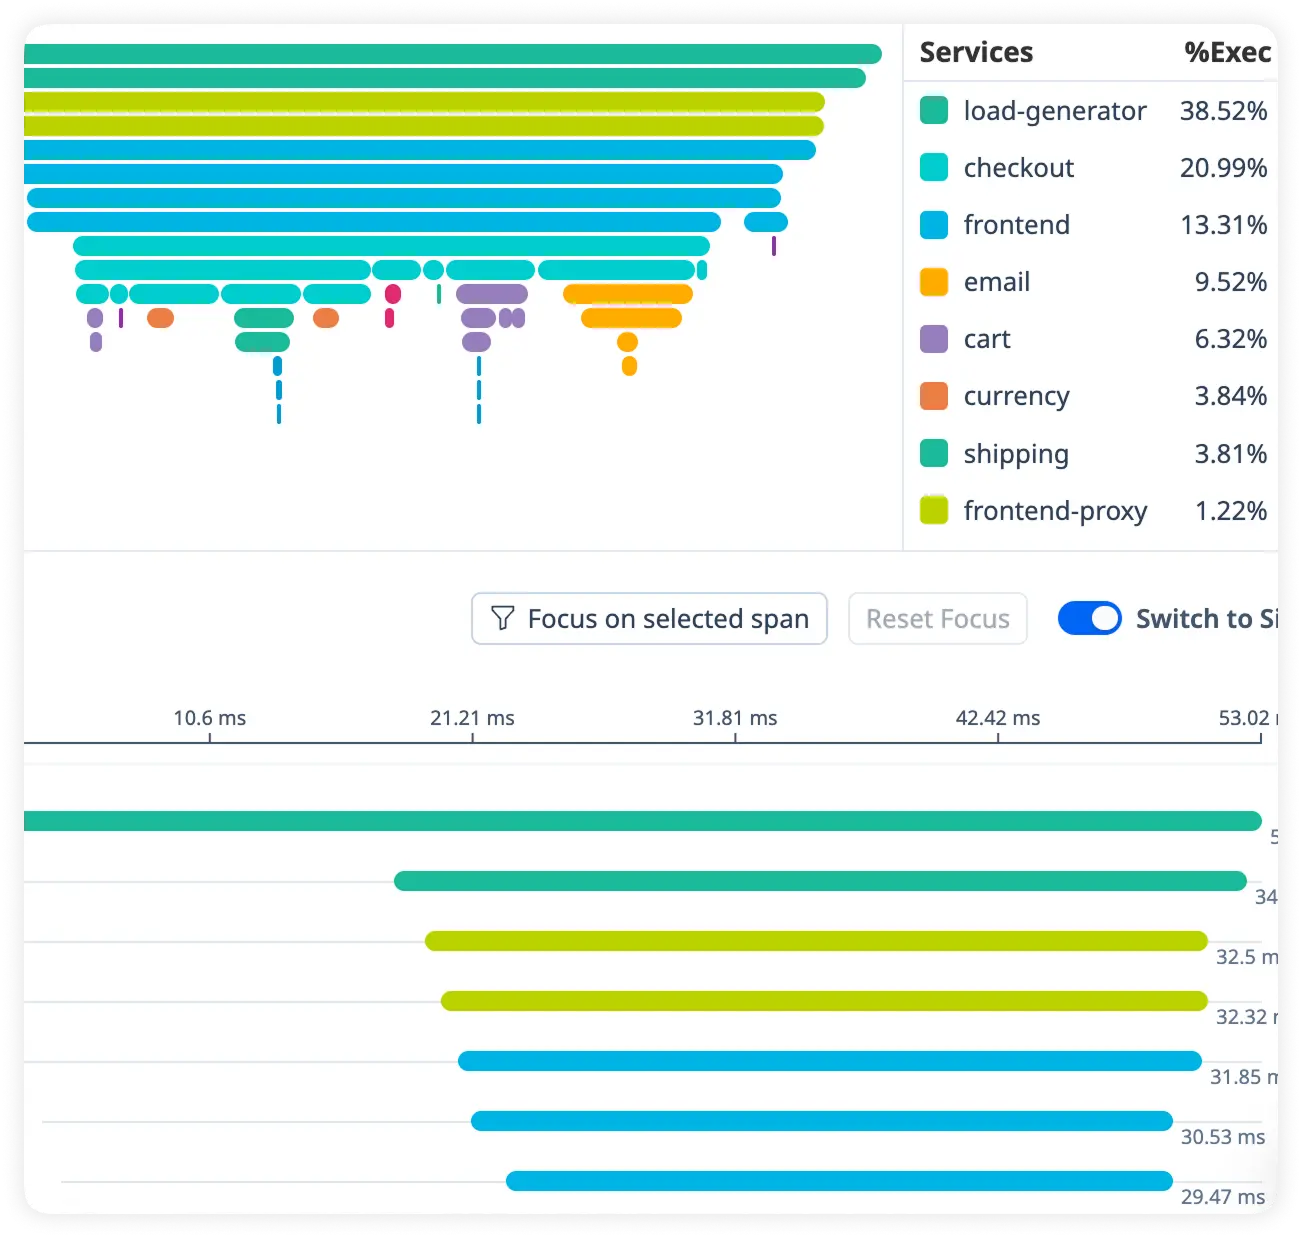
Complete Distributed Tracing Across Services
Follow every request across microservices, APIs, databases, and background processes in a single unified trace. Understand execution flow and pinpoint latency across your Restify stack.
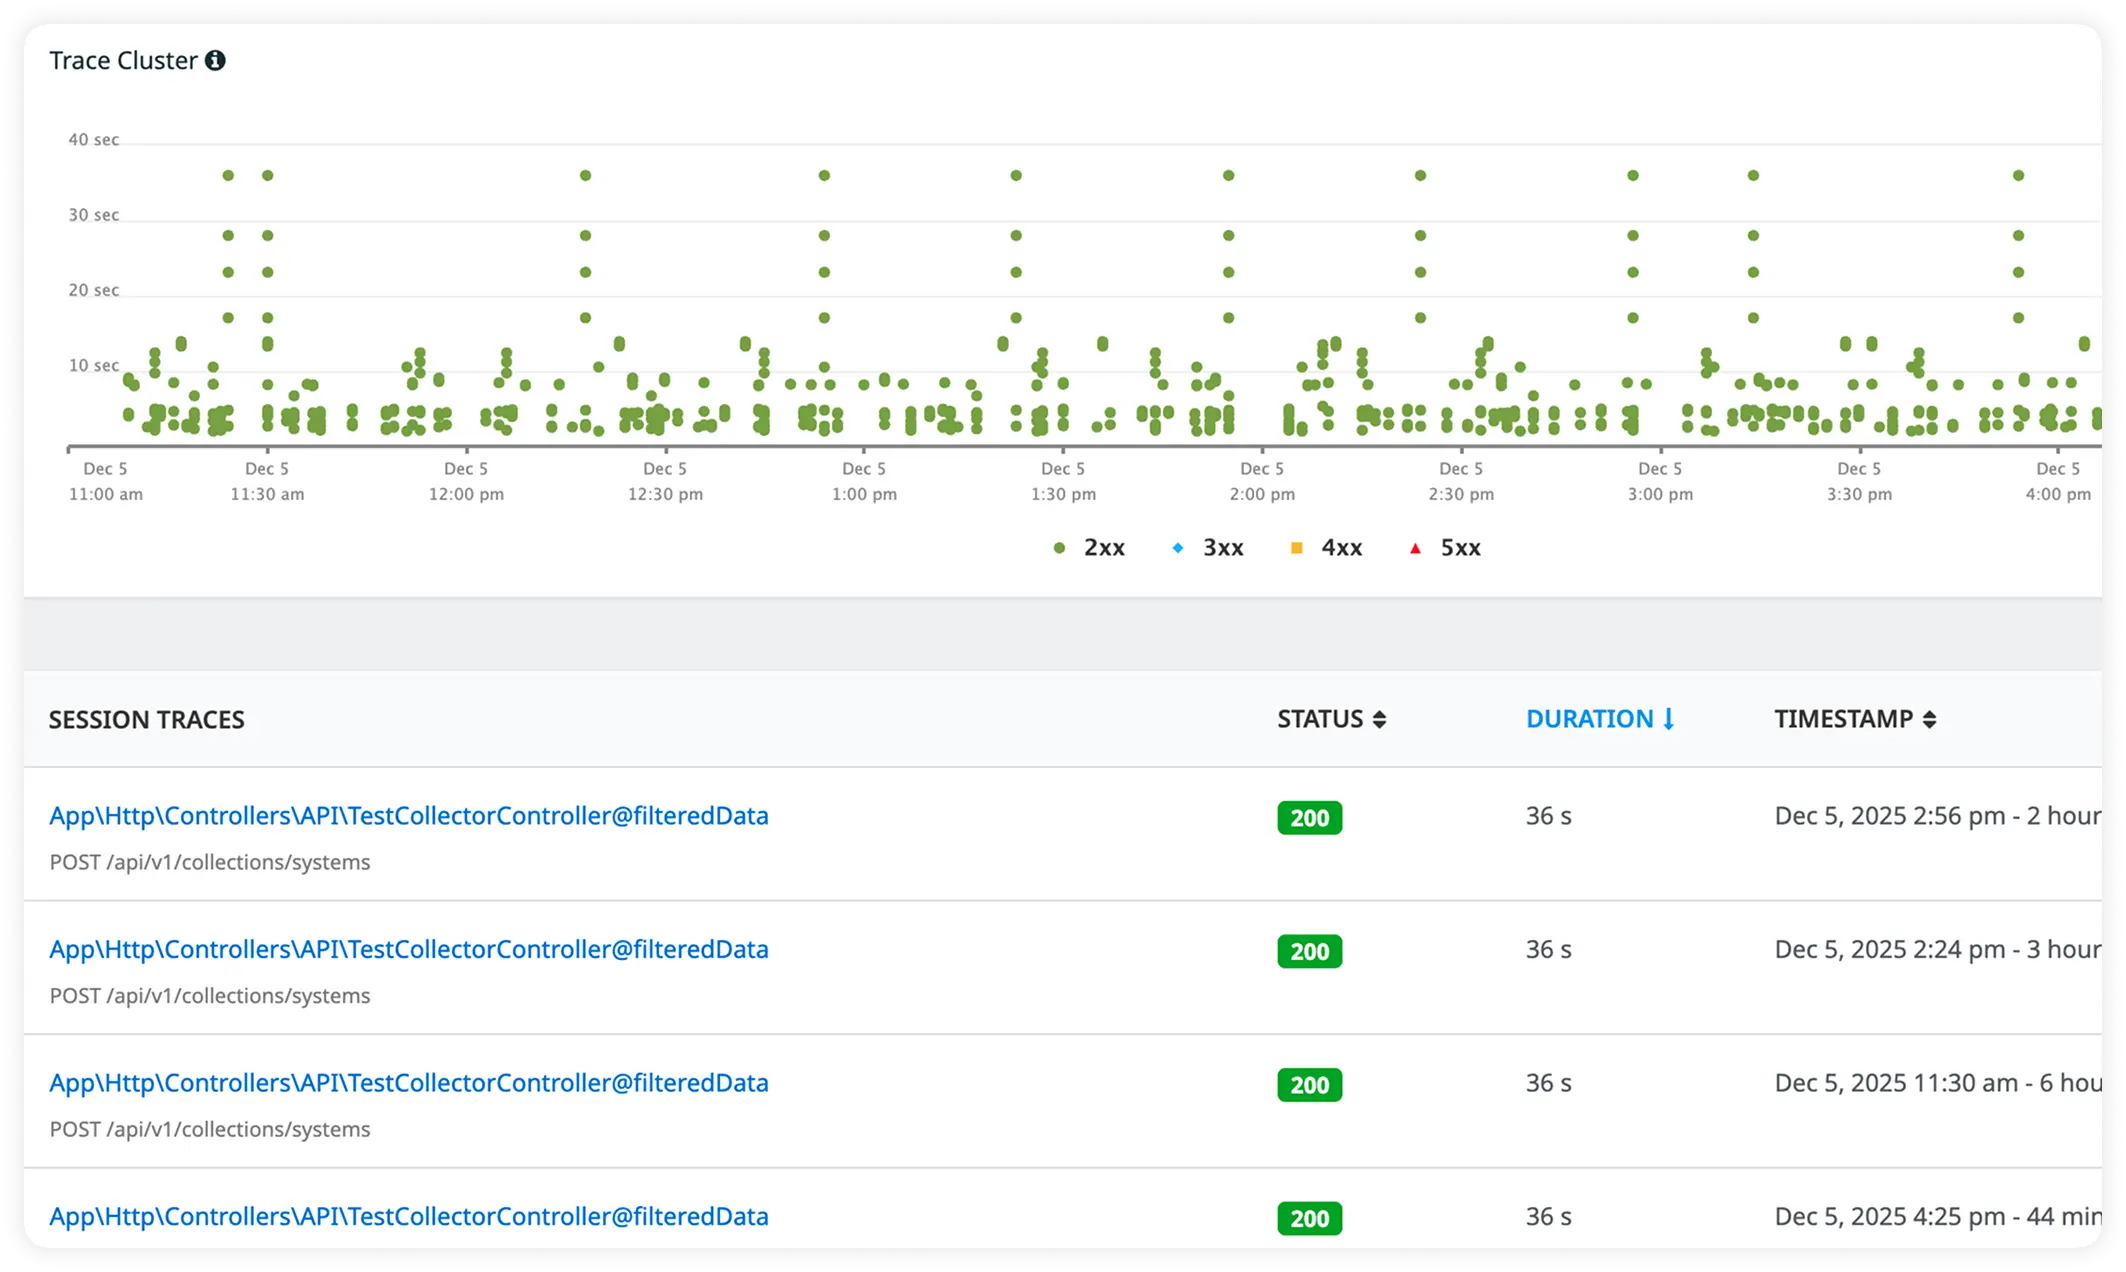
Identify Slow Routes in Real Time
Surface routes that consistently introduce high latency or errors. Focus performance tuning efforts where it matters most.
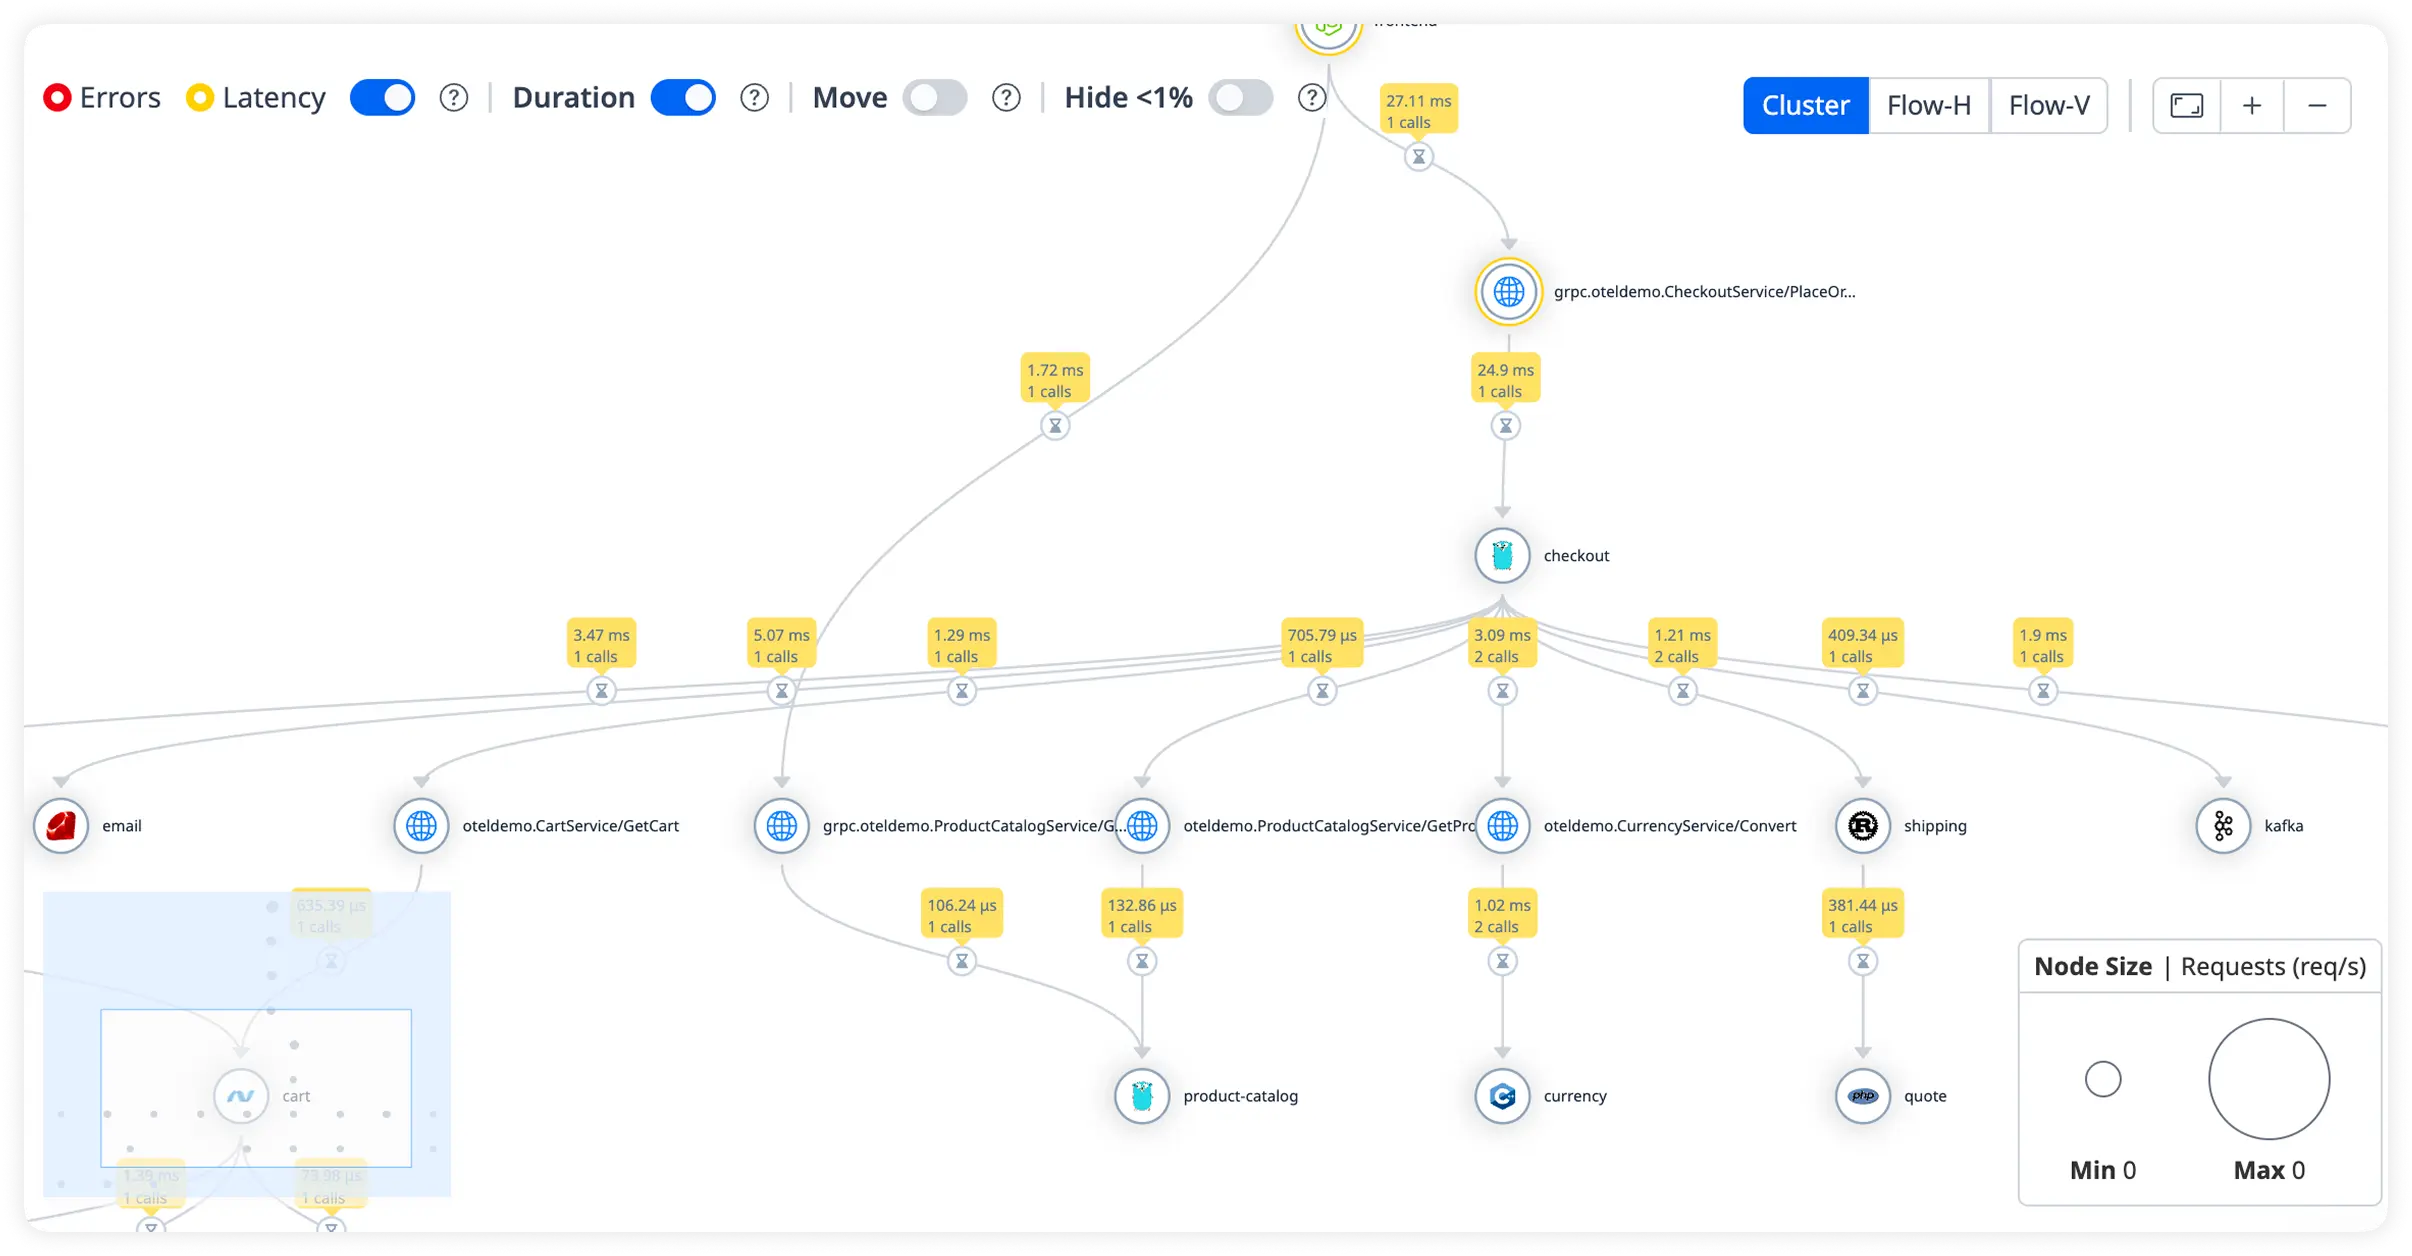
Measure Database Call Timing
Track query execution times and database performance under live workloads. Quickly detect inefficient operations slowing request processing.
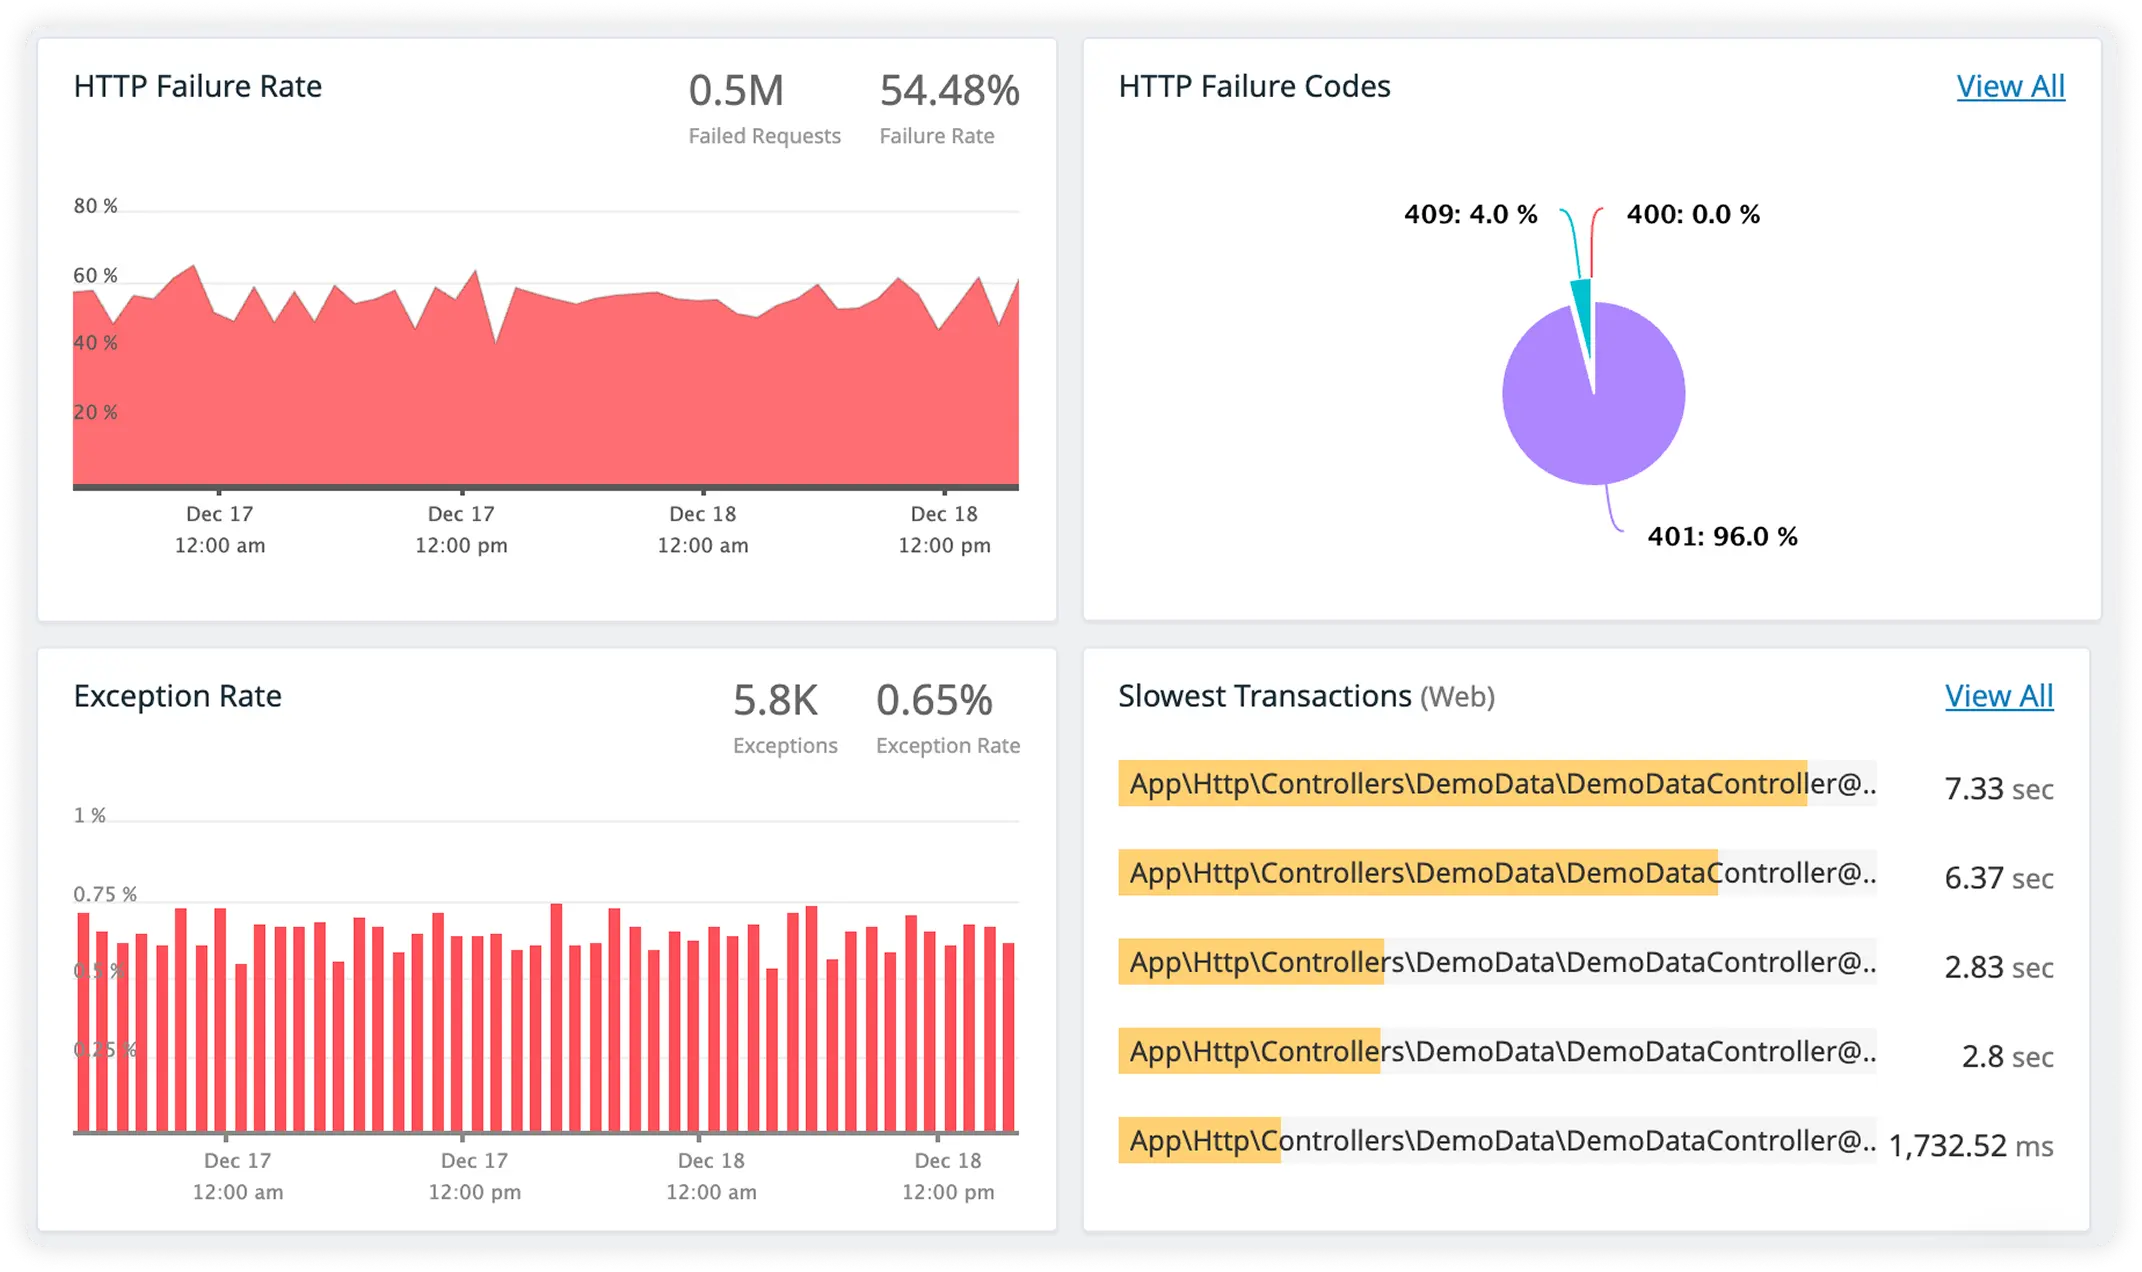
External Request Breakdown with Error Stack Insight
Analyze third-party API response times alongside detailed error stack traces. Resolve failures faster while understanding how external dependencies impact performance.
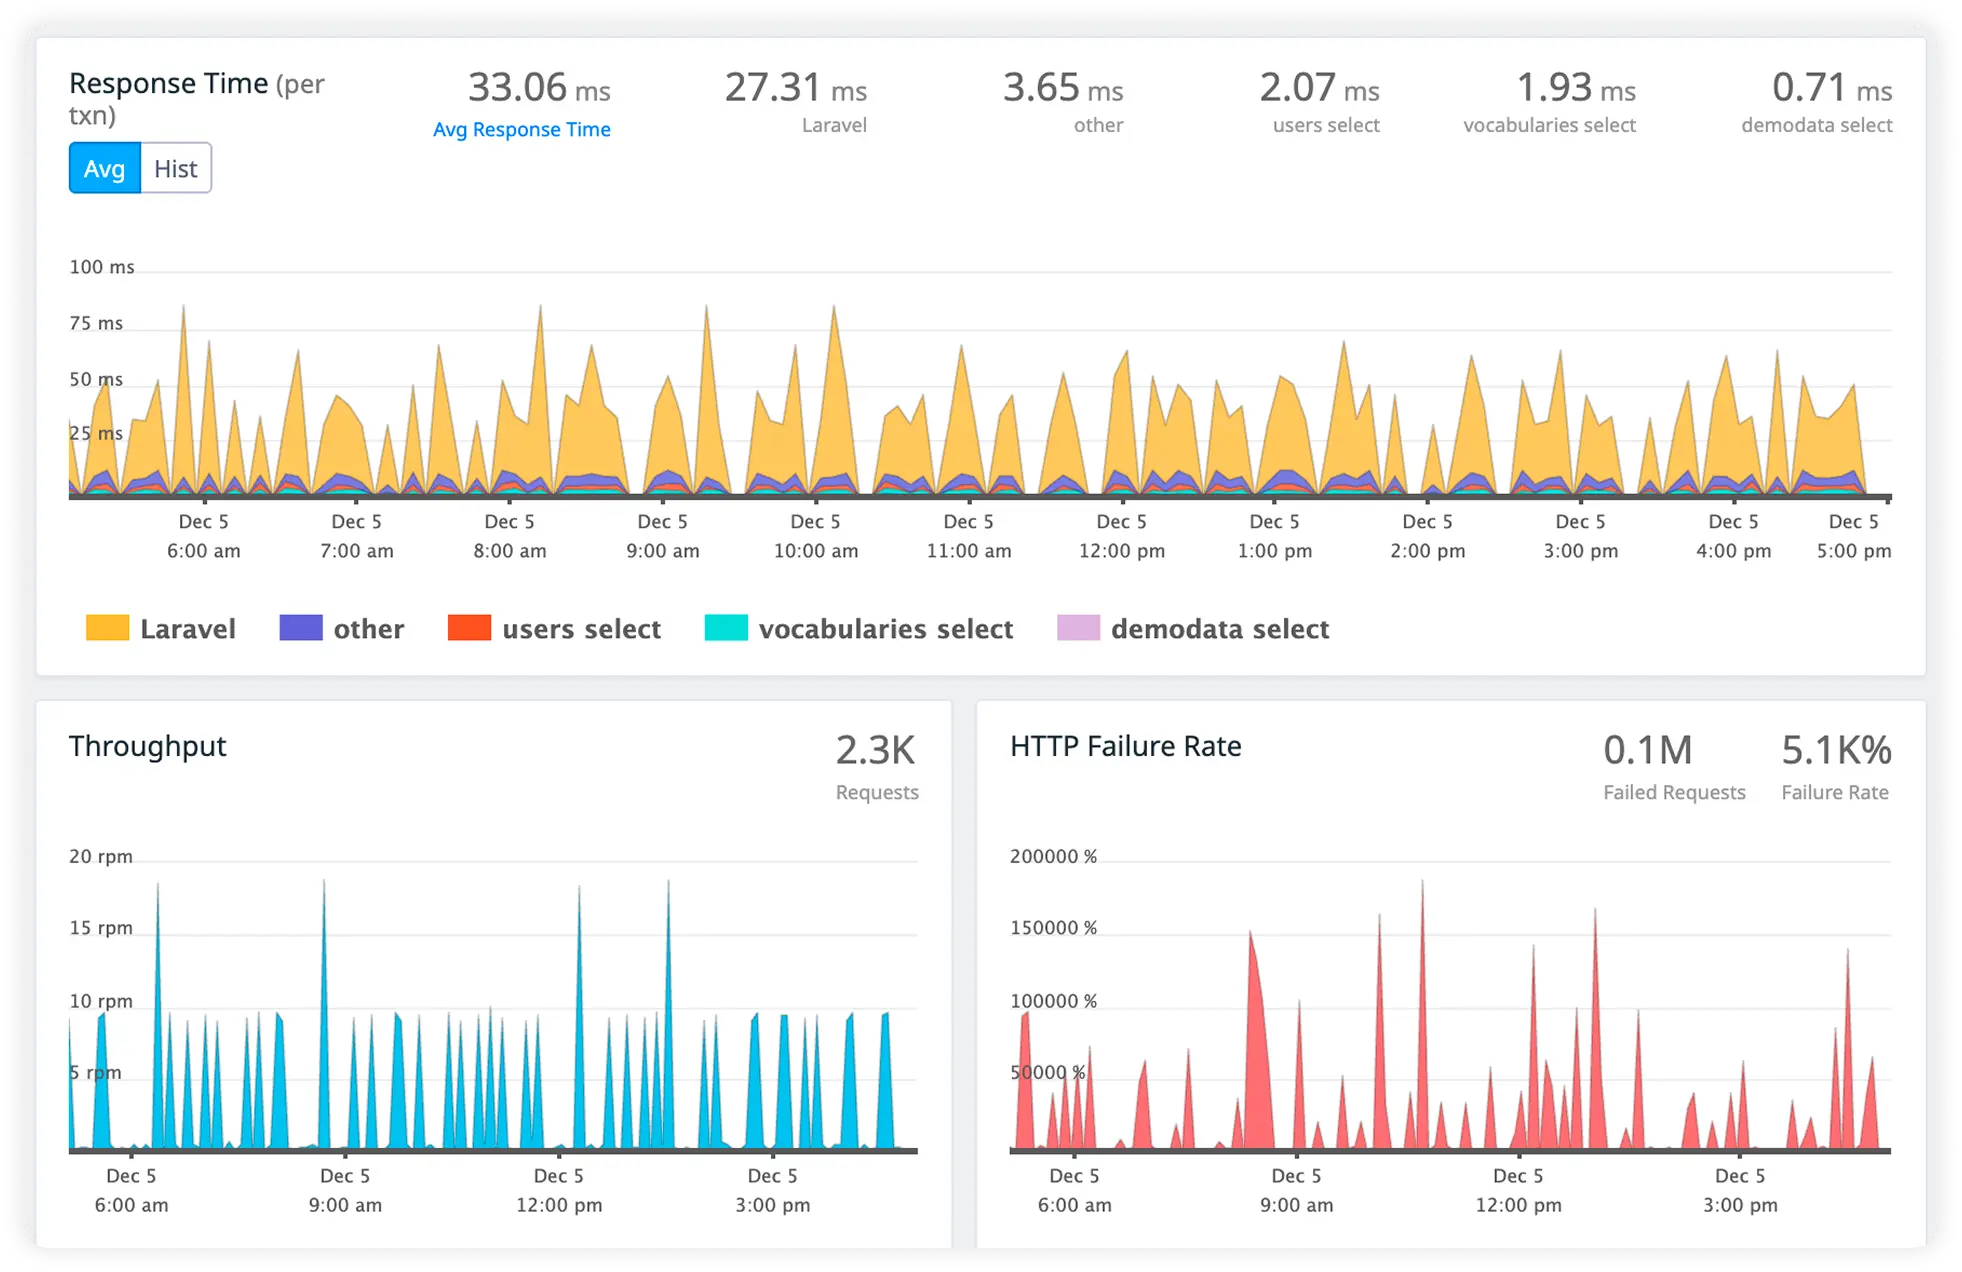
Why Teams Choose Atatus for Restify Monitoring?
Teams building high-throughput APIs on Restify choose Atatus when understanding request execution and connection behavior matters more than aggregate metrics.
Execution Path Confidence
Engineers understand how requests flow through pre-routing, version resolution, and handler execution under real load.
Async Timing Continuity
Request execution remains understandable even when async handlers resolve out of order.
Streaming Safety Understanding
Teams reason about long-lived responses and partial writes without losing execution context.
Connection Impact Awareness
Request behavior is evaluated alongside connection reuse and socket lifecycle effects.
Versioned Route Certainty
Teams correlate runtime behavior with route versions instead of guessing which logic path executed.
Fast Team Alignment
Backend, platform, and SRE teams operate from the same execution reality during live issues.
Low Adoption Friction
Insight fits existing Restify services without changing API structure or traffic handling.
Versioned Traffic Confidence
Teams understand how different API versions behave under real traffic, instead of guessing which code path handled a request.
Pre Route Attribution
Teams distinguish execution that happens before route resolution from handler-level behavior, avoiding misattribution during debugging.
Unified Observability for Every Engineering Team
Atatus adapts to how engineering teams work across development, operations, and reliability.
Developers
Trace requests, debug errors, and identify performance issues at the code level with clear context.
DevOps
Track deployments, monitor infrastructure impact, and understand how releases affect application stability.
Release Engineer
Measure service health, latency, and error rates to maintain reliability and reduce production risk.