Ruby Application Performance Monitoring
Get end-to-end visibility into your Ruby performance with application monitoring tools. Gain insightful metrics on performance bottlenecks with Ruby monitoring to optimize your application.
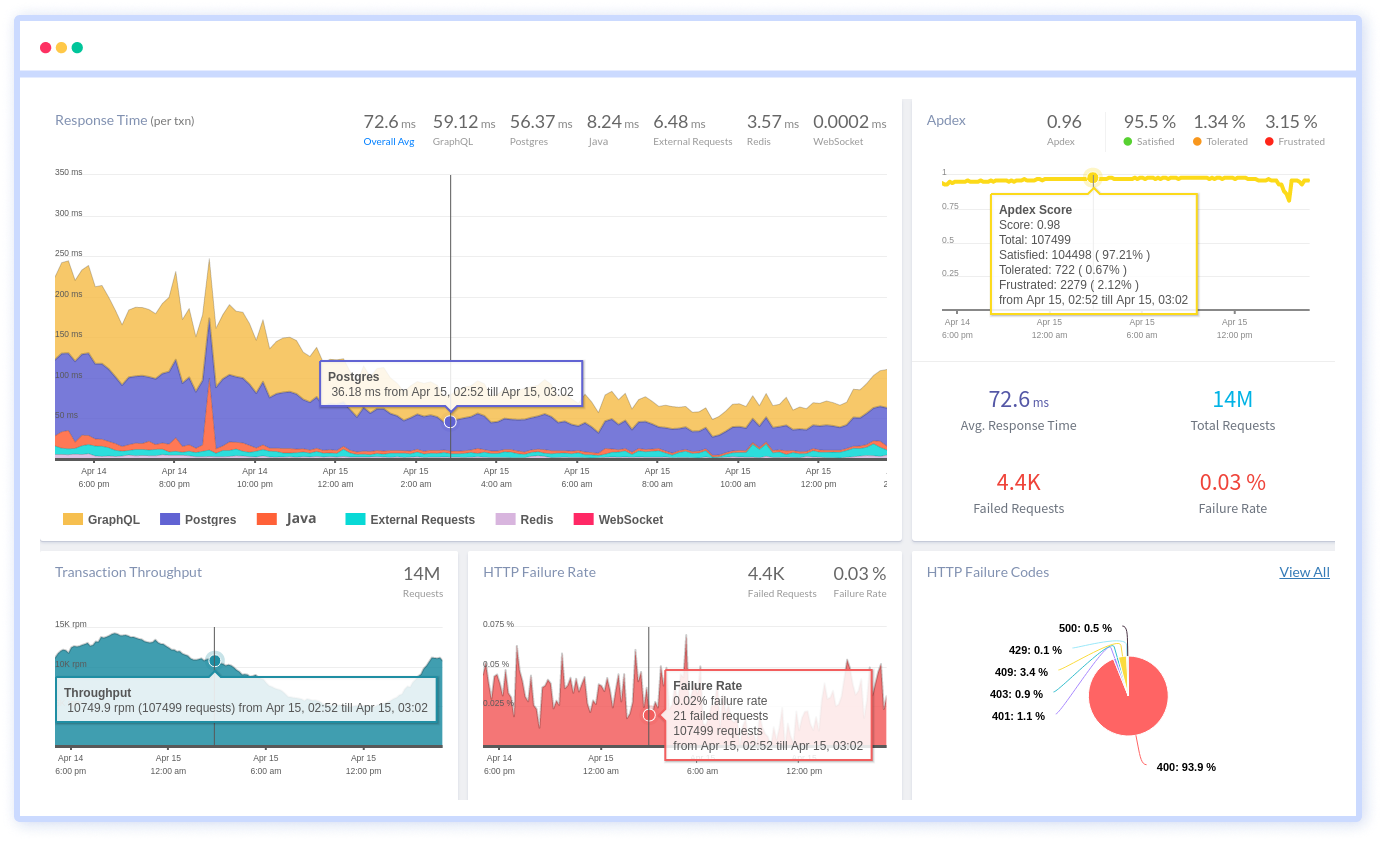
The Hidden Cost of Ruby in Production
Blind runtime behavior
When Ruby apps slow under real traffic, teams lack a reliable view into what the runtime is actually doing. Assumptions replace evidence, and fixes become guesswork.
Unclear failure paths
Errors surface without context on what triggered them. Engineers see symptoms but not the execution path that led there.
Slow Root Causes
Incidents demand fast answers, yet teams burn hours stitching clues across systems. The delay increases blast radius and operational stress.
Scaling side effects
What works at low traffic breaks subtly at scale. Latency compounds, queues back up, and the root issue hides behind secondary failures.
Noisy signals
Production generates massive amounts of data, but little of it explains why things broke. Teams struggle to separate signal from background noise.
Environment drift
Behavior differs across staging, production, and regions. Bugs reproduce only under specific conditions that are hard to isolate.
Ownership confusion
Multiple teams touch the same Ruby services. When incidents happen, responsibility is unclear and response slows down.
Reactive firefighting
Without continuous clarity, teams operate in crisis mode. Engineering time shifts from building to chasing production issues.
Gain Deep Observability into
Ruby Application Performance
Real-time performance monitoring designed for Ruby that helps teams understand runtime behavior, catch issues early, and optimize production performance with clarity.
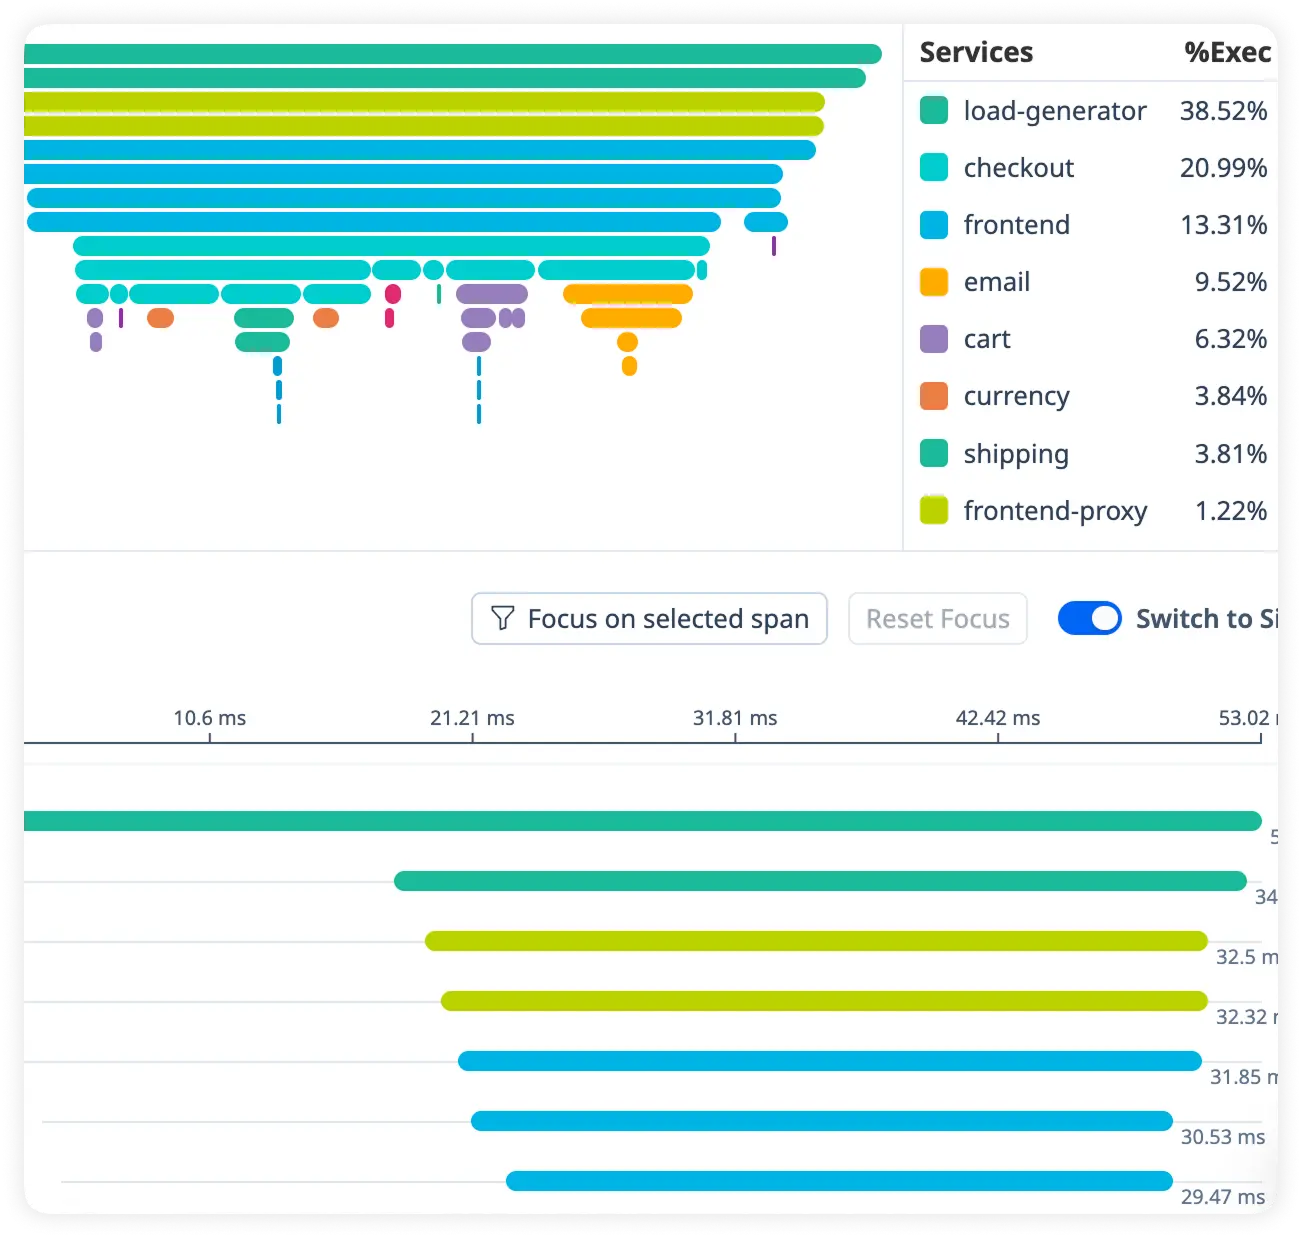
Follow Every Ruby Request Through Your Stack
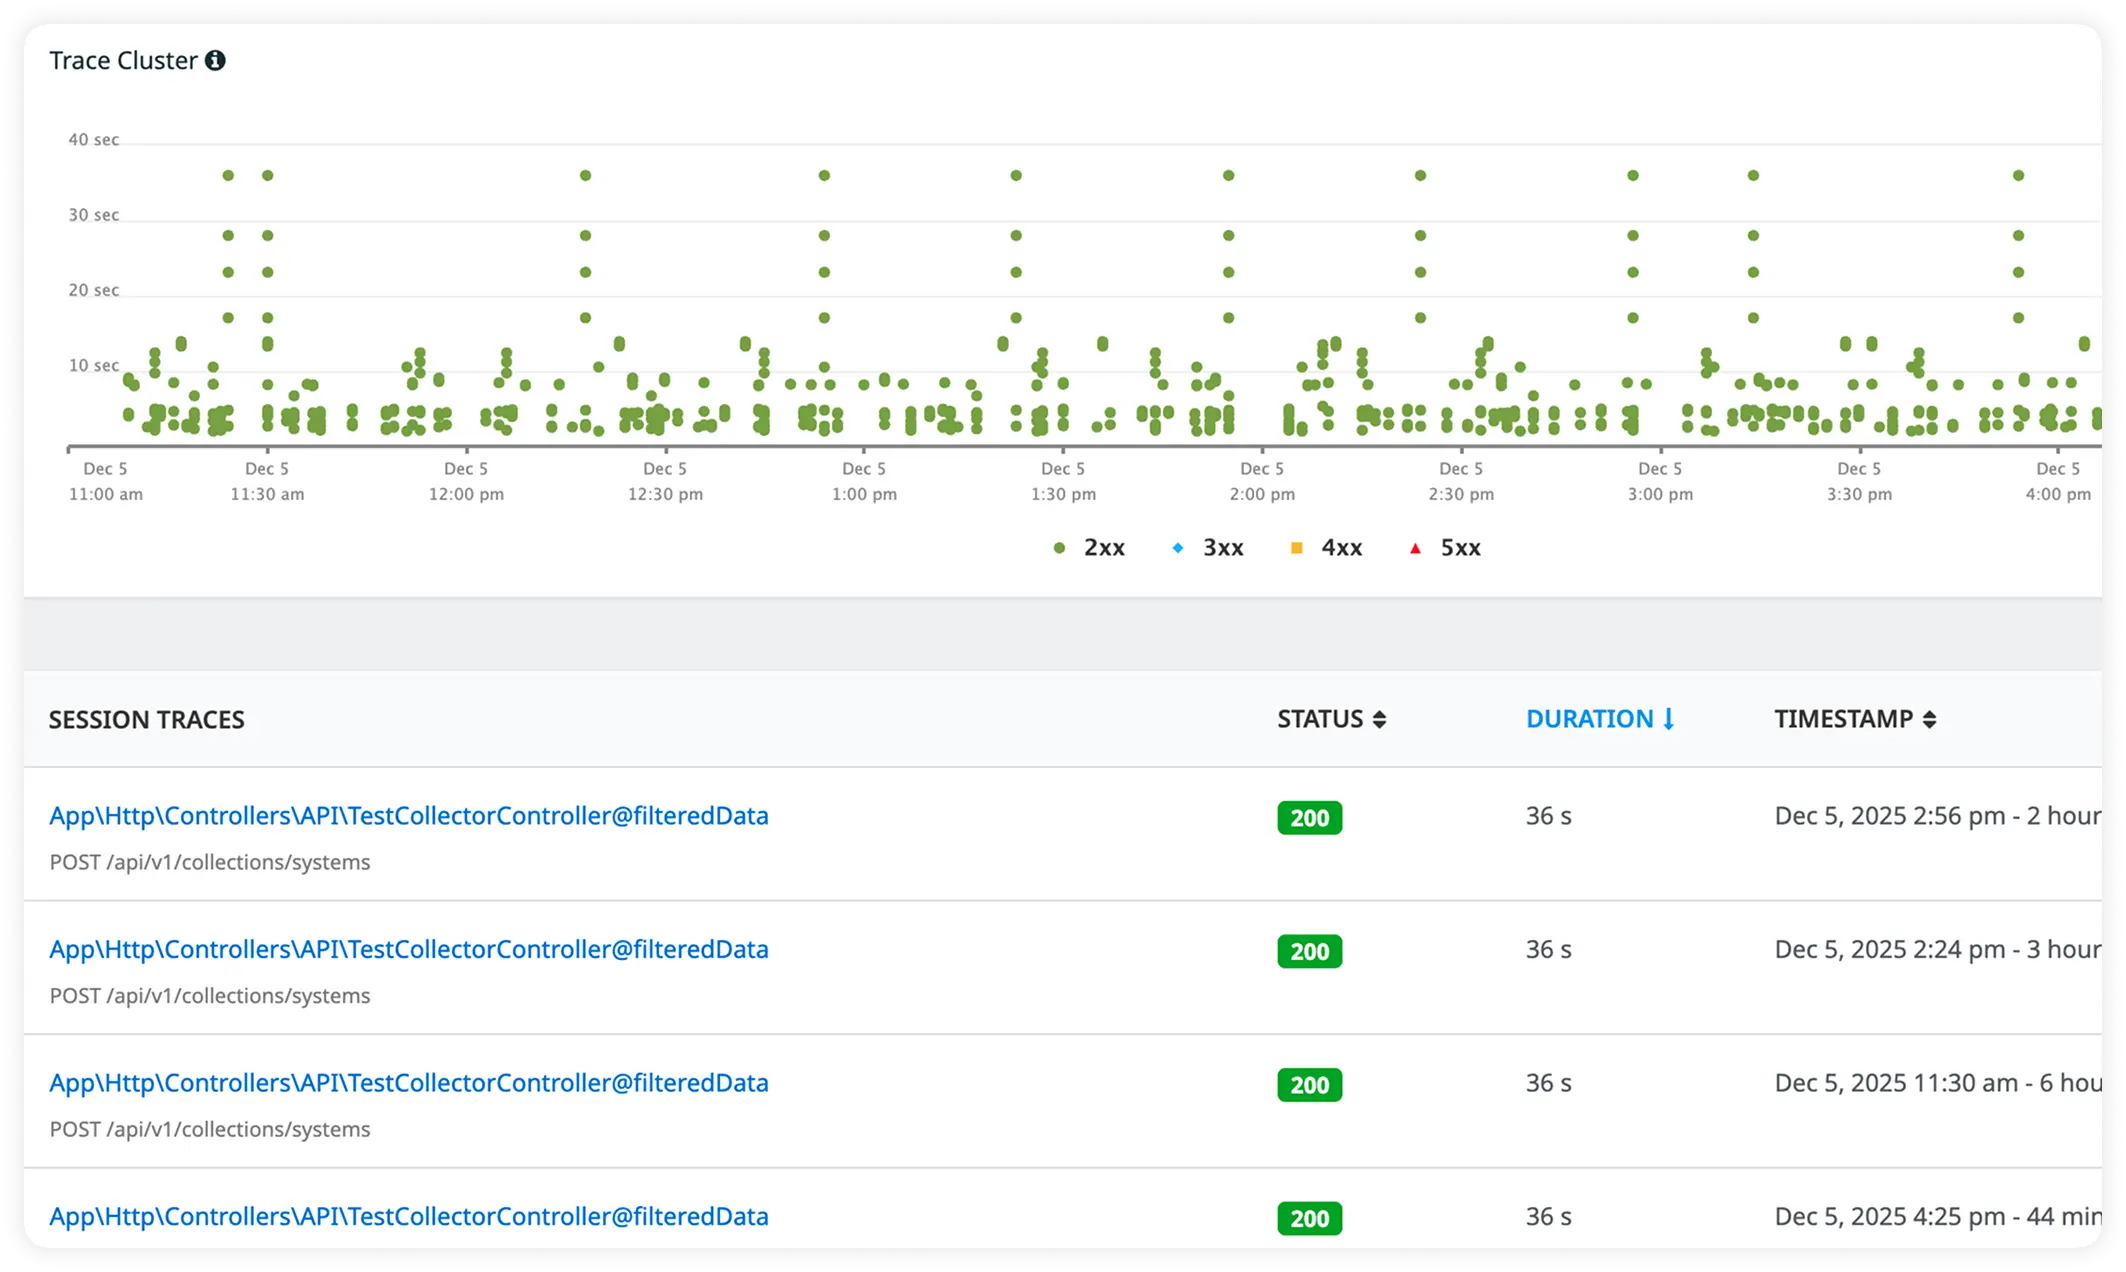
Get complete end-to-end traces across web requests, background jobs, and database interactions to understand how each part of your Ruby application behaves in production.
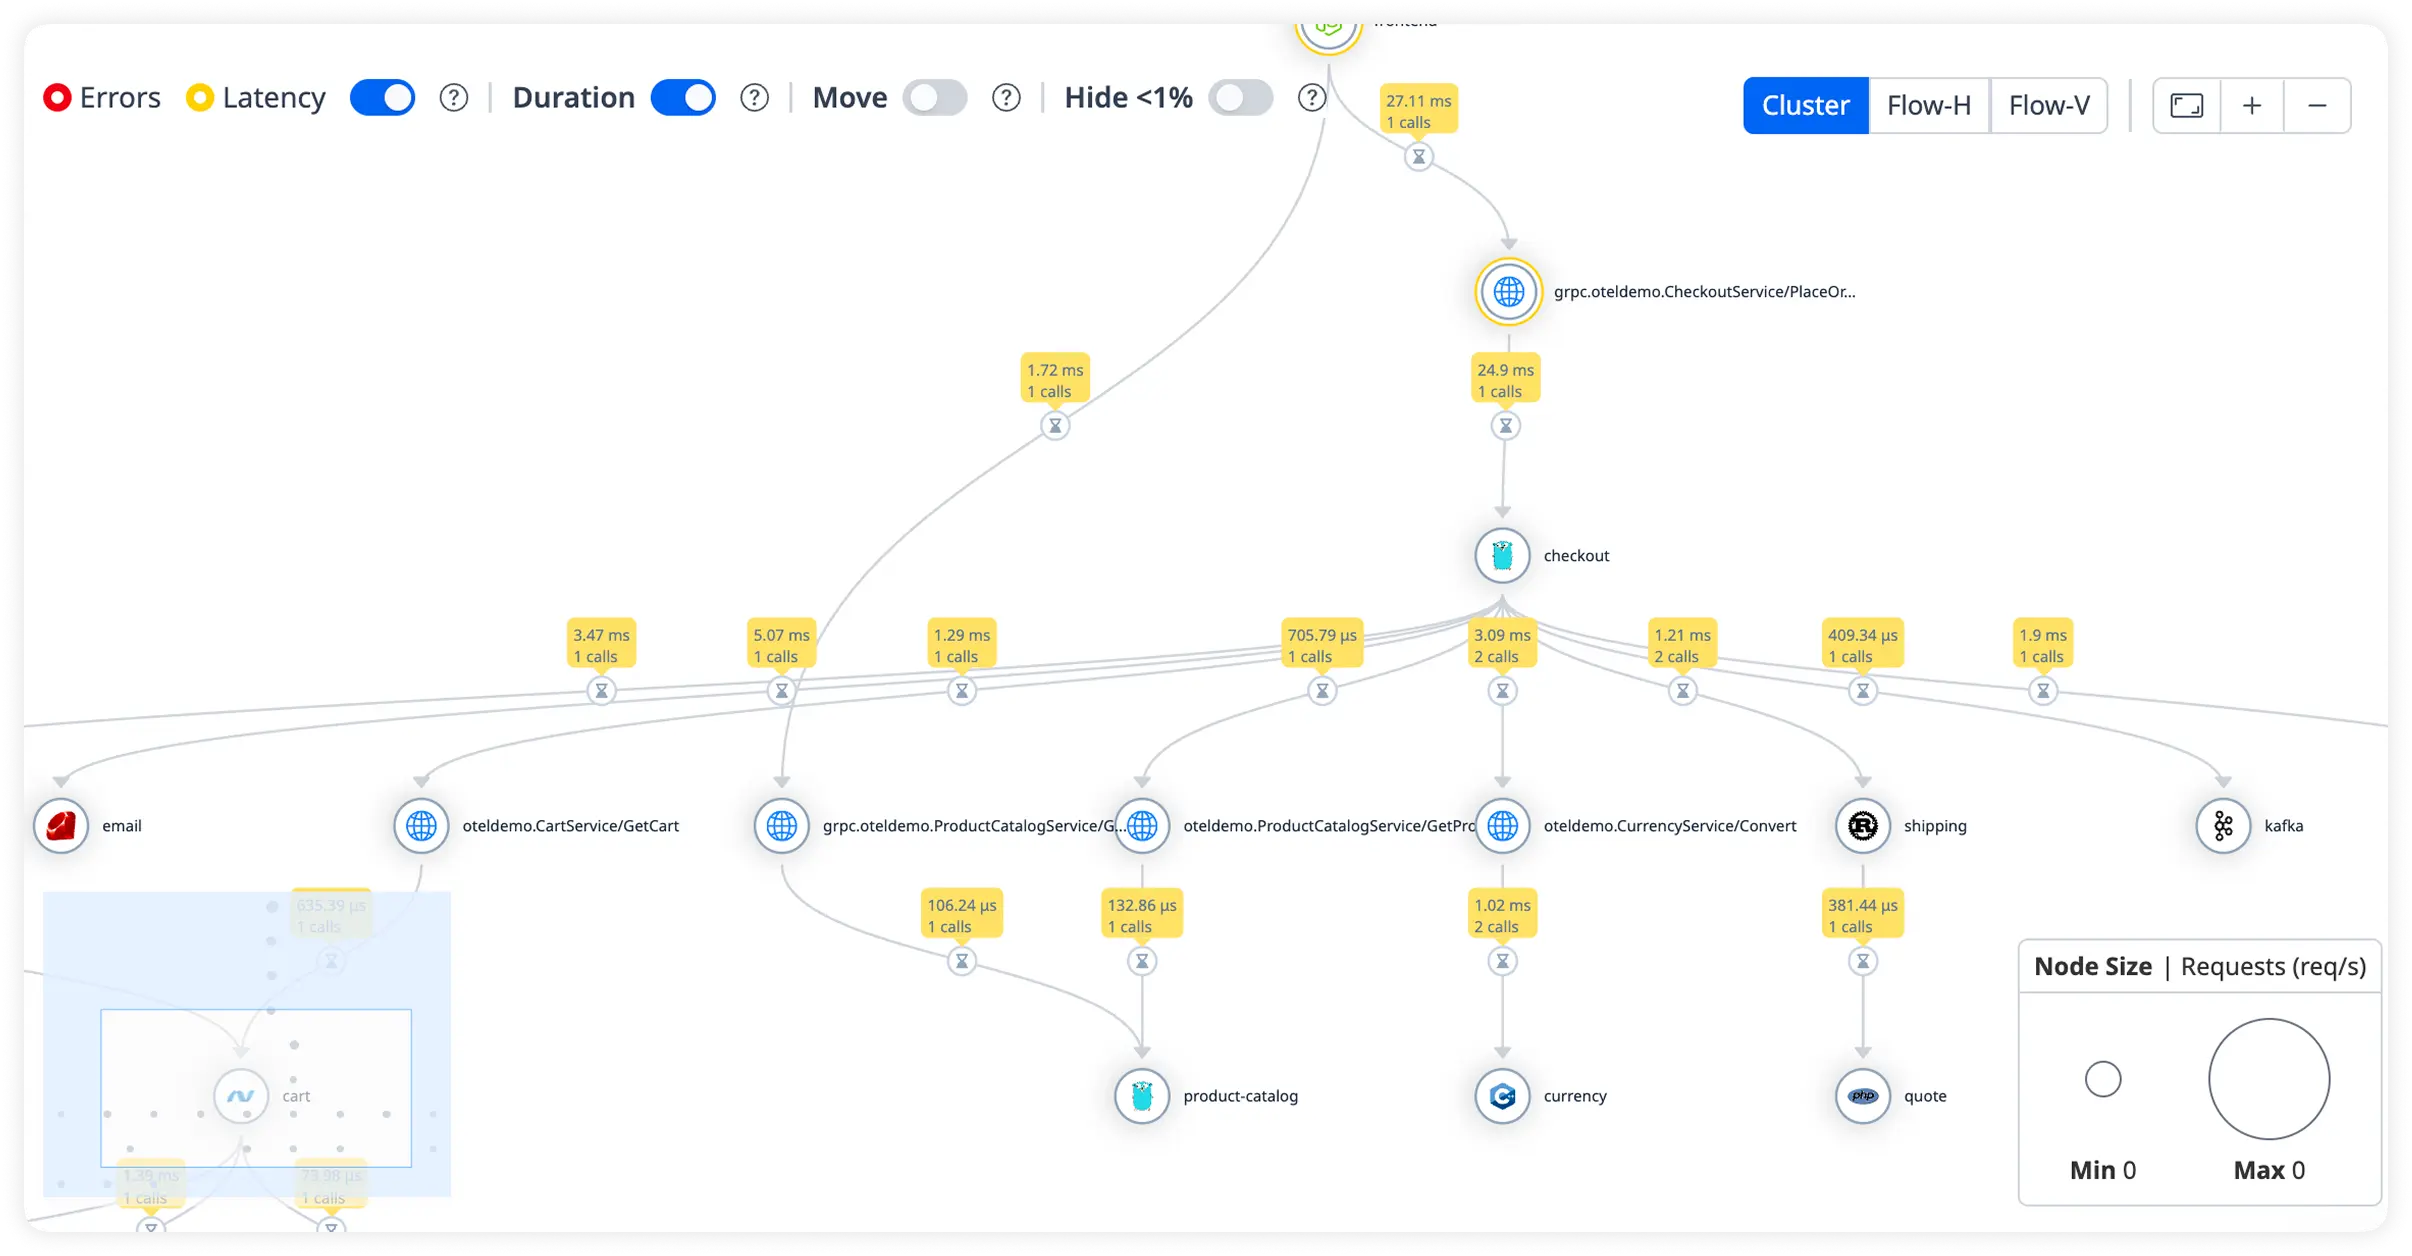
Understand How Your Ruby Services Interconnect
See relationships between your Ruby processes, databases, caching layers, and external APIs so you can uncover latency patterns, failure trends, and inter-service bottlenecks.
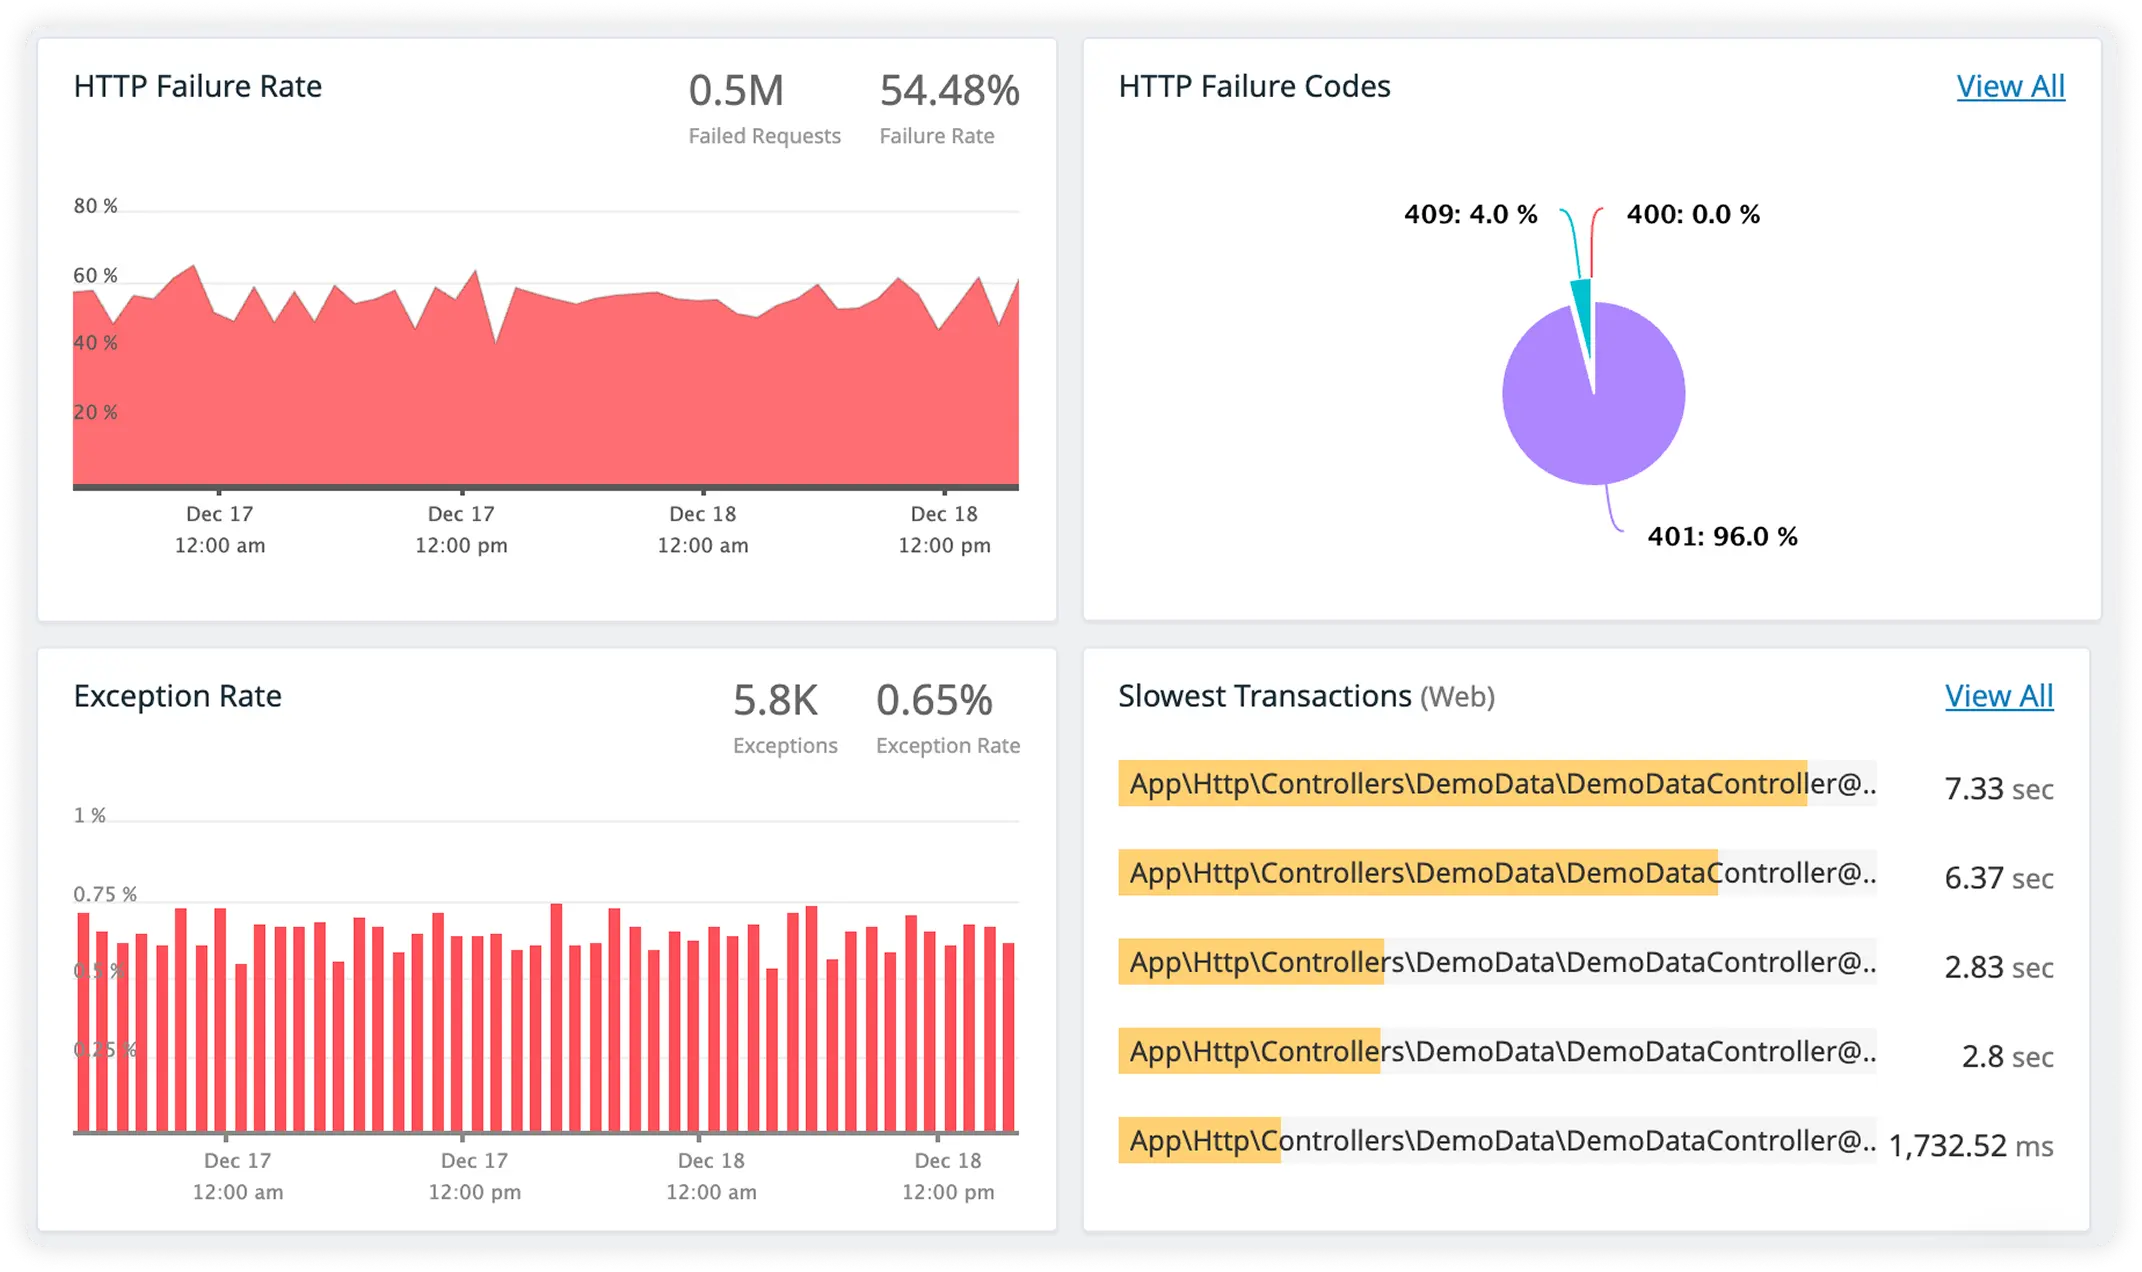
Track High-Value Ruby Transactions
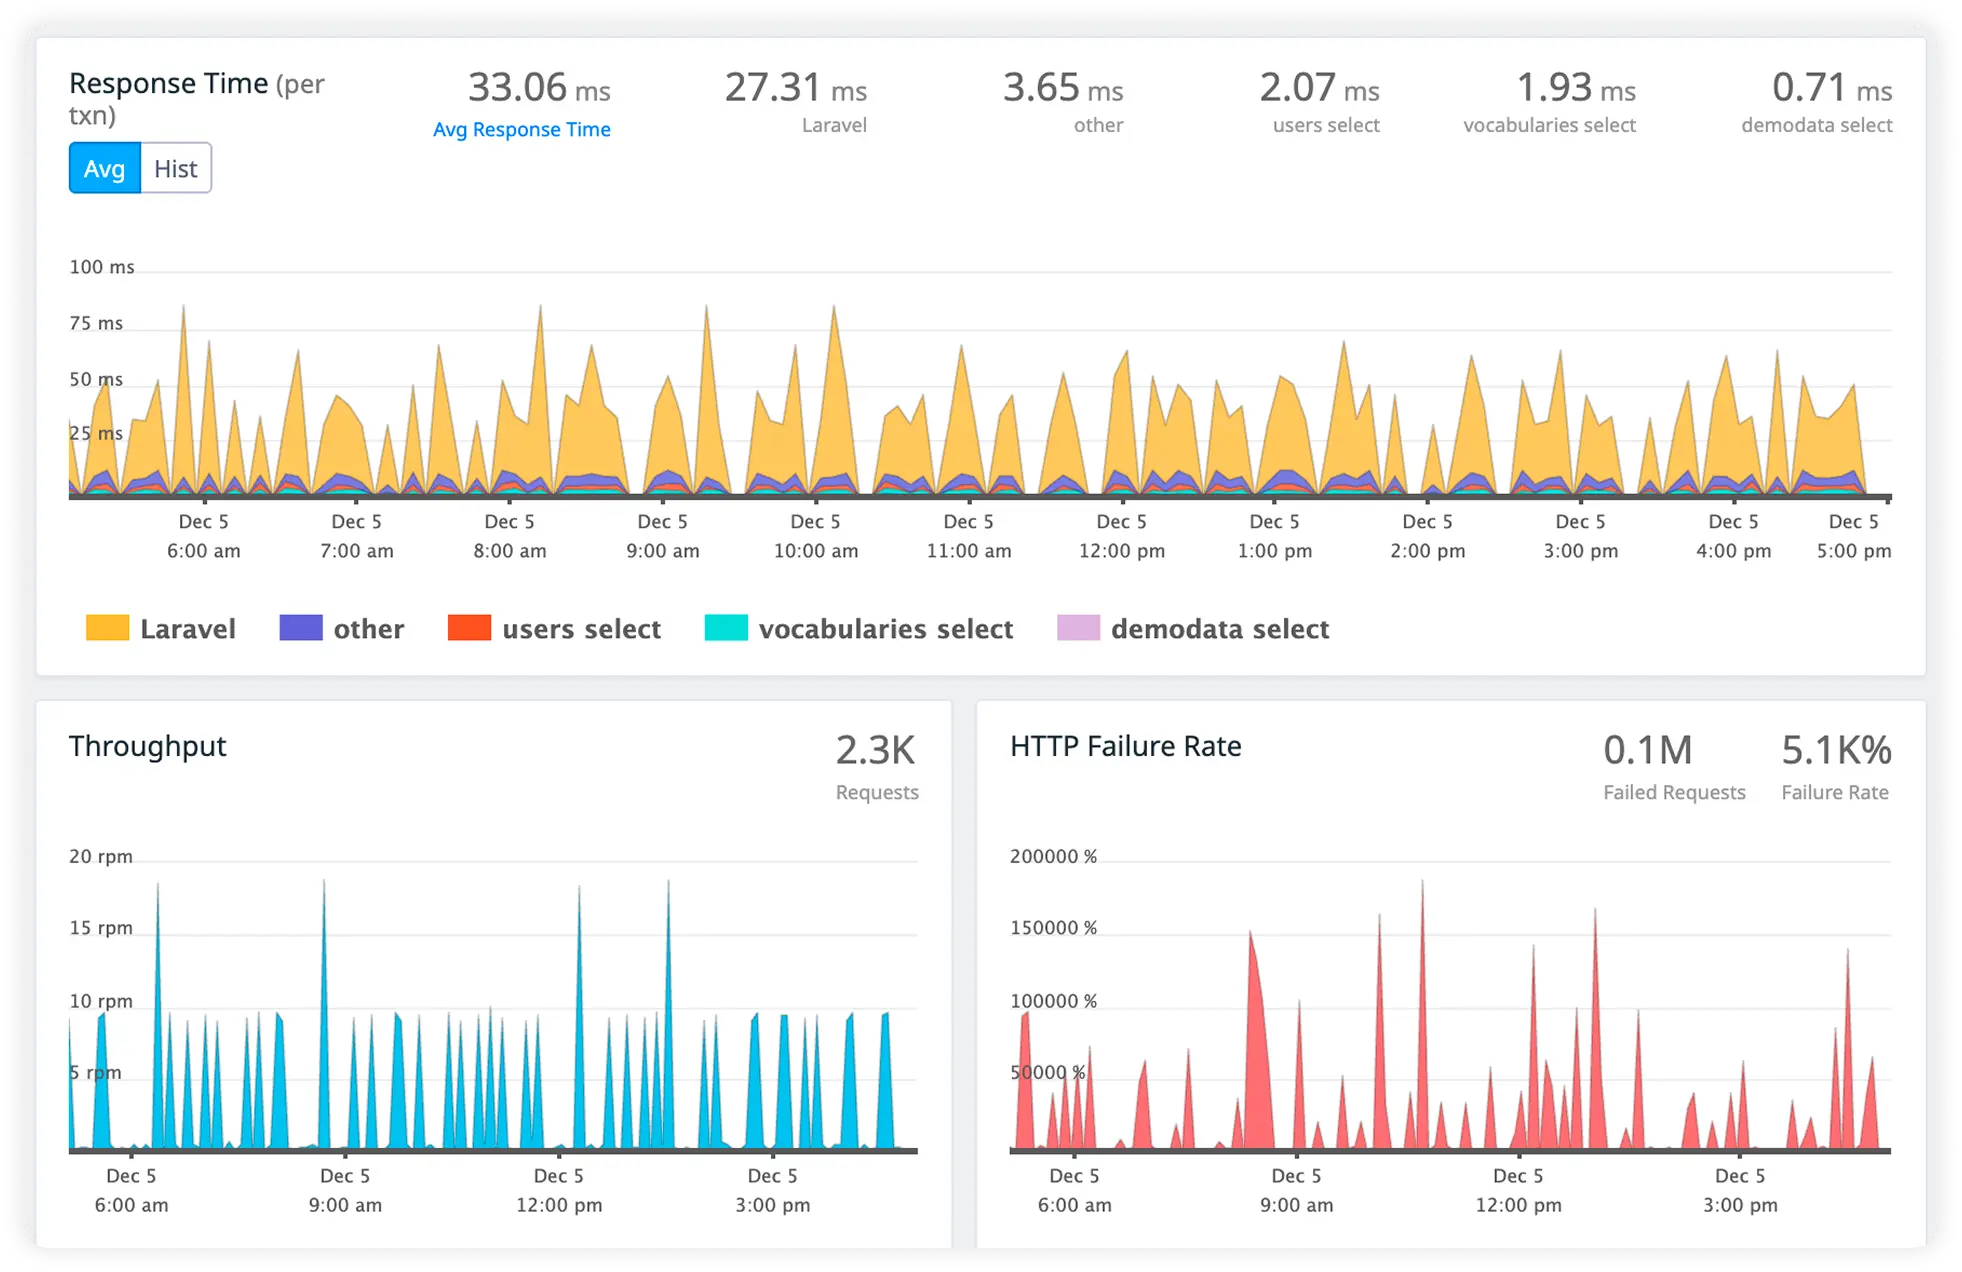
Measure key business flows like API endpoints, user sessions, and background jobs in real time to detect slow routes, rising error rates, and regressions before they impact customers.
Visibility into External Dependencies
Monitor third-party services, external APIs, and integrations your Ruby apps rely on to spot slowdowns or failures that could degrade overall application performance.
Why choose Atatus for Ruby logs and metrics monitoring?
Built for Ruby production
Atatus ingests Ruby and Rails logs from real production workloads without invasive code changes.
Framework and job awareness
Atatus understands Rails request flows, ActiveRecord operations, and background job systems like Sidekiq.
Runtime performance context
Atatus combines logs with memory usage, garbage collection, and process-level metrics.
Faster incident resolution
Atatus correlates errors, slow requests, and worker events to speed up root cause analysis.
High-concurrency ready
Atatus scales across multi-worker Ruby servers and background jobs without performance impact.
Modern environment coverage
Atatus aggregates Ruby logs and metrics across VMs, containers, and cloud infrastructure.
Unified Observability for Every Engineering Team
Atatus adapts to how engineering teams work across development, operations, and reliability.
Developers
Trace requests, debug errors, and identify performance issues at the code level with clear context.
DevOps
Track deployments, monitor infrastructure impact, and understand how releases affect application stability.
Release Engineer
Measure service health, latency, and error rates to maintain reliability and reduce production risk.