Silex Performance Monitoring
Get end-to-end visibility into your Silex performance with application monitoring tools. Gain insightful metrics on performance bottlenecks with PHP monitoring to optimize your application.
Production gaps that slow Silex teams
Request Path Ambiguity
Routing decisions and service wiring vary at runtime, making it difficult to confirm which execution paths actually handled production requests.
Limited Execution Context
Errors surface without sufficient runtime state, forcing engineers to reconstruct timing, dependencies, and call flow manually.
Slow Fault Localization
As systems expand, isolating the first failing component takes longer, extending incident resolution beyond acceptable limits.
Hidden Dependency Latency
Internal integrations and external services introduce delays that remain invisible until performance degrades across the system.
Noisy Failure Signals
Production alerts lack precision, pushing teams to triage symptoms before identifying the actual execution breakdown.
Unclear Scale Behavior
Concurrency and traffic growth alter runtime characteristics in ways teams cannot clearly observe or reason about.
Reactive Incident Response
Teams respond after impact spreads because early degradation signals lack clarity or arrive too late to act on.
Declining Signal Trust
Repeated blind investigations reduce confidence in production data, slowing decision-making during critical incidents.
Complete Performance Visibility for
Silex Applications
Real-time observability for Silex workloads that helps teams trace request performance, understand framework overhead, and resolve production issues faster.
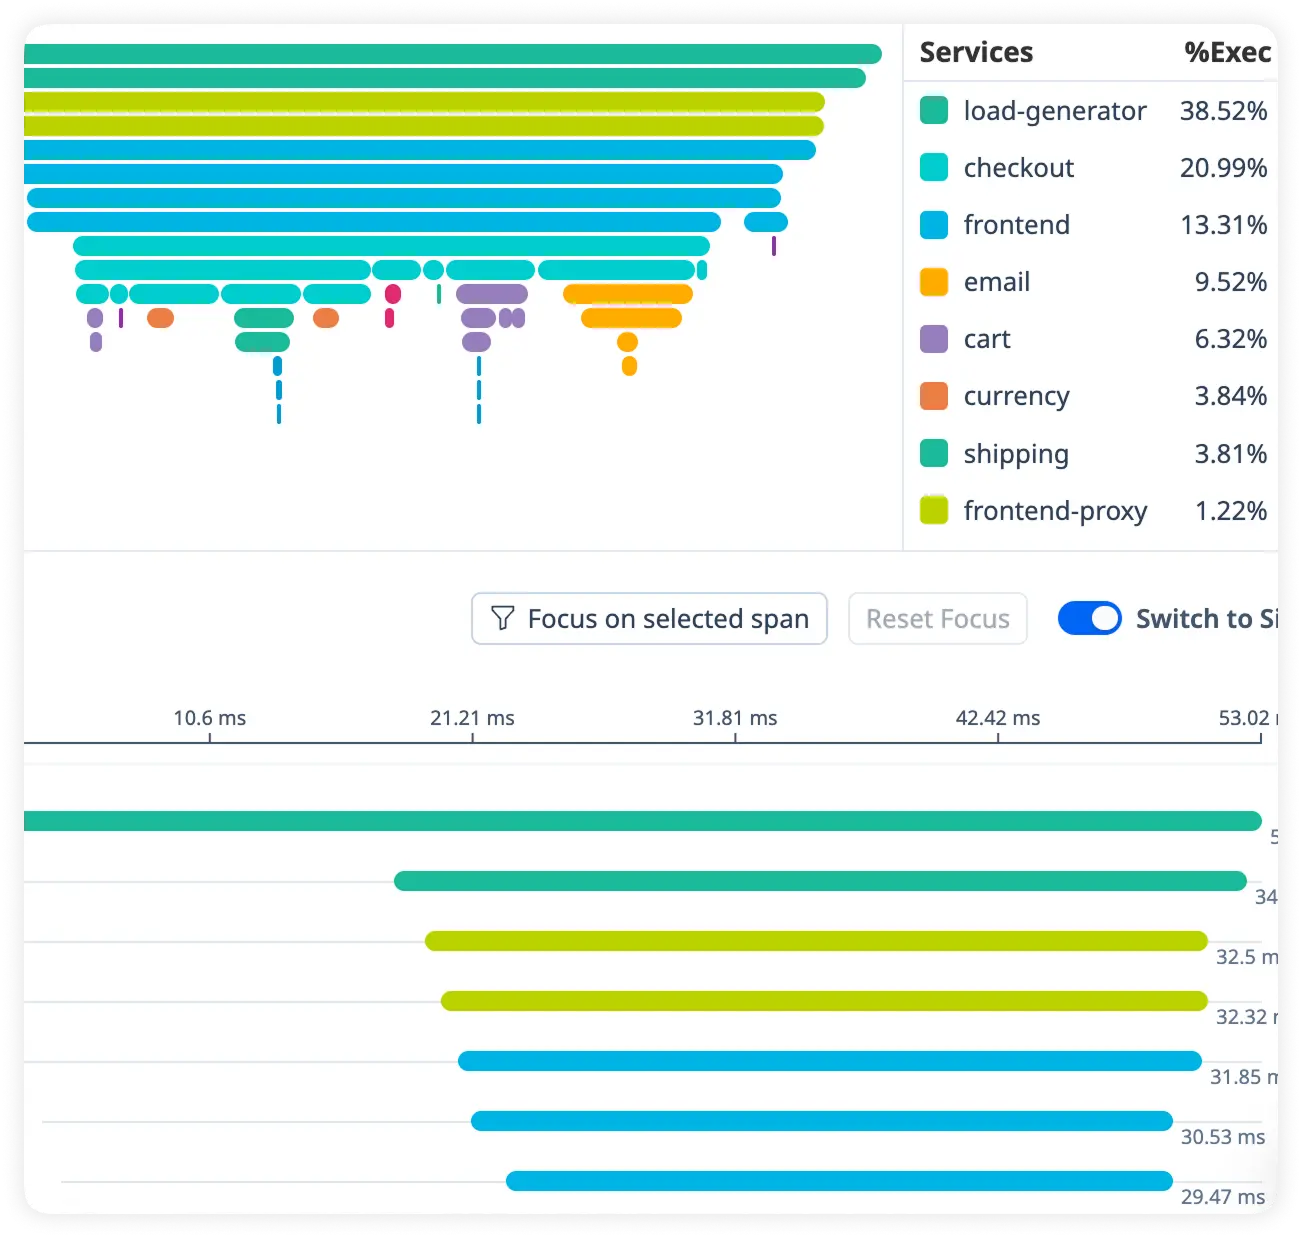
End-to-End Request Timing
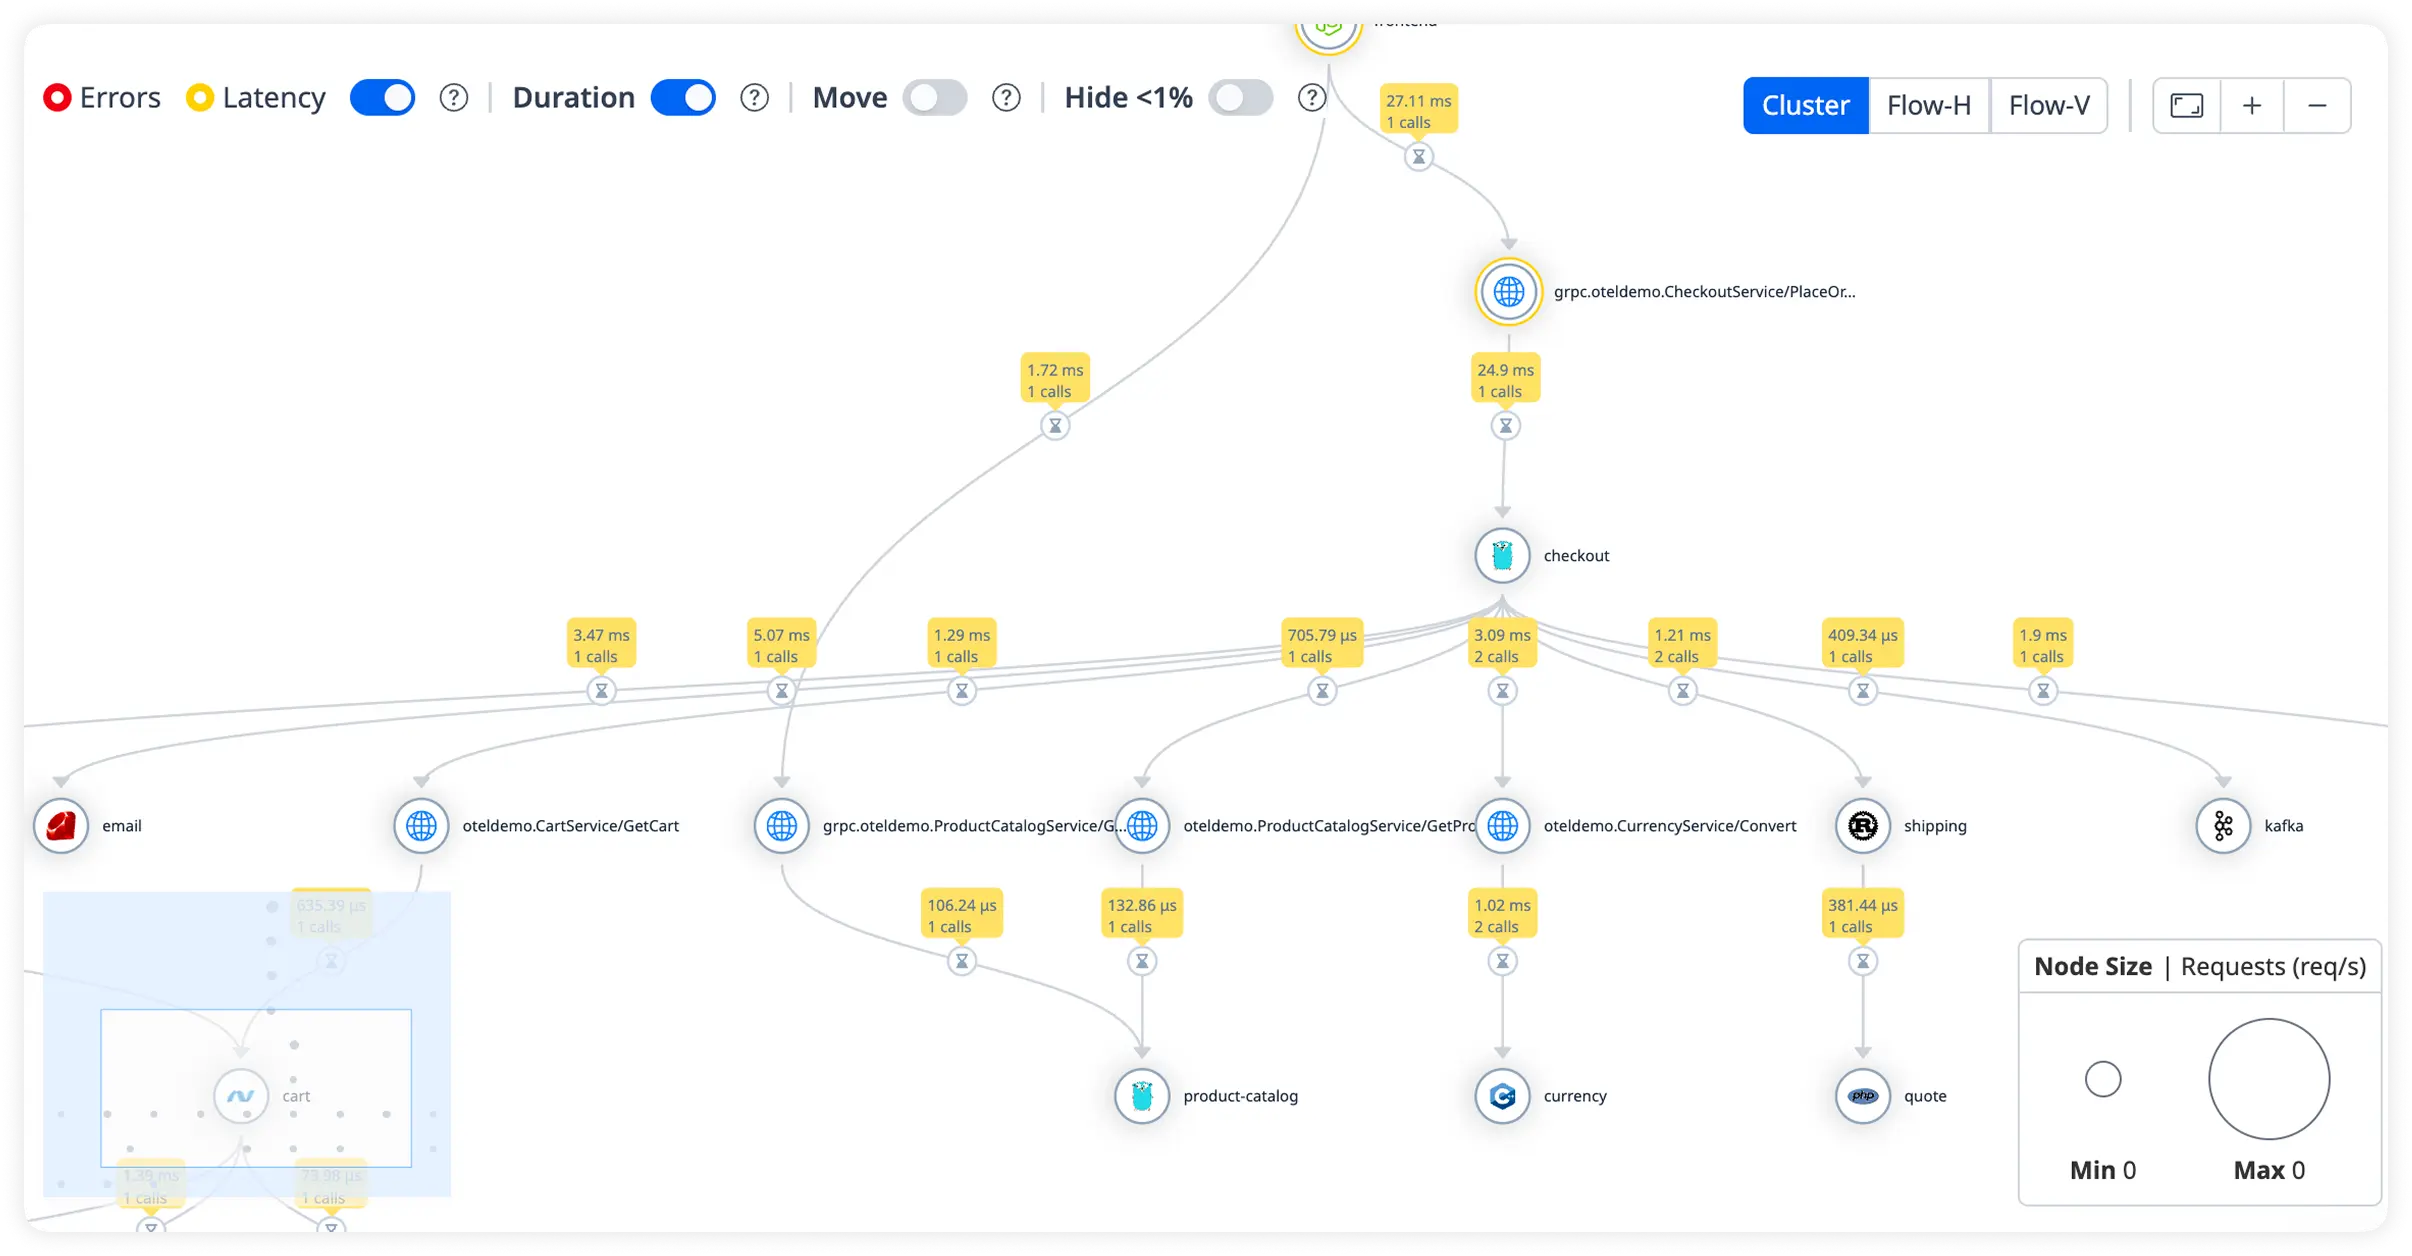
Track the full lifecycle of every request from entry to response. Quickly identify latency introduced across the framework, handlers, and dependencies.
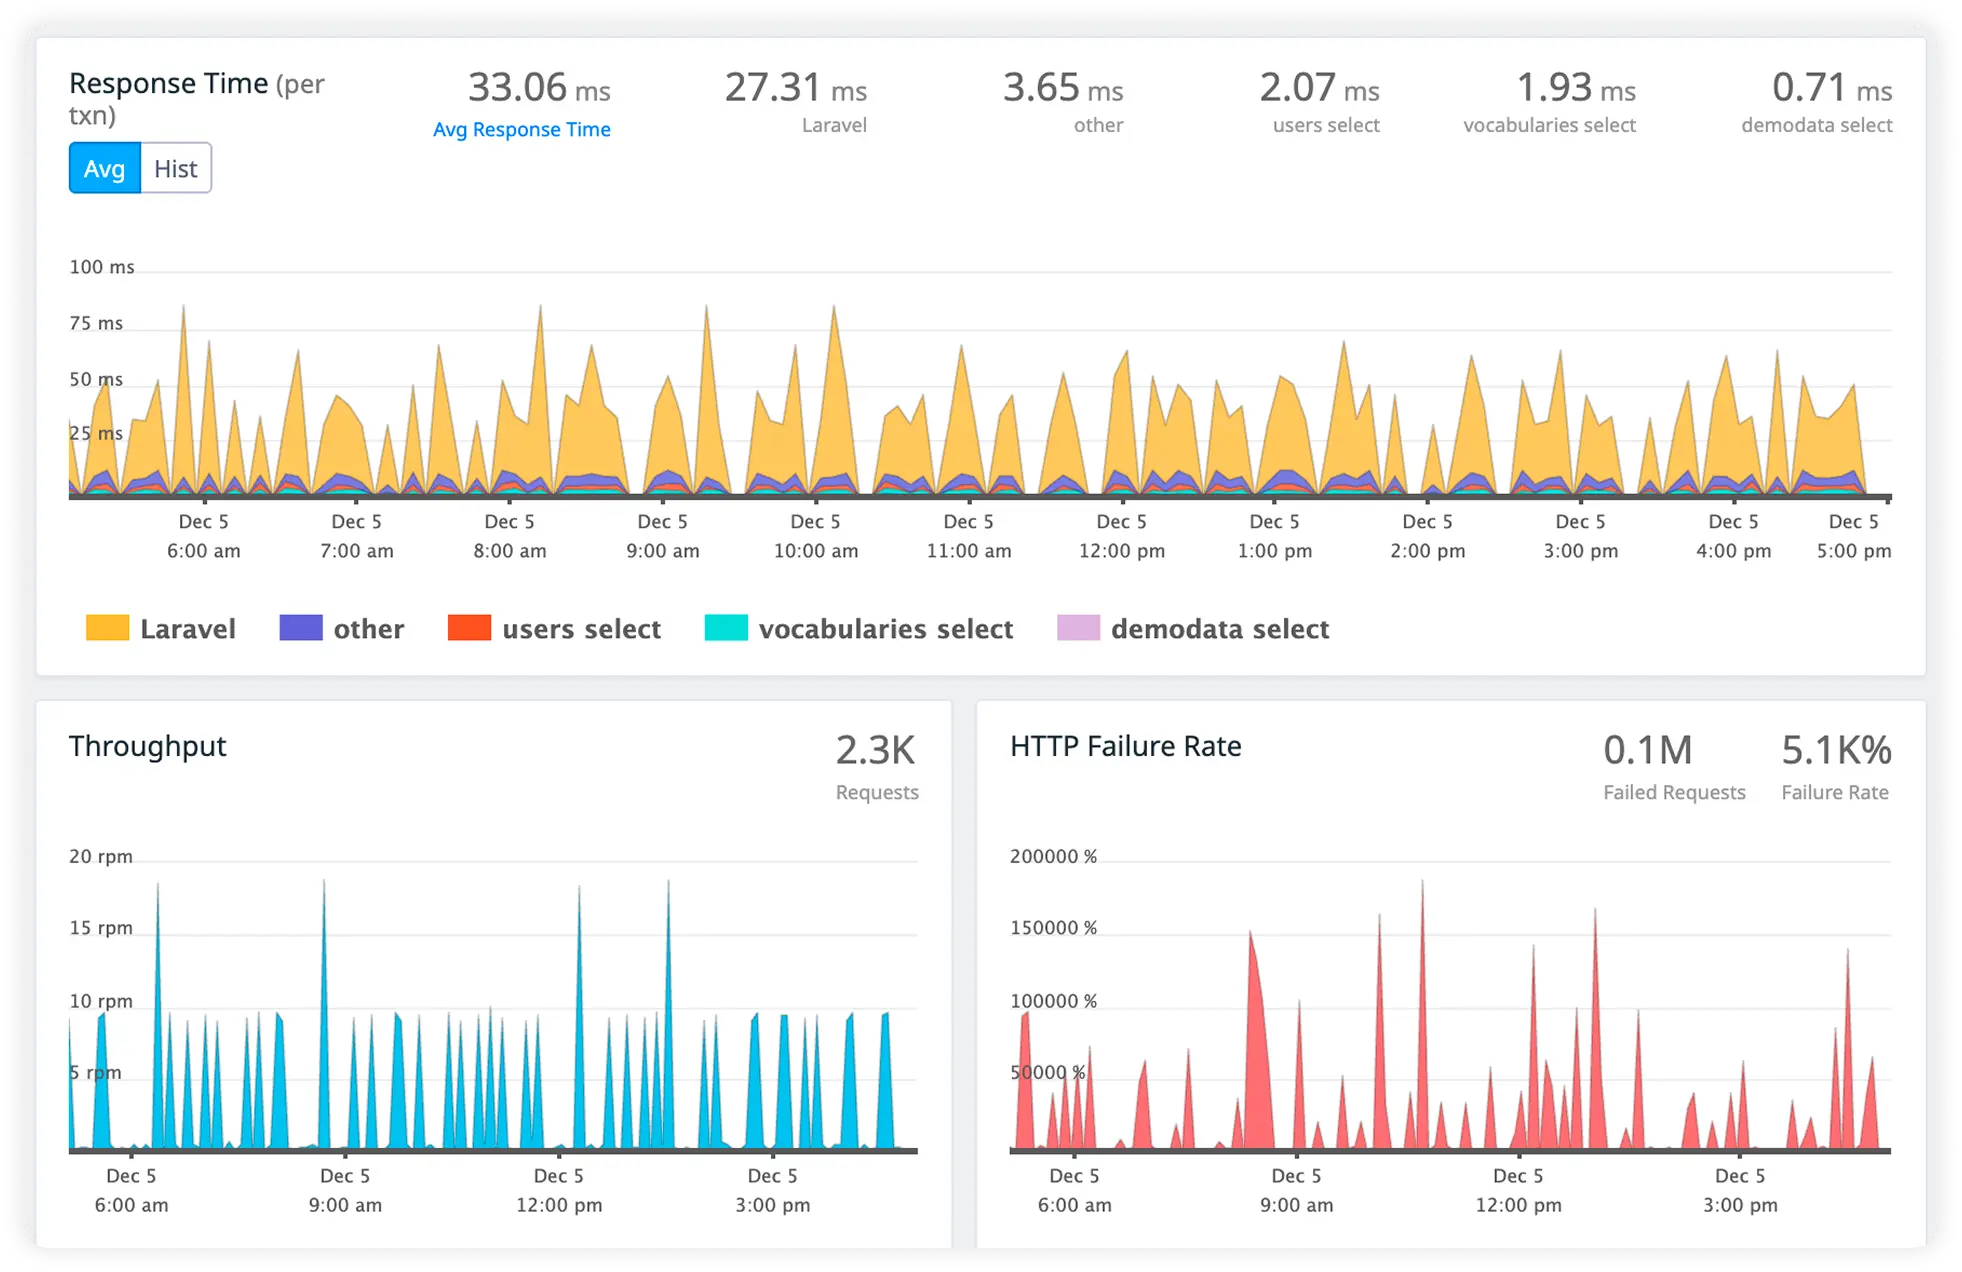
Response Timing
Monitor reponse time, throughput and http failure rate in real time. Eliminate inefficient queries slowing application responses.
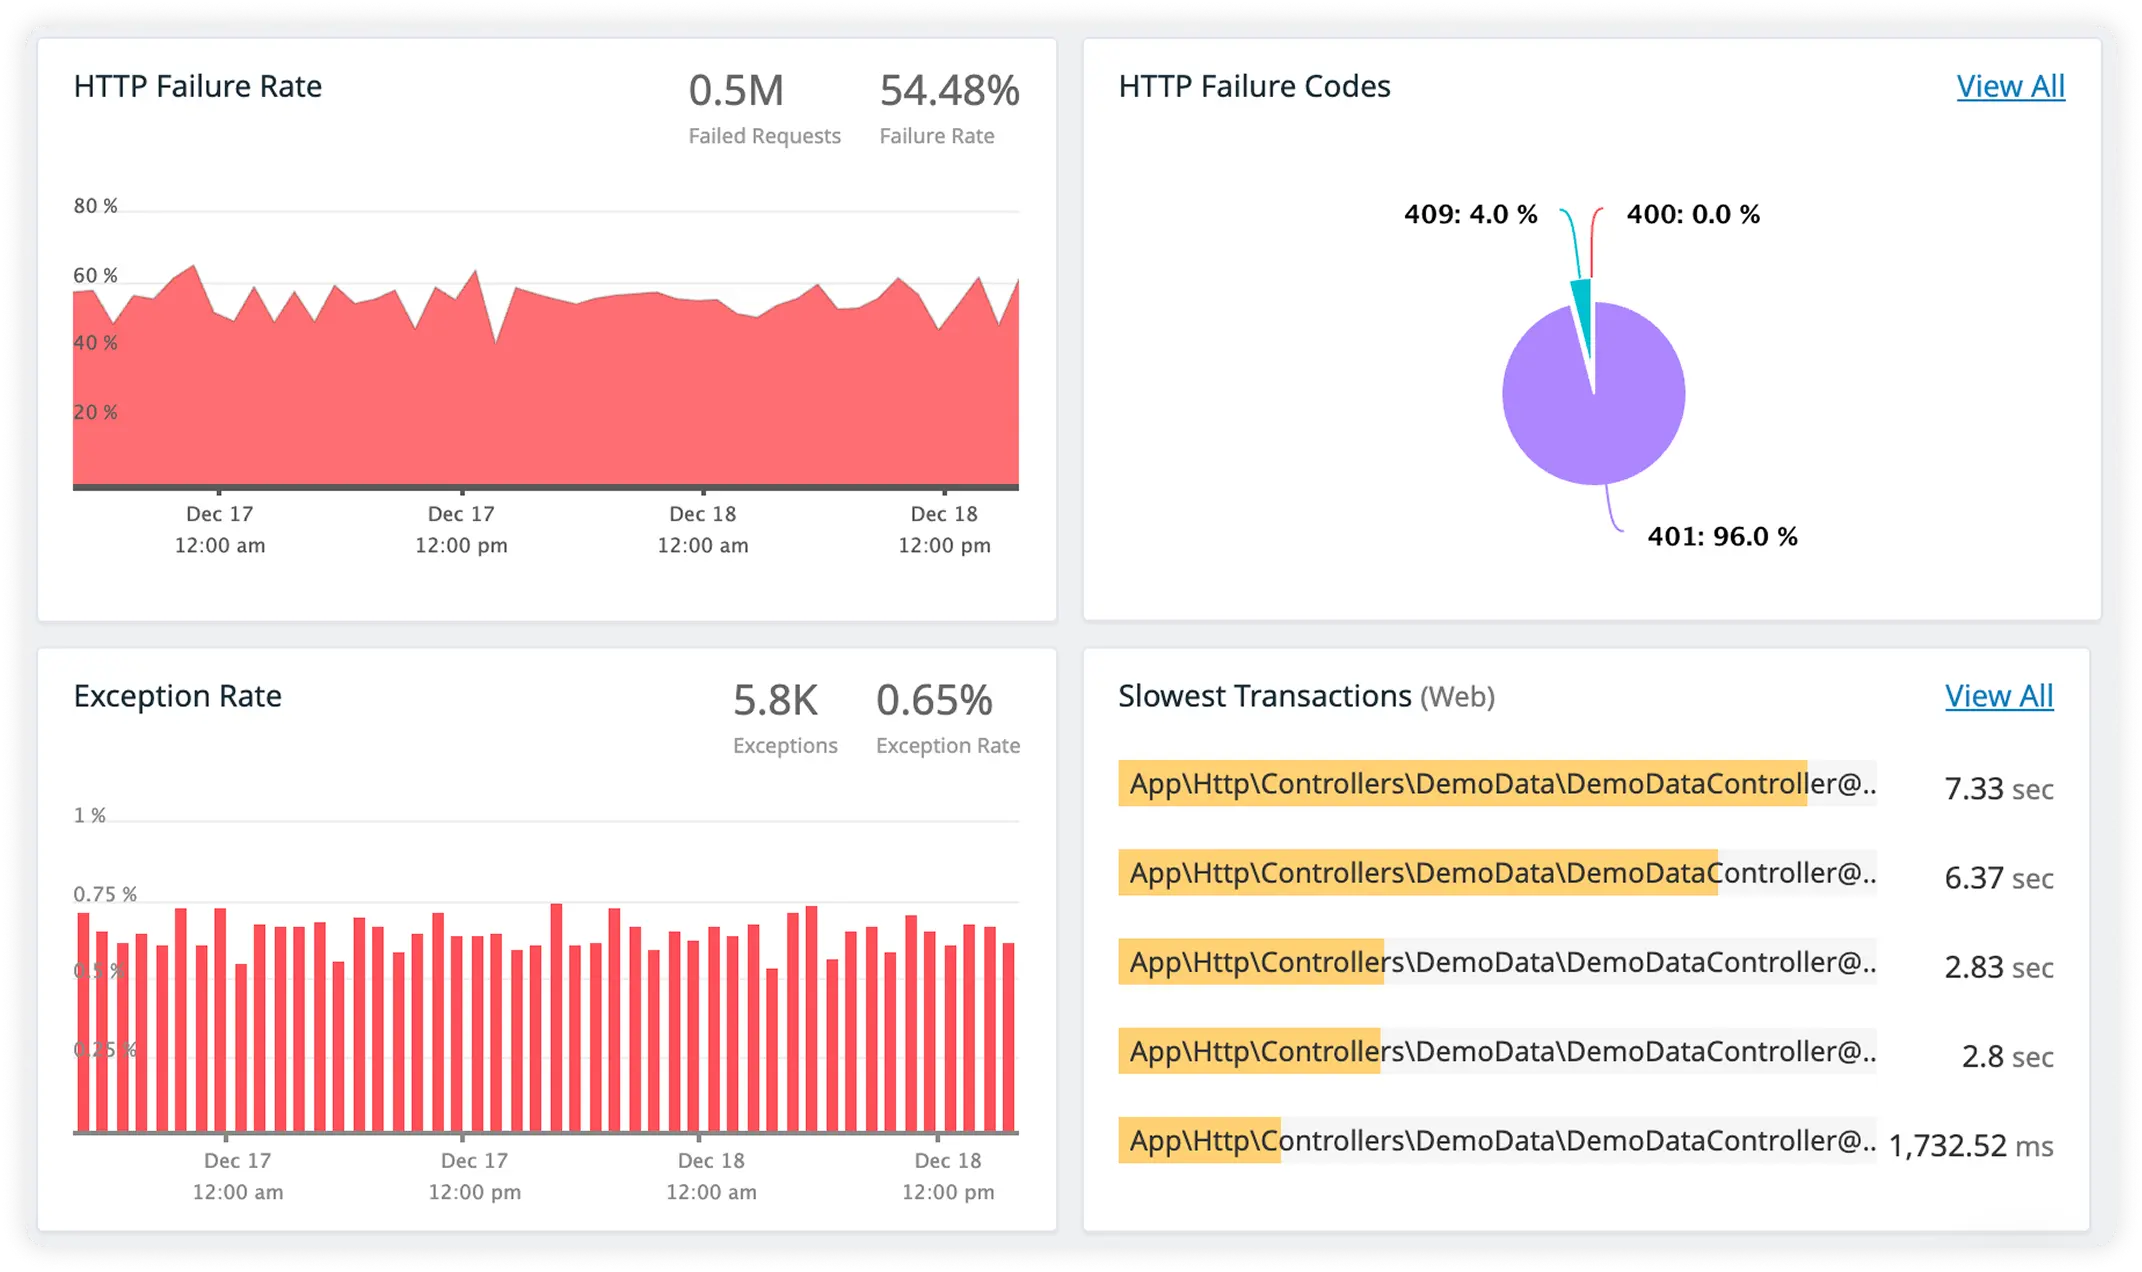
External Call Latency
Track response times for third-party APIs and external services. Identify slow dependencies before they impact user experience.
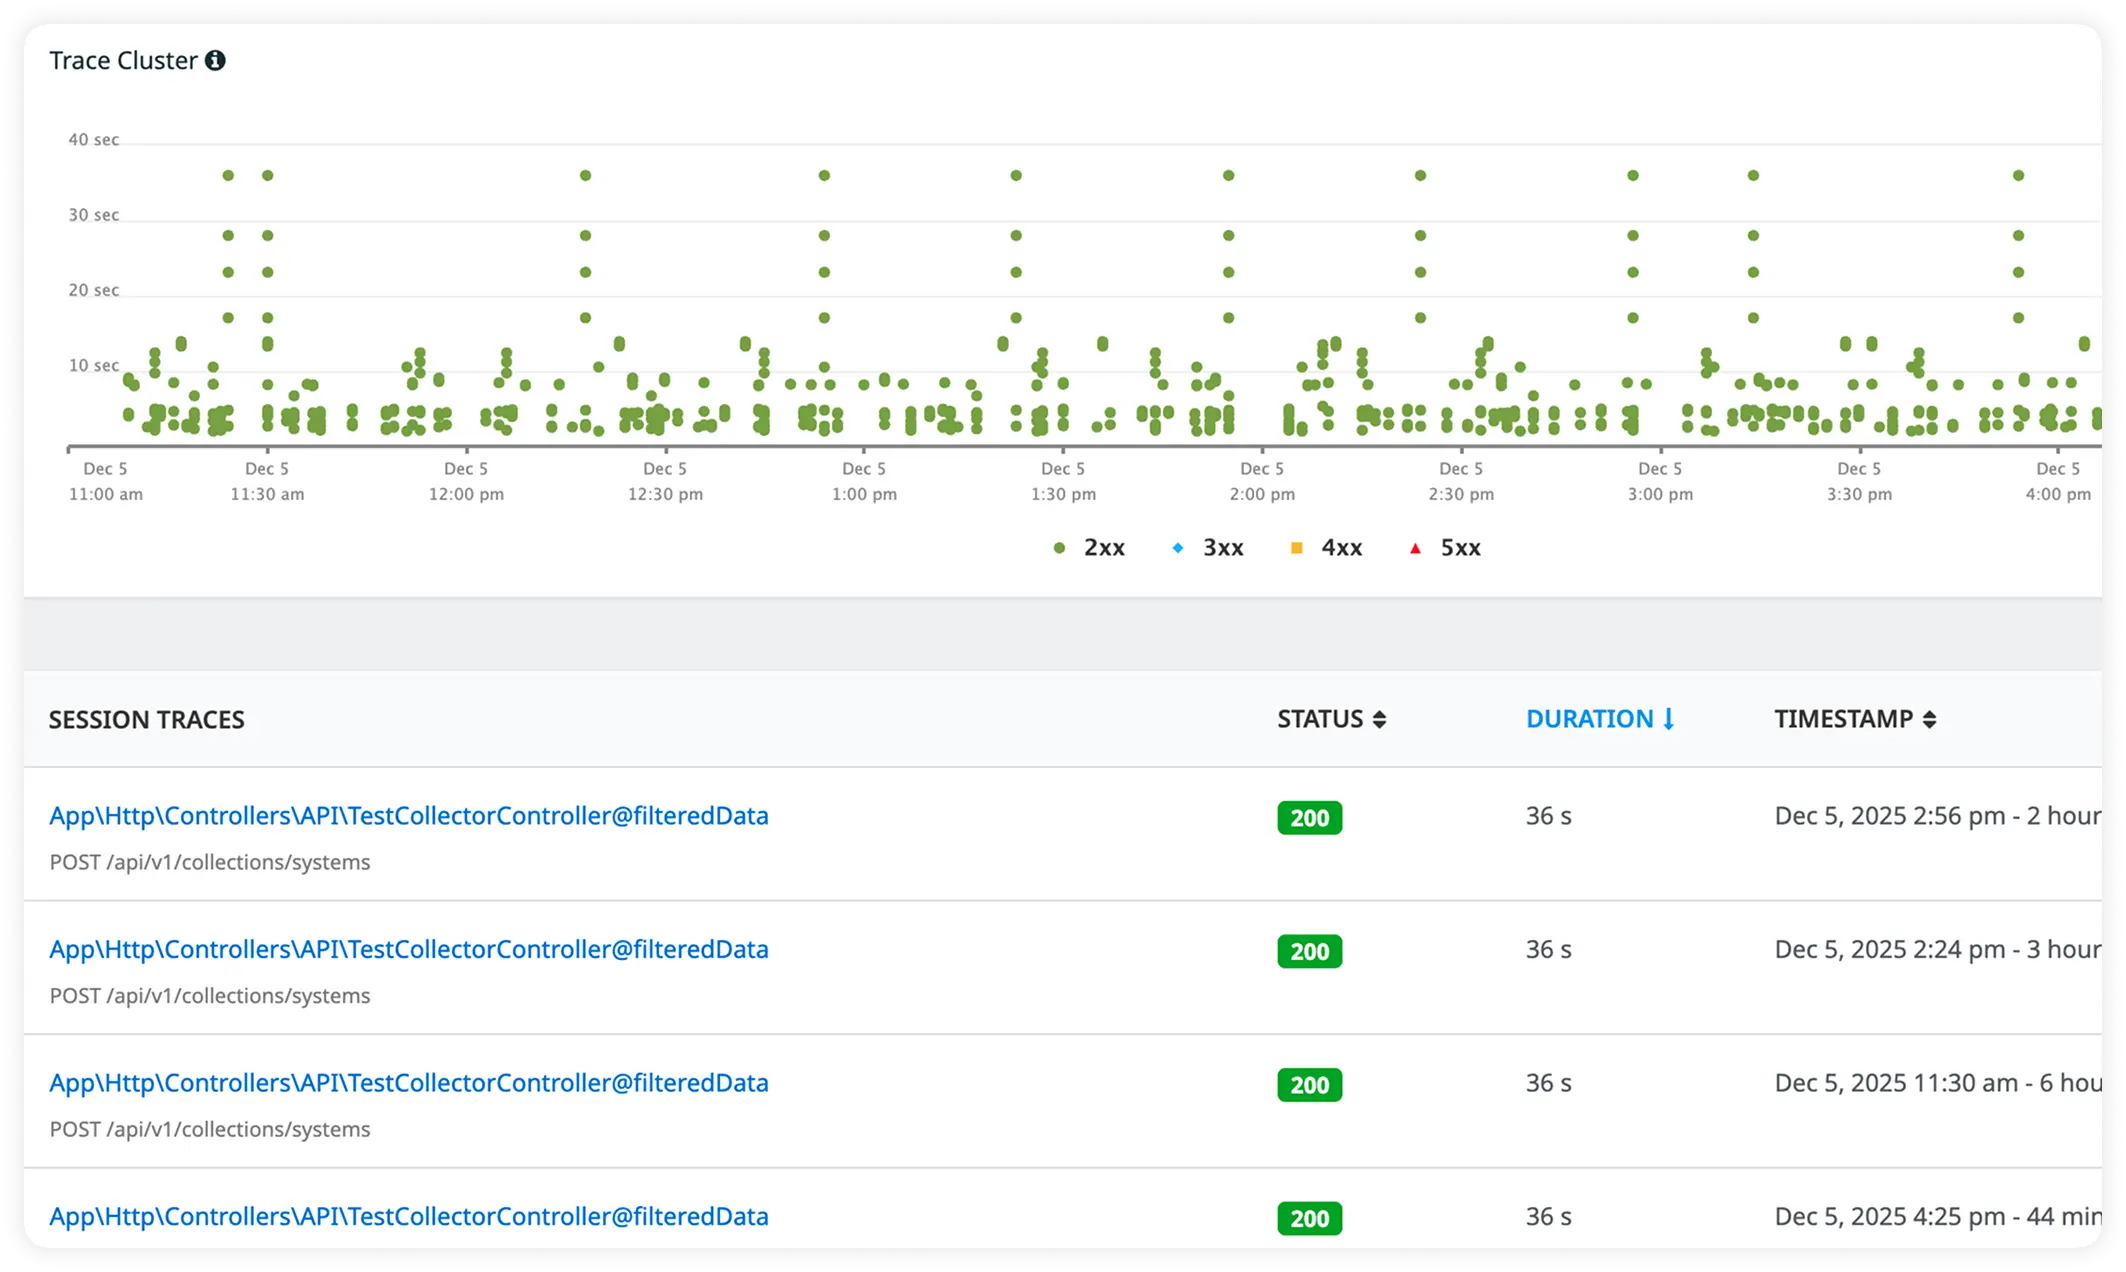
Framework Overhead Insight with Infrastructure Metrics
Understand framework processing cost while monitoring host CPU, memory, and resource usage. Correlate application performance with infrastructure behavior.
Why engineering teams standardize on Atatus
As Silex systems evolve, teams need a consistent way to understand real production behavior under load, failure, and change. Atatus is chosen because it preserves execution clarity, aligns engineers around the same runtime truth, and maintains confidence when systems scale beyond individual ownership.
Consistent Runtime Narrative
Engineers can follow how execution unfolds in production without stitching together partial or conflicting signals.
Fast Team Alignment
New and existing engineers share the same production understanding without relying on tribal knowledge.
Immediate Signal Confidence
Teams trust runtime data early in investigations, enabling faster and more decisive incident response.
Lower Investigation Overhead
Engineers spend less time correlating systems and more time validating root causes.
Predictable Incident Flow
Response patterns remain consistent even as services, traffic, and ownership expand.
Shared Operational View
Platform, SRE, and backend teams reference the same execution evidence during incidents.
Stable Under Load
Production understanding remains intact as concurrency and traffic increase.
Reduced On-Call Fatigue
Clear runtime insight lowers stress and shortens high-severity incident cycles.
Durable Trust Over Time
As systems evolve, production clarity remains reliable rather than degrading with complexity.
Unified Observability for Every Engineering Team
Atatus adapts to how engineering teams work across development, operations, and reliability.
Developers
Trace requests, debug errors, and identify performance issues at the code level with clear context.
DevOps
Track deployments, monitor infrastructure impact, and understand how releases affect application stability.
Release Engineer
Measure service health, latency, and error rates to maintain reliability and reduce production risk.