Spring Performance Monitoring
Get end-to-end visibility into your Spring performance with application monitoring tools. Gain insightful metrics on performance bottlenecks with Java monitoring to optimize your application.
Why Spring Production Issues Are Difficult to Explain?
Missing Distributed Traces
Teams lose hours chasing request flows across Spring Boot microservices without end-to-end visibility into async calls and service hops. Partial logs fail to link frontend errors to backend database stalls. Production incidents recur as engineers guess propagation paths.
Blind JVM Behavior
Garbage collection pauses evade detection in high-load Spring apps. Heap dumps reveal leaks post-outage, but real-time profiling stays absent. Thread contention locks up endpoints unnoticed until throughput crashes.
Slow Database Queries
N+1 queries overwhelm HikariCP pools in scaled Spring deployments. Index misses and unoptimized joins spike latency without query-level traces. SREs scramble to reproduce prod loads for fixes.
Unseen Resource Contention
Tomcat threads block during peak traffic in Spring Boot clusters. CPU-bound handlers and memory thrashing degrade SLAs silently. Load balancers mask single-instance failures until cascading outages hit.
Opaque Dependency Failures
Circuit breaker trips in Feign clients go undetected across Spring services. External API timeouts cascade without failure propagation traces. Backend teams debug symptoms, not root service dependencies.
Scale-Induced Bottlenecks
Horizontal scaling exposes weak session handling in Spring sessions. Stateful beans across instances cause data inconsistency under autoscaling. Platform engineers rework architectures post-scale failures.
Elusive Memory Leaks
Off-heap growth sustains in Spring Boot caches during long runs. Metaspace exhaustion halts JVMs without leak path profiling. Frequent restarts disrupt prod stability for backend teams.
Prolonged Outage Debugging
Logs fail to correlate exceptions across distributed Spring transactions. Stack traces bury transaction rollbacks in noise. SREs pivot through siloed tools, delaying MTTR in complex deployments.
End-to-End Performance Visibility for
Spring Applications
Real-time observability for Spring workloads that helps teams understand request flow, optimize performance, and resolve production issues faster.
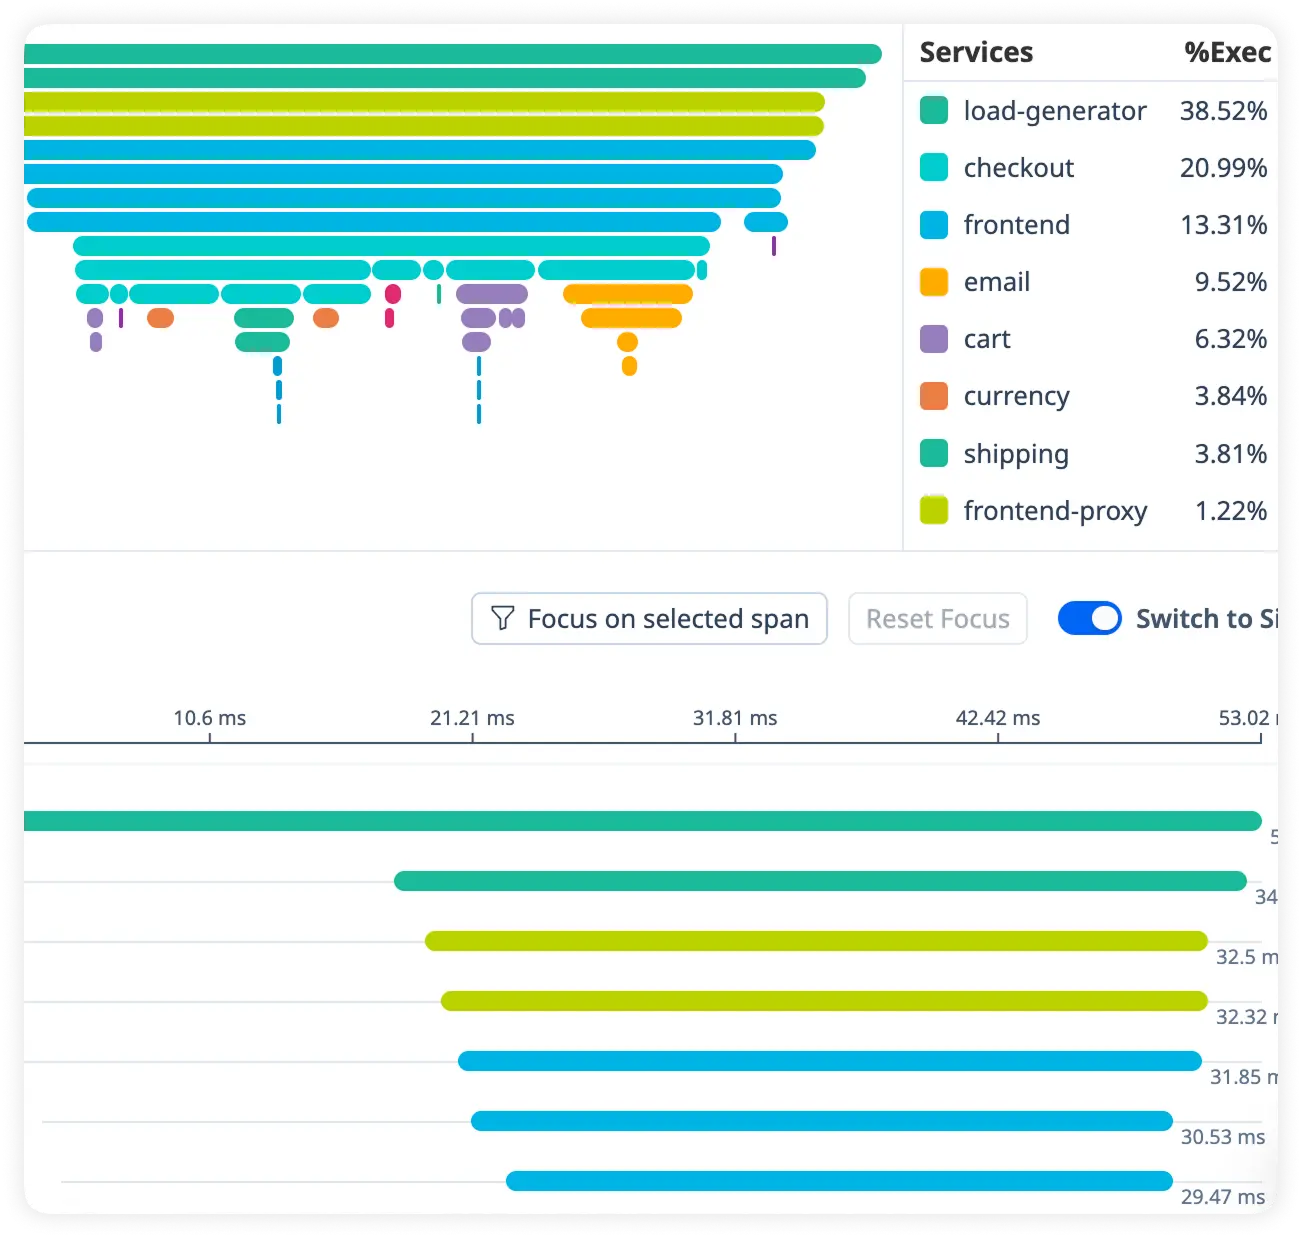
Detailed Request Timing Breakdown
See exactly how long each request takes across controllers, services, and internal processing layers. Quickly uncover slow execution paths affecting response times.
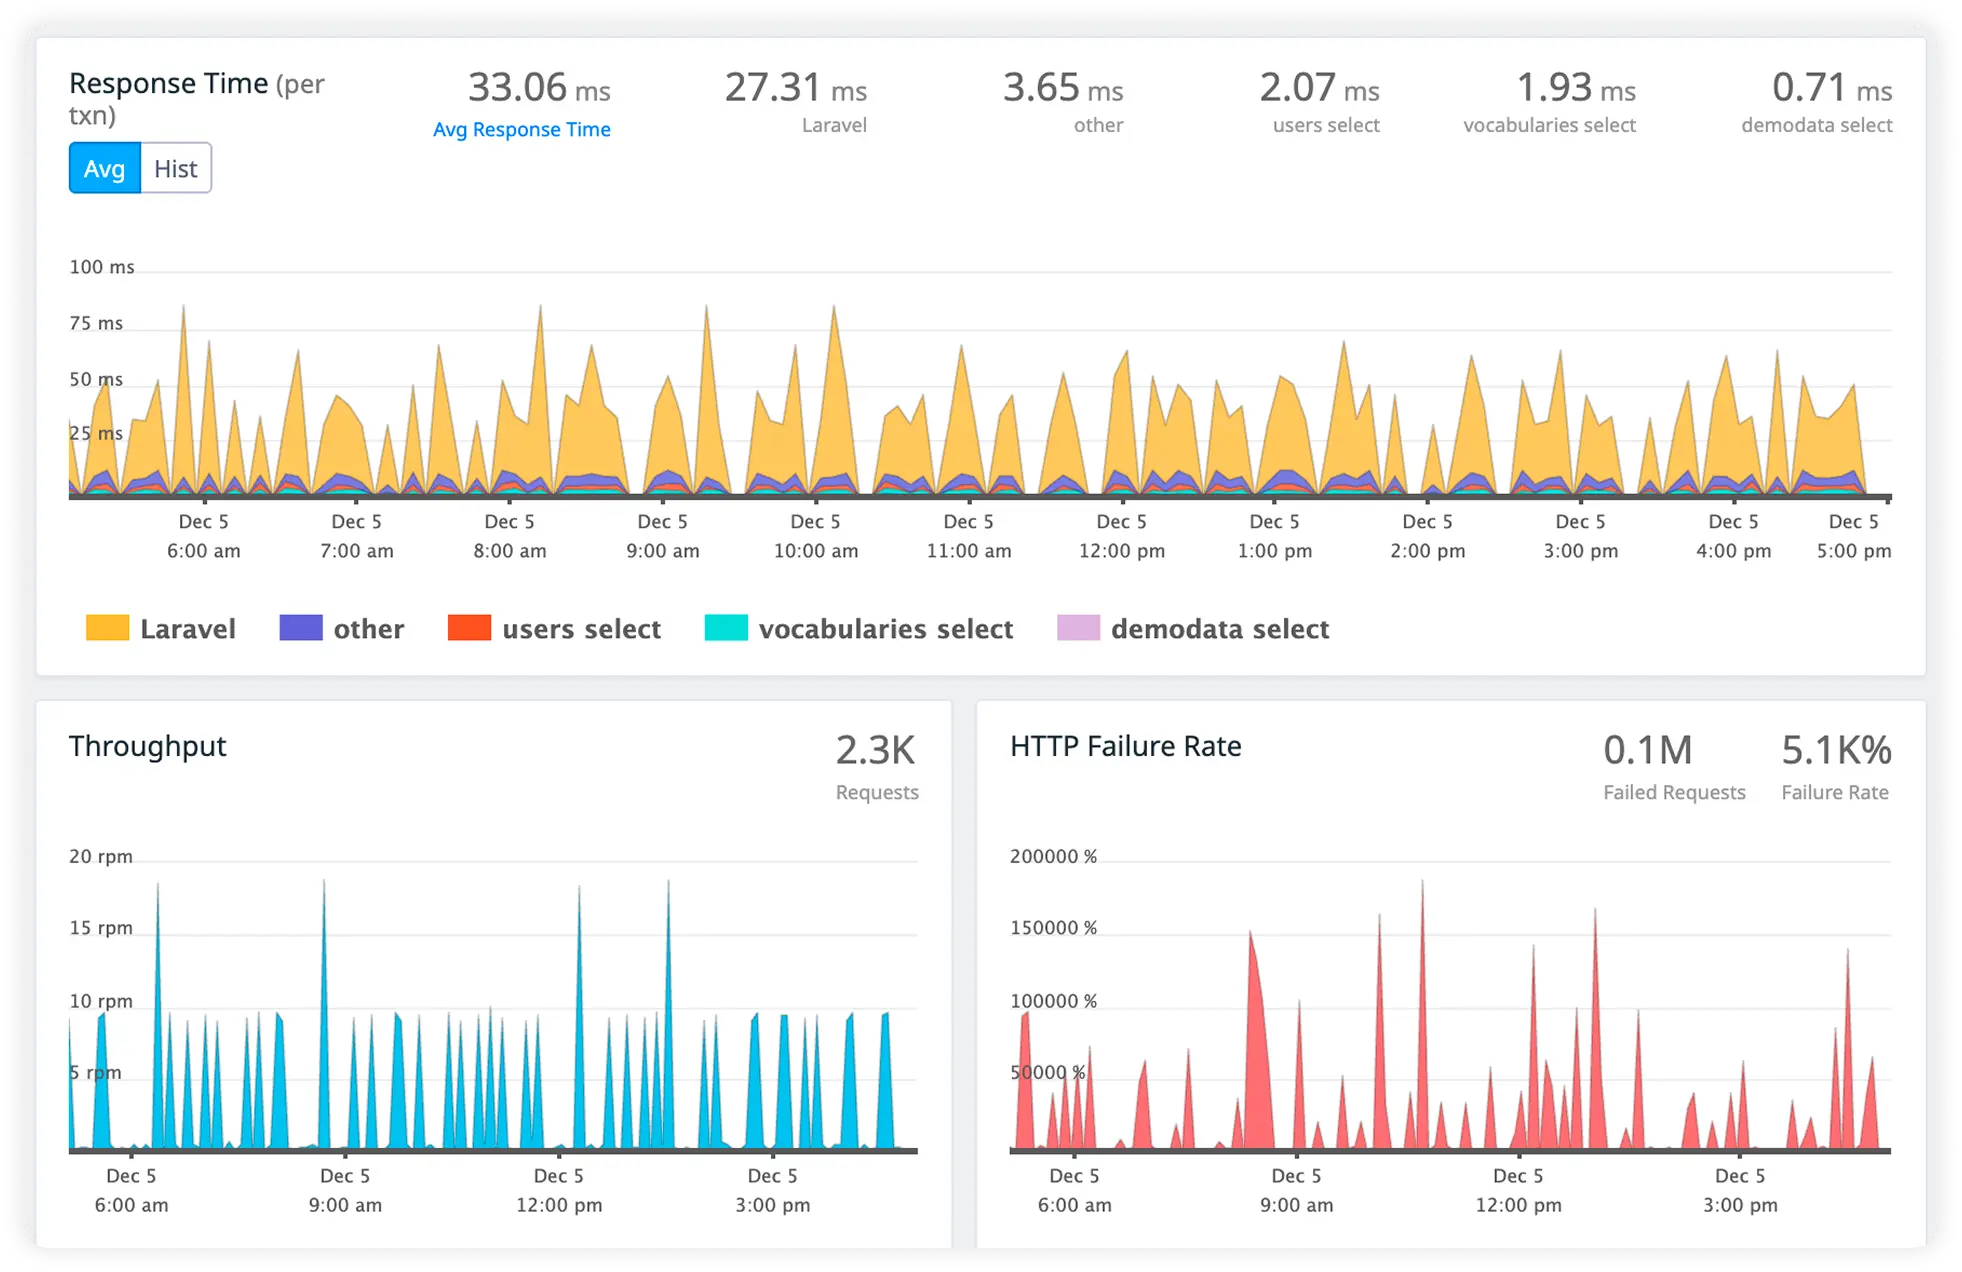
Measure Downstream Call Duration
Track response times for dependent services, microservices, and external APIs. Identify latency introduced by downstream systems.
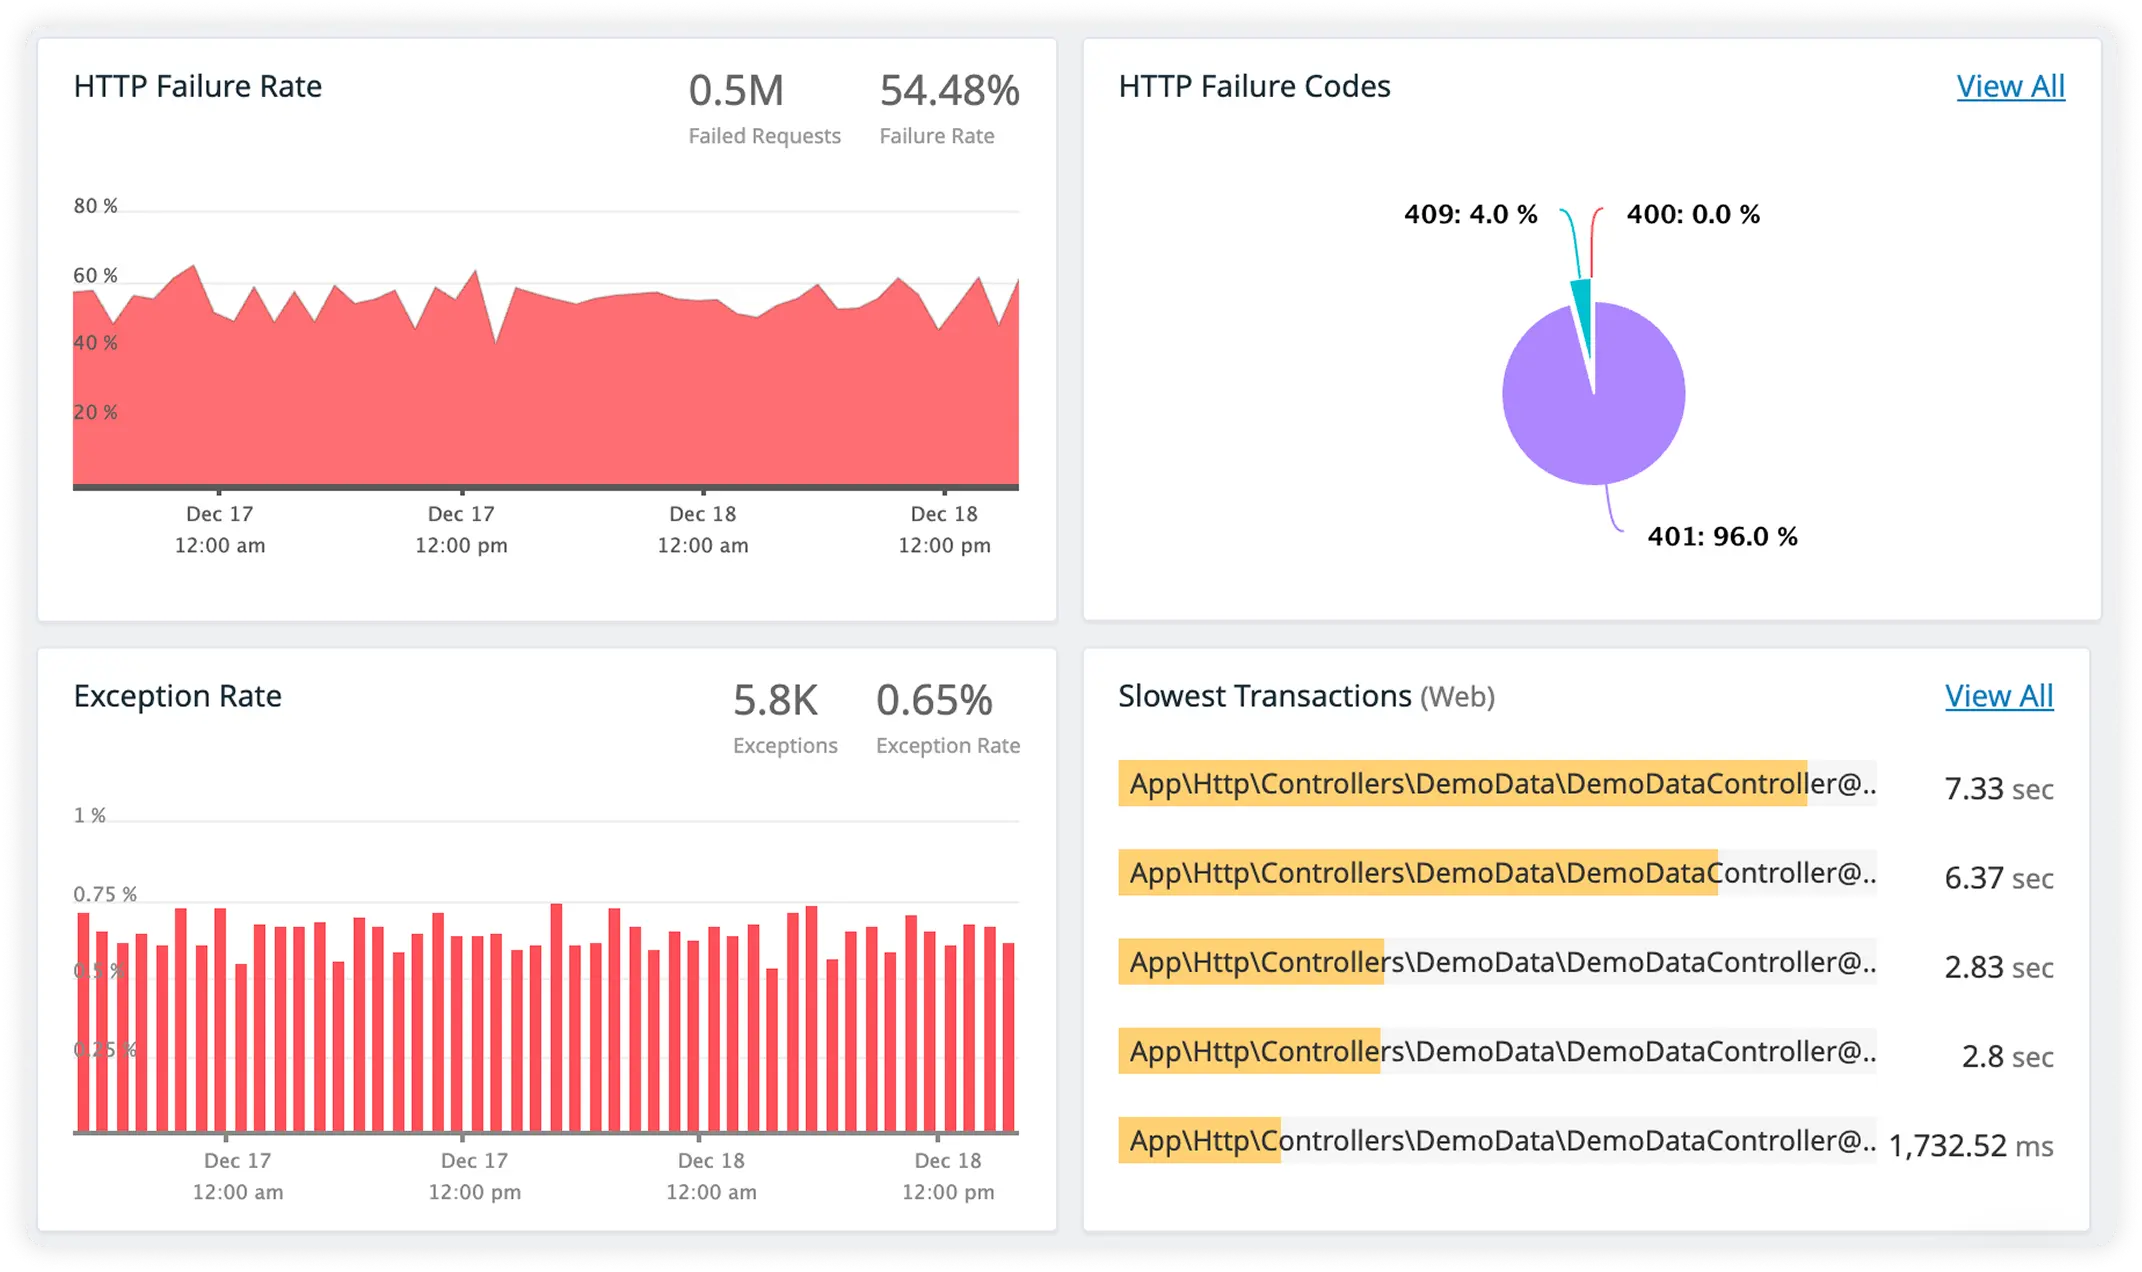
Monitor Database Call Timing
Analyze query execution time and database performance in real time. Eliminate inefficient data access slowing application performance.
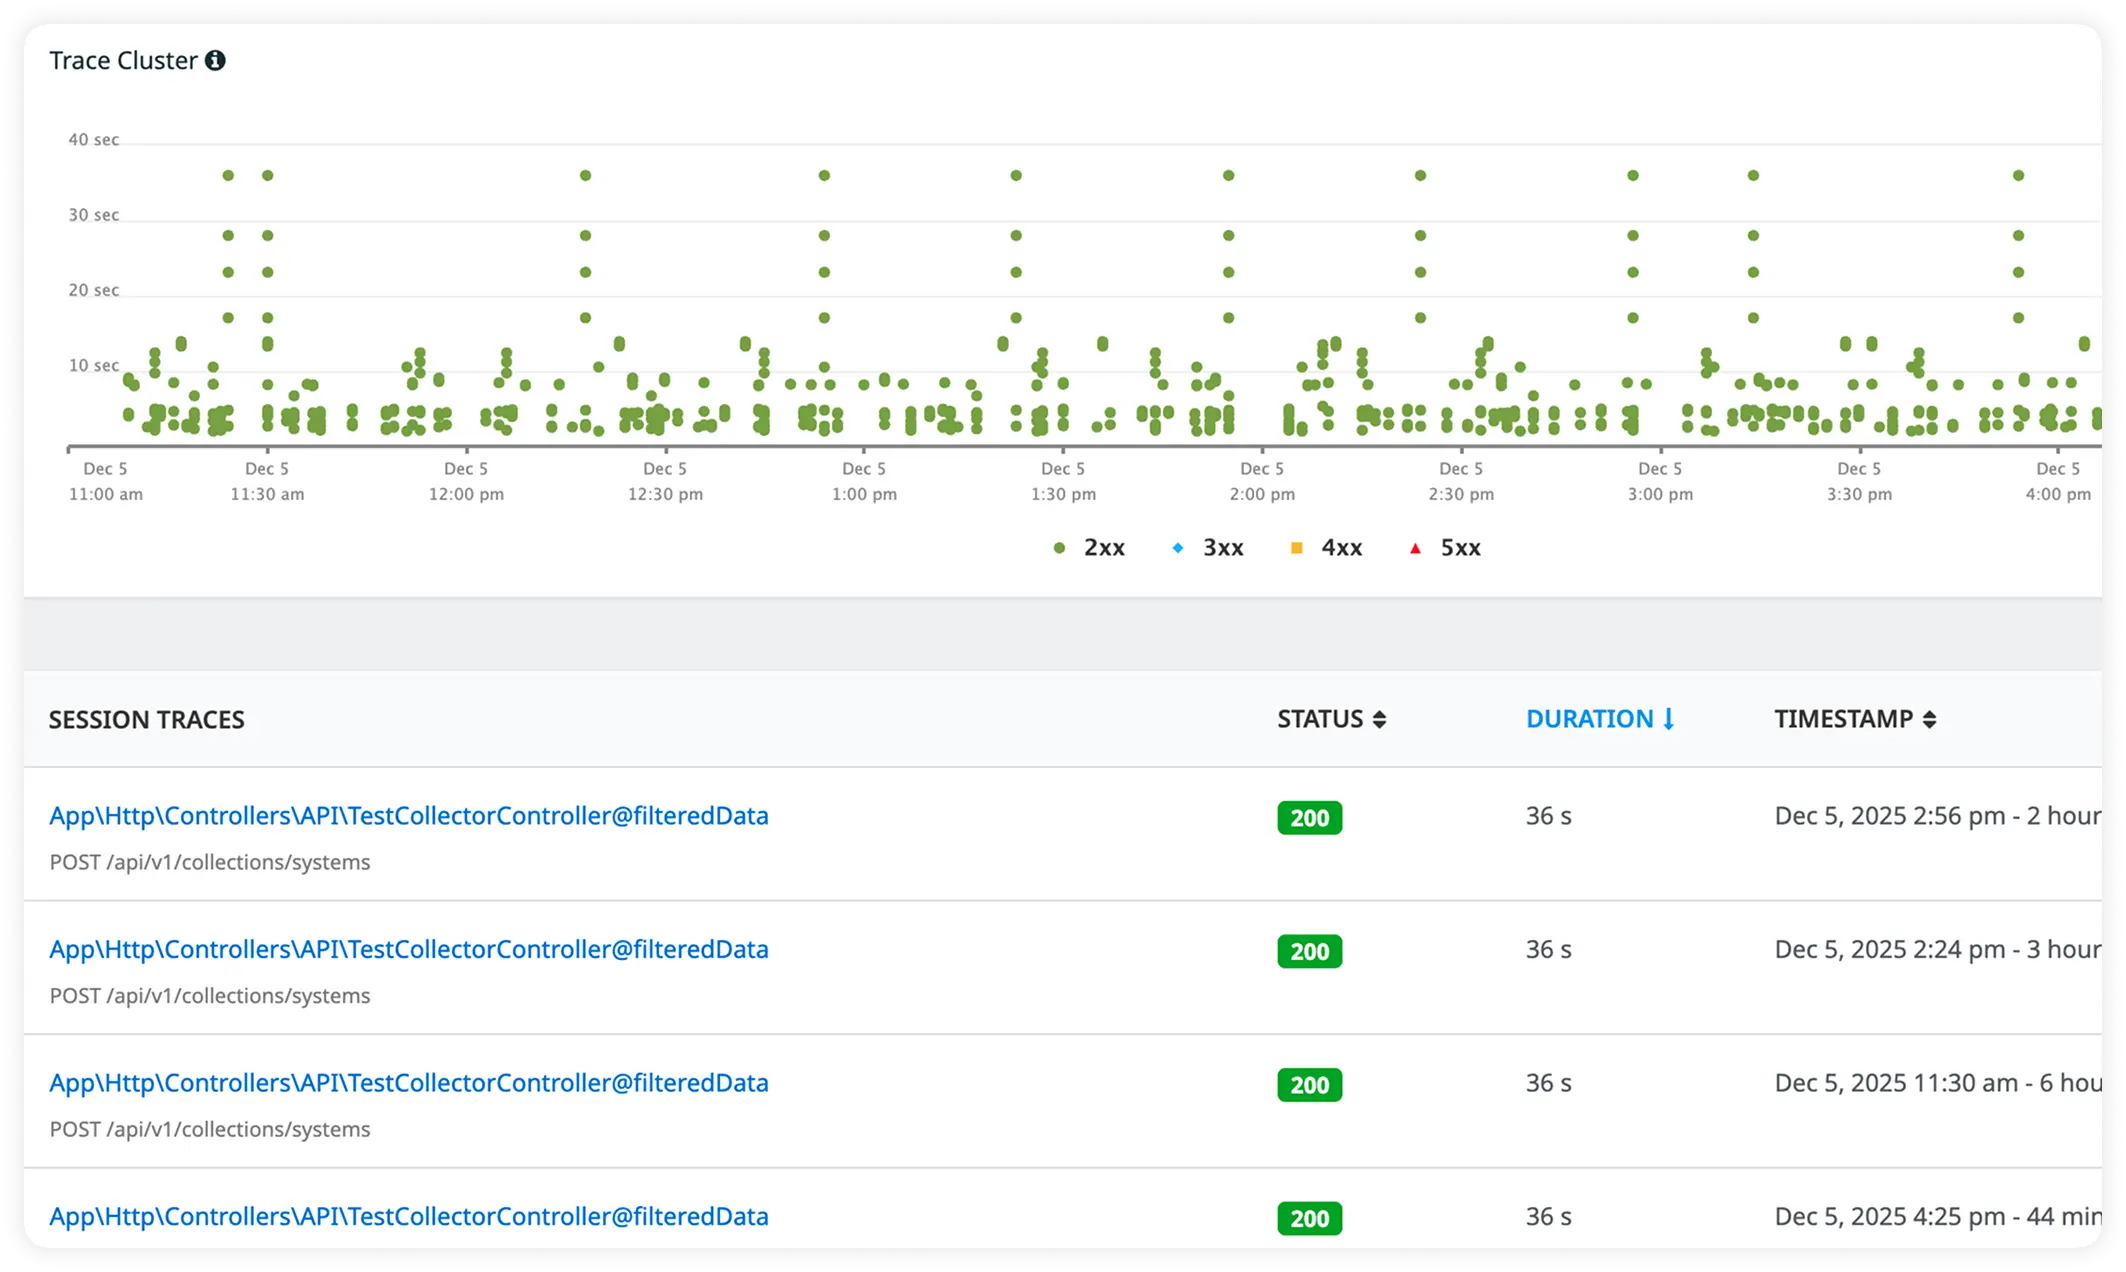
Rich Exception Context with Trace-Linked Logs
Capture detailed exception information alongside correlated logs for every request. Debug faster with complete visibility across errors, traces, and performance data.
Why Teams Choose Atatus Observability for Spring?
Spring teams choose Atatus when understanding real production execution matters more than interpreting summaries, averages, or assumptions.
Instant Prod Clarity
Teams gain correlated traces and metrics within minutes of agent deploy, slashing blind debugging in Spring environments. Platform owners trust unified dashboards for cross-service health at scale.
Frictionless Agent Integration
Spring Boot jars instrument seamlessly without code changes or restarts, enabling rapid rollout across clusters. Backend devs adopt without retraining, focusing on code over config.
Developer Workflow Fit
Precise exception snapshots and stack traces match IDE debugging, building trust in prod anomaly hunts. Engineers resolve issues faster with context-rich alerts tied to code lines.
SRE Alert Precision
Custom thresholds on JVM GC and thread metrics trigger targeted pagers, minimizing alert fatigue in high-scale Spring ops. Response teams act on prioritized signals alone.
Distributed Flow Mastery
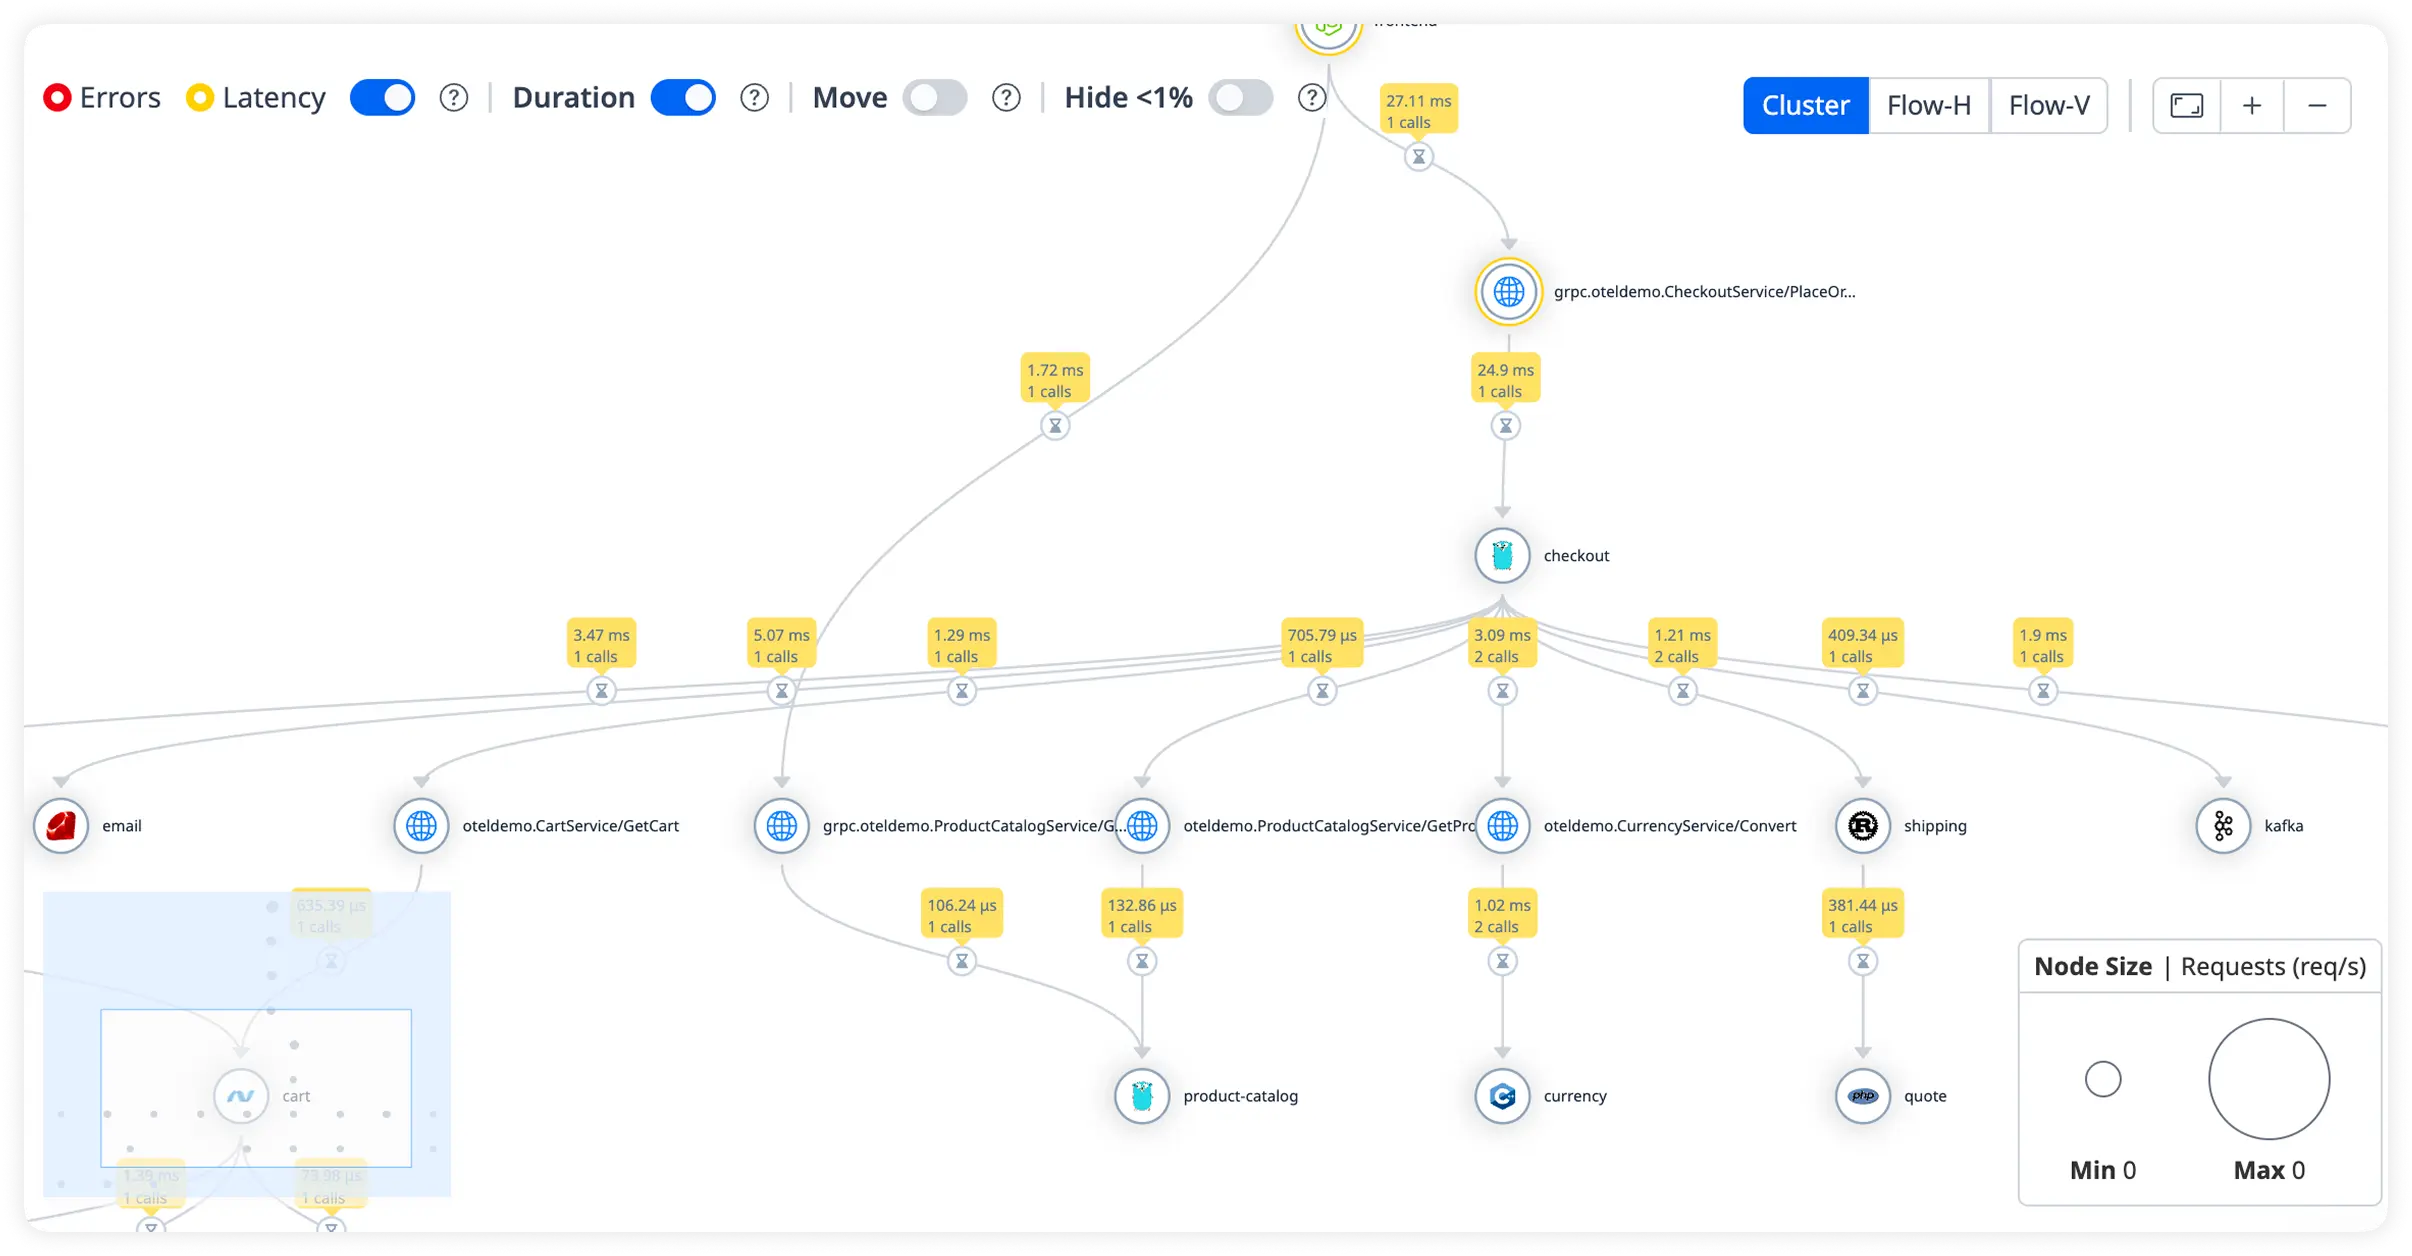
End-to-end request maps reveal Spring microservice latencies, empowering leads to optimize service boundaries confidently. Scale decisions stem from trace-derived bottlenecks.
Autoscaling Validation
Real-time instance metrics validate Spring Boot horizontal growth, ensuring load distribution before SLAs break. Platform teams deploy expansions with data-backed assurance.
Leak Path Profiling
Automated heap analysis pinpoints Spring cache leaks, granting backend teams proactive memory governance. Outages drop as profilers expose root retention paths.
Transaction Rollback Insights
Correlated logs expose Spring at transactional failures across databases, accelerating fix validation in prod. SREs confirm atomicity without repro setups.
Confidence at Scale
Unified Spring observability spans dev to prod, yielding MTTR under 10 minutes for engineering leads. Operational risks fade with verifiable performance baselines.
Unified Observability for Every Engineering Team
Atatus adapts to how engineering teams work across development, operations, and reliability.
Developers
Trace requests, debug errors, and identify performance issues at the code level with clear context.
DevOps
Track deployments, monitor infrastructure impact, and understand how releases affect application stability.
Release Engineer
Measure service health, latency, and error rates to maintain reliability and reduce production risk.