Tomcat Performance Monitoring
Get end-to-end visibility into your Tomcat performance with application monitoring tools. Gain insightful metrics on performance bottlenecks with Java monitoring to optimize your application.
Why Tomcat Production Issues Are Hard to Diagnose?
Absent Thread Visibility
Teams miss executor queue overflows in Tomcat connectors under burst traffic. Worker threads starve requests without pool utilization traces. Backend engineers restart servers blind to blocking operations.
Hidden GC Pauses
Full GC cycles halt Tomcat response streams undetected during load spikes. Old gen growth triggers stop-the-world events without pause duration profiles. Platform leads rollback deploys chasing phantom latency.
Connector Overload Blindspots
Max threads hit limits while accept queues balloon in multi-connector setups. NIO selectors drop connections silently under DDoS-like patterns. SREs tune blindly without per-connector stats.
Untracked Memory Fragmentation
Direct byte buffers leak across Tomcat lifecycle without off-heap tracking. Native memory exhaustion kills JVMs post-restart cycles. Backend teams patch symptoms instead of retention paths.
Silent Deadlock Chains
Intra-request deadlocks freeze Tomcat pipelines without contention graphs. Monitor threads reveal nothing as app locks cascade. Debugging stalls across heap dumps and thread races.
Buried Request Queues
Queued requests timeout deep in executor backlogs during uneven traffic. Access logs bury processing times in volume. Platform engineers scale vertically without queue depth signals.
Opaque NIO Selector Issues
Selector cache exhaustion drops new connections in high-concurrency Tomcat. Polling loops spin without CPU profile correlation. SREs miss non-blocking I/O degradation until outages cascade.
Immediate Runtime Telemetry
Connector metrics and thread states surface within seconds of agent attach. SREs correlate queue depth with JVM pauses instantly. Platform dashboards unify multi-instance health views.
Complete Runtime Visibility for
Tomcat Applications
Real-time observability for Tomcat environments that helps teams understand request performance, optimize system behavior, and resolve production issues faster.
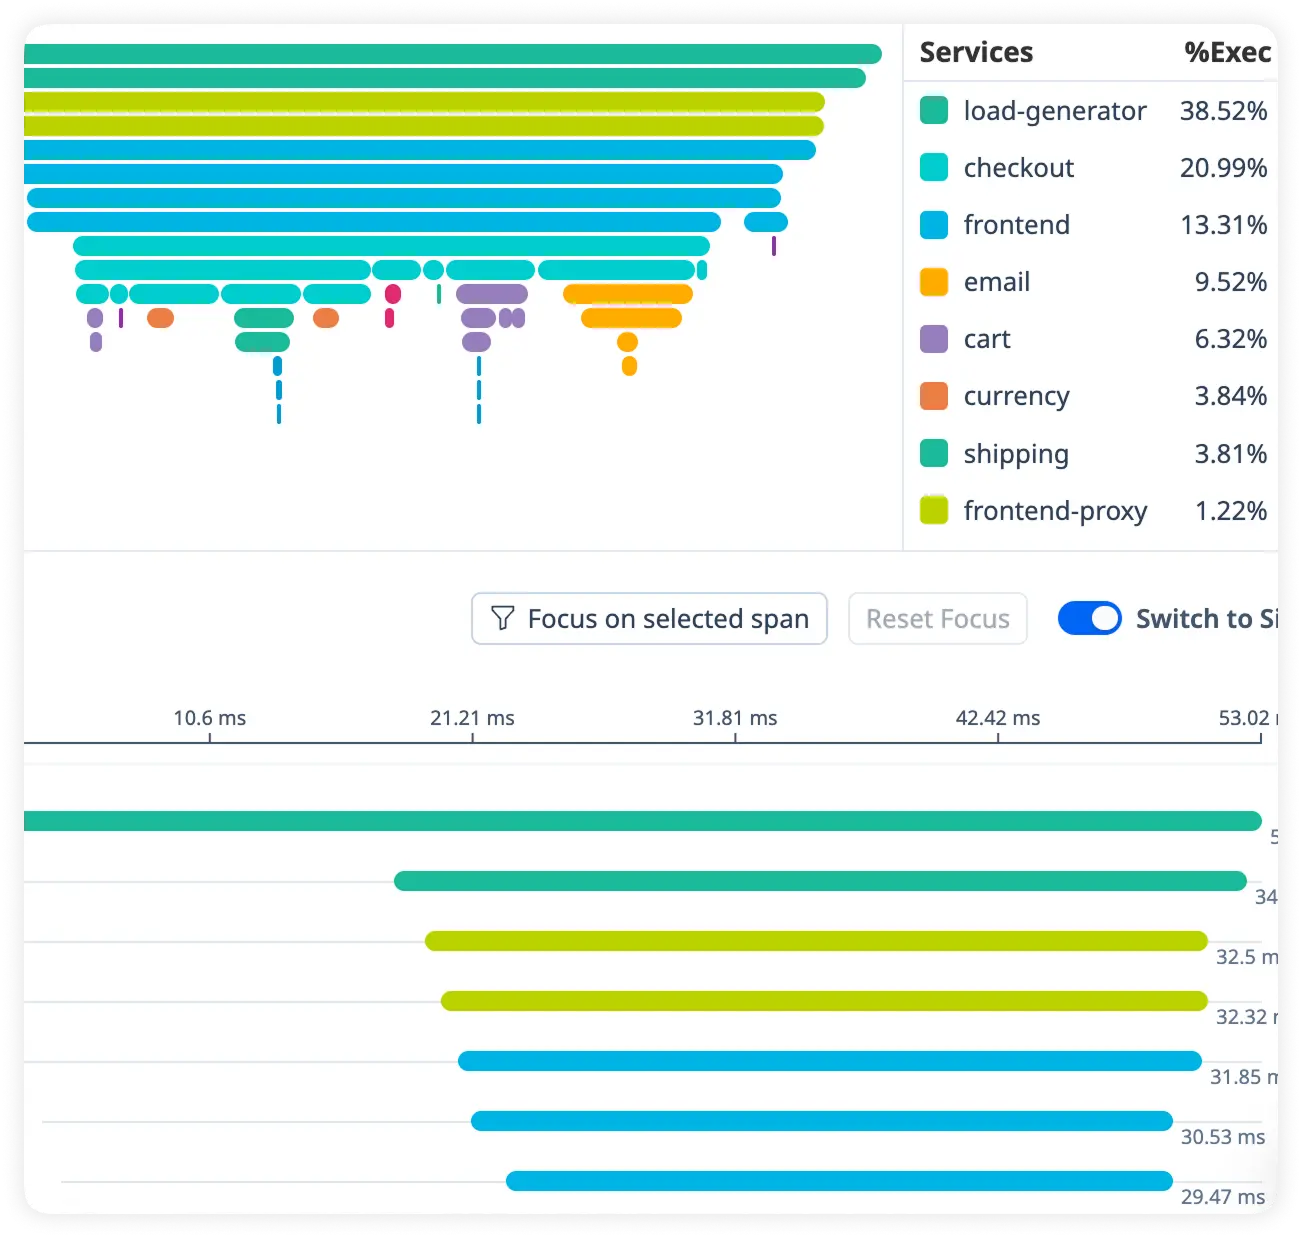
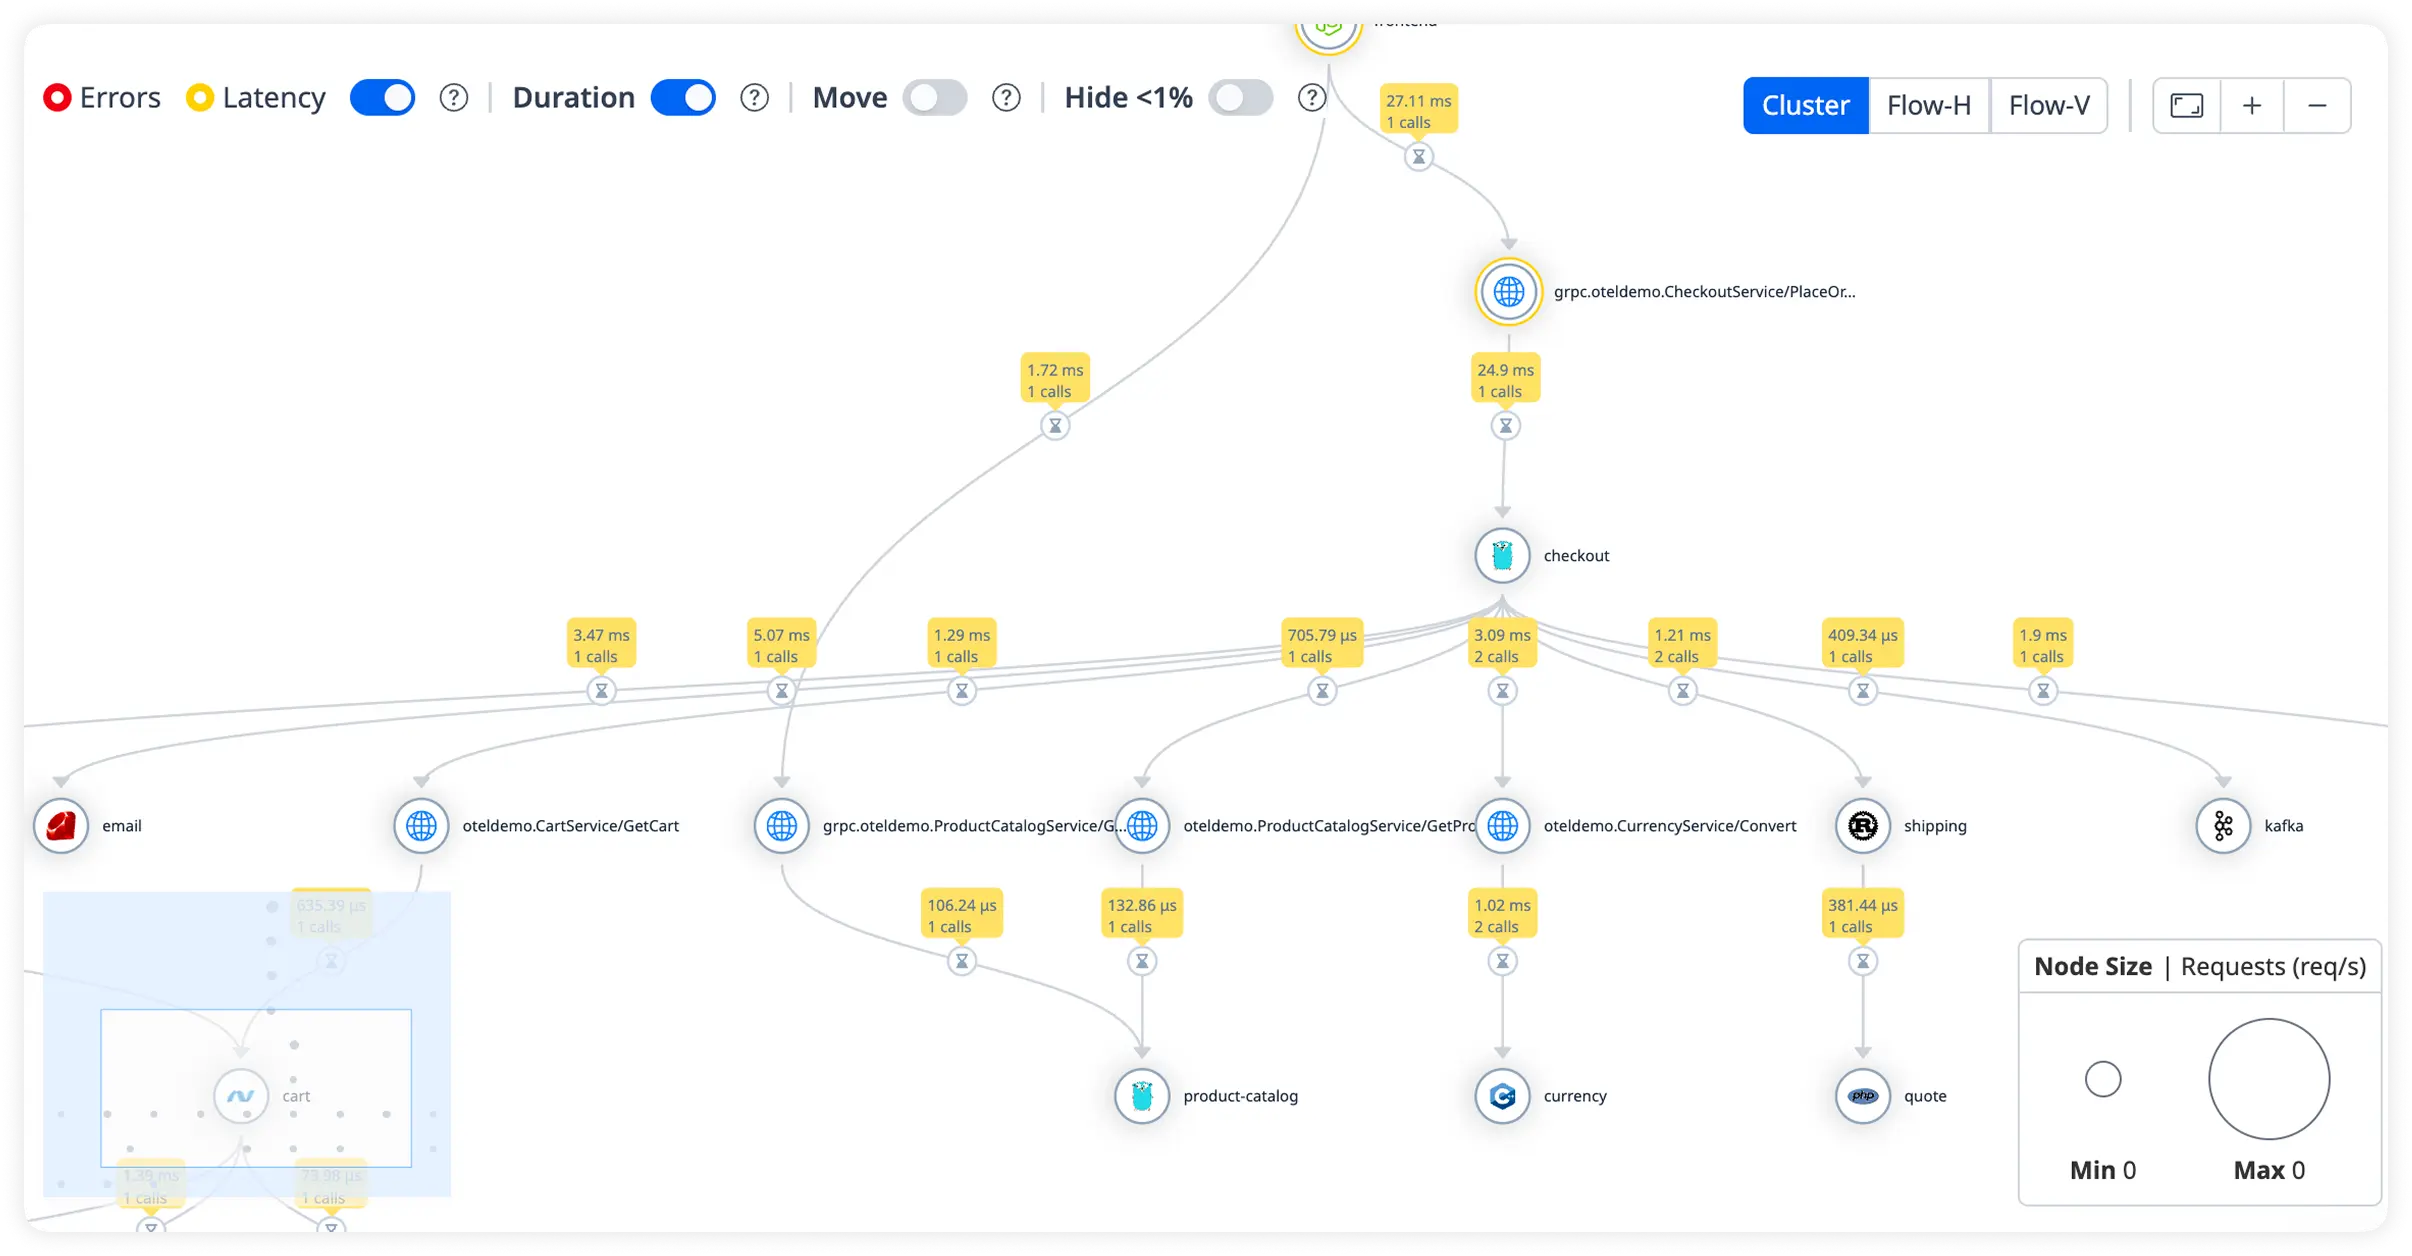
Detailed Request Duration Breakdown
See exactly how long each request takes from entry to response. Quickly identify slow endpoints affecting overall application performance.
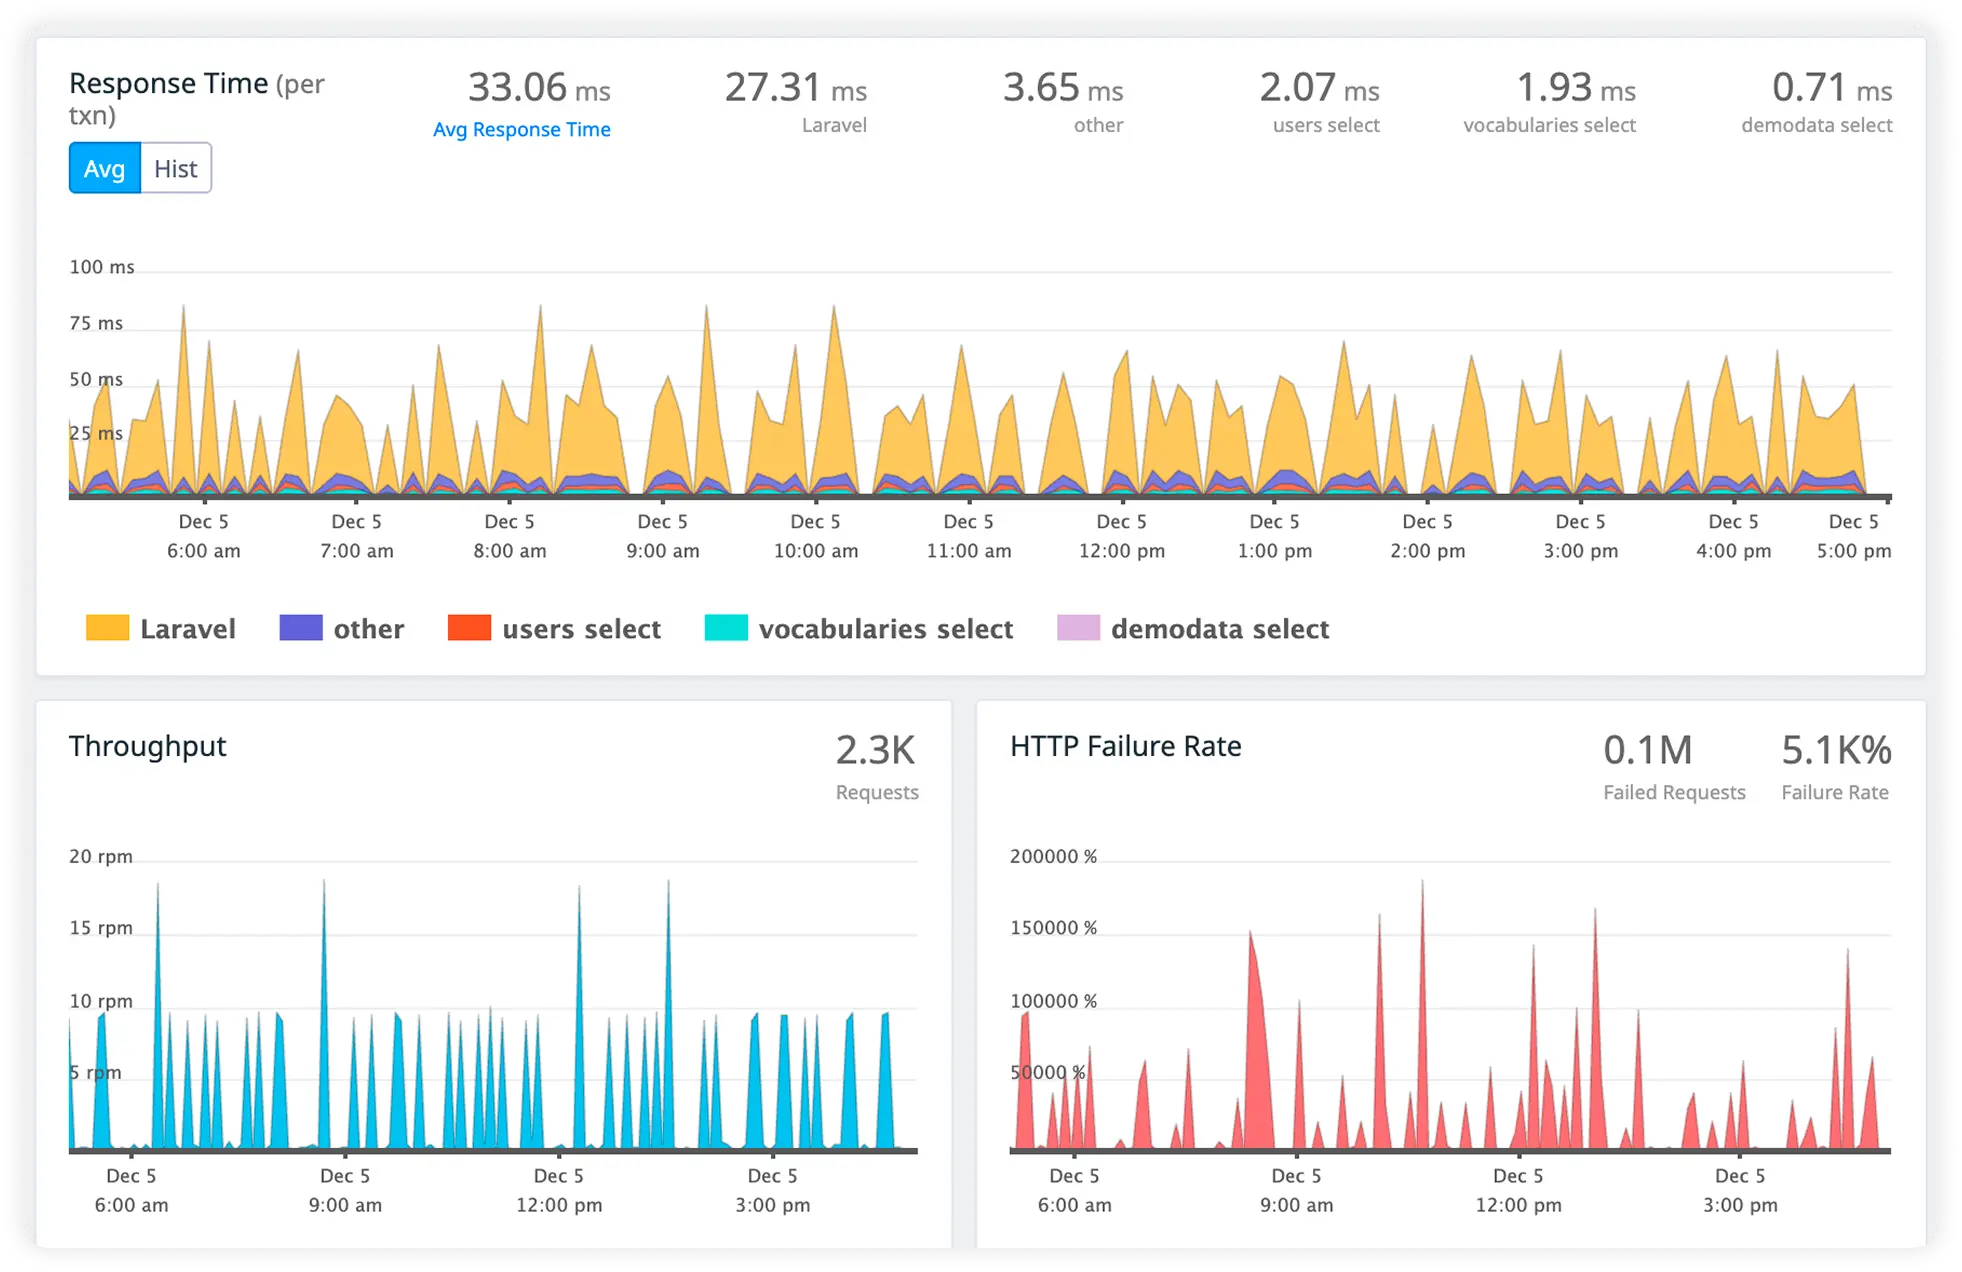
Monitor JVM Response Timing
Track JVM processing time and thread behavior across requests. Uncover performance constraints inside the Java runtime.
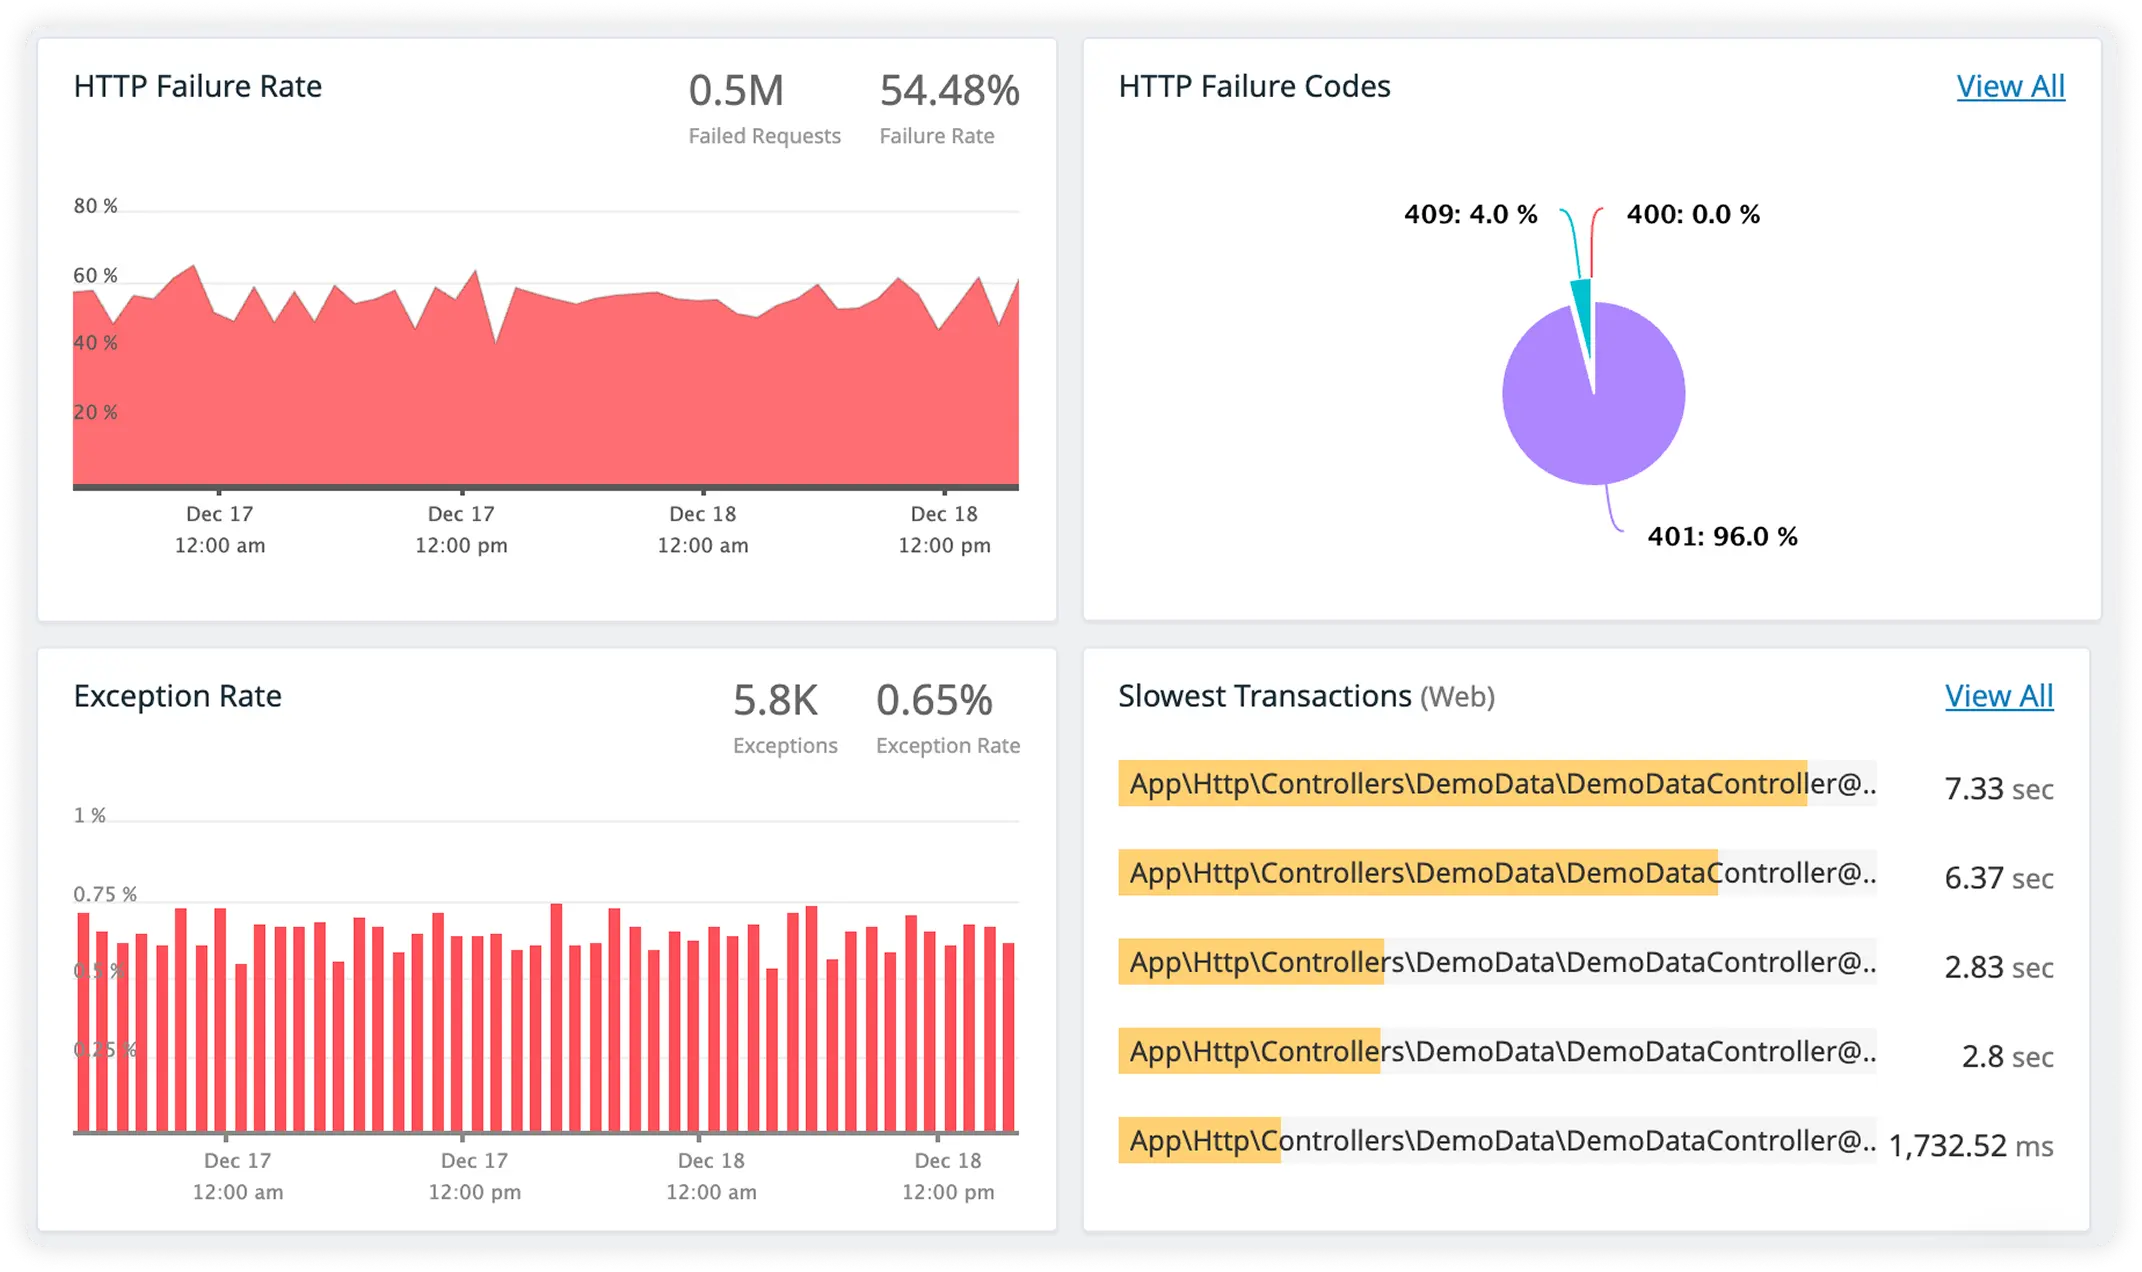
Identify Slow Database Calls
Measure query execution times and database latency in real time. Eliminate inefficient database interactions slowing request processing.
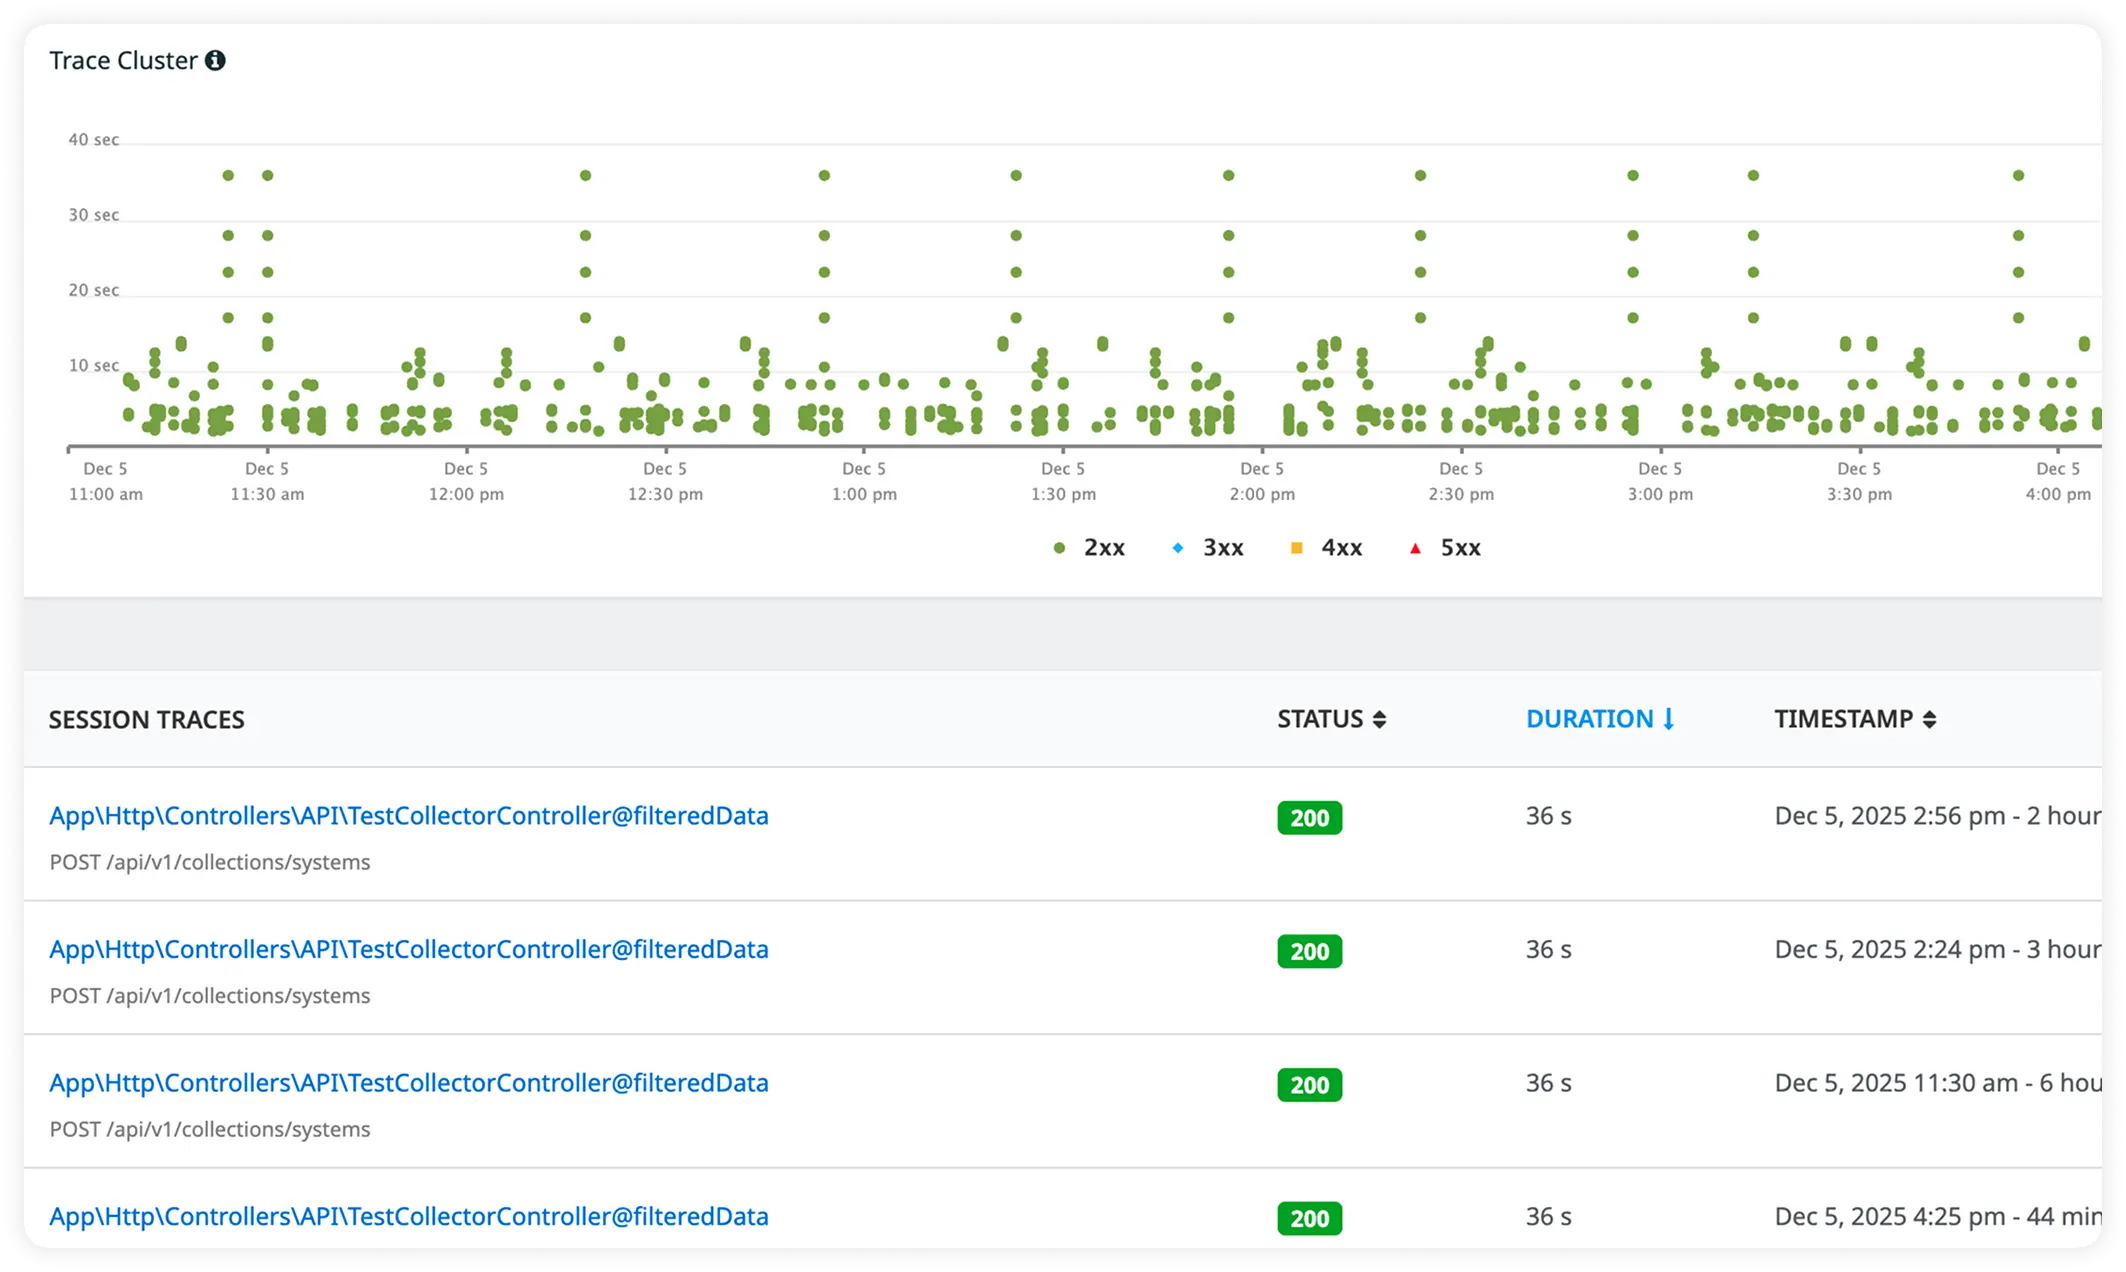
External Call Impact with Trace-Linked Logs
Track response times for third-party services alongside correlated request logs. Debug faster while understanding how external dependencies influence performance.
Why Teams Choose Atatus for Tomcat Observability?
Engineering teams standardize on Atatus for runtime precision that eliminates Tomcat observability gaps, enabling confident scaling decisions.
Instant Telemetry Access
Connector threads and GC pauses correlate immediately post-agent attach. SREs spot capacity risks before SLAs degrade. Unified views span Tomcat fleets instantly.
Seamless Bytecode Injection
No server.xml changes or restarts needed for full Tomcat coverage. Backend deploys roll out instrumentation cluster-wide. Adoption completes Day Zero.
Prod-IDE Trace Fidelity
Exception stacks map directly to servlet source lines. Developers triage with local debugger equivalence. Prod debugging mirrors dev environments.
Capacity-Bound Alerts
Executor queues and memory thresholds trigger precise pagers at 85% utilization. SREs focus on validated signals only. Alert storms vanish.
Pipeline Latency Breakdowns
Request paths quantify Tomcat queuing versus backend delays. Platform owners tune connectors from flow metrics. Bottlenecks gain exact timestamps.
Scale Threshold Validation
Instance-level baselines confirm autoscaling headroom pre-traffic spikes. SREs deploy expansions with runtime proof. Vertical scaling becomes obsolete.
Off-Heap Retention Paths
Direct buffer leaks trace to servlet allocators automatically. Backend patches land before native OOMs cascade. Memory stability becomes deterministic.
Thread Contention Maps
Deadlock graphs expose blocking spans across Tomcat executors. SREs interrupt targeted threads with cycle visuals. Resolution drops to minutes.
Baseline-Driven Forecasting
Percentile runtime data spans dev-to-prod Tomcat variants. Engineering leads project growth from fleet telemetry. Capacity planning turns predictive.
Unified Observability for Every Engineering Team
Atatus adapts to how engineering teams work across development, operations, and reliability.
Developers
Trace requests, debug errors, and identify performance issues at the code level with clear context.
DevOps
Track deployments, monitor infrastructure impact, and understand how releases affect application stability.
Release Engineer
Measure service health, latency, and error rates to maintain reliability and reduce production risk.