Wildfly Performance Monitoring
Get end-to-end visibility into your Wildfly performance with application monitoring tools. Gain insightful metrics on performance bottlenecks with Java monitoring to optimize your application.
Why WildFly Performance Breaks Quietly?
Thread Exhaustion Hidden
WildFly thread pools saturate under bursty loads, stranding requests without clear queue depths or wait times.
GC Pauses Untracked
Unpredictable JVM garbage collection halts block production traffic, lacking per-generation metrics or pause duration breakdowns.
Database Bottlenecks Blind
JDBC connection leaks drain pool capacity silently, inflating query latencies without datasource health indicators.
Heap Leaks Unseen
Memory leaks from unclosed resources bloat heap usage over deployments, evading allocation profiling granularity.
EJB Transaction Failures
Distributed EJB transactions rollback intermittently, obscuring XA resource coordination failures across nodes.
JMS Queue Backlogs
Persistent JMS queues overflow during consumer lag, hiding message age distributions or redelivery counts.
Clustering Sync Delays
Infinispan cache invalidations lag in clustered setups, causing stale data reads without replication latency traces.
JNDI Lookup Timeouts
Resource binding resolutions timeout under high lookup volume, masking naming service contention or resolution paths.
Complete Performance Visibility for
WildFly Applications
Real-time observability for WildFly environments that helps teams understand request performance, optimize runtime behavior, and resolve production issues faster.
Detailed Request Duration Breakdown
Track how long each request takes across servlets, handlers, and internal processing layers. Quickly uncover slow execution paths affecting response times.
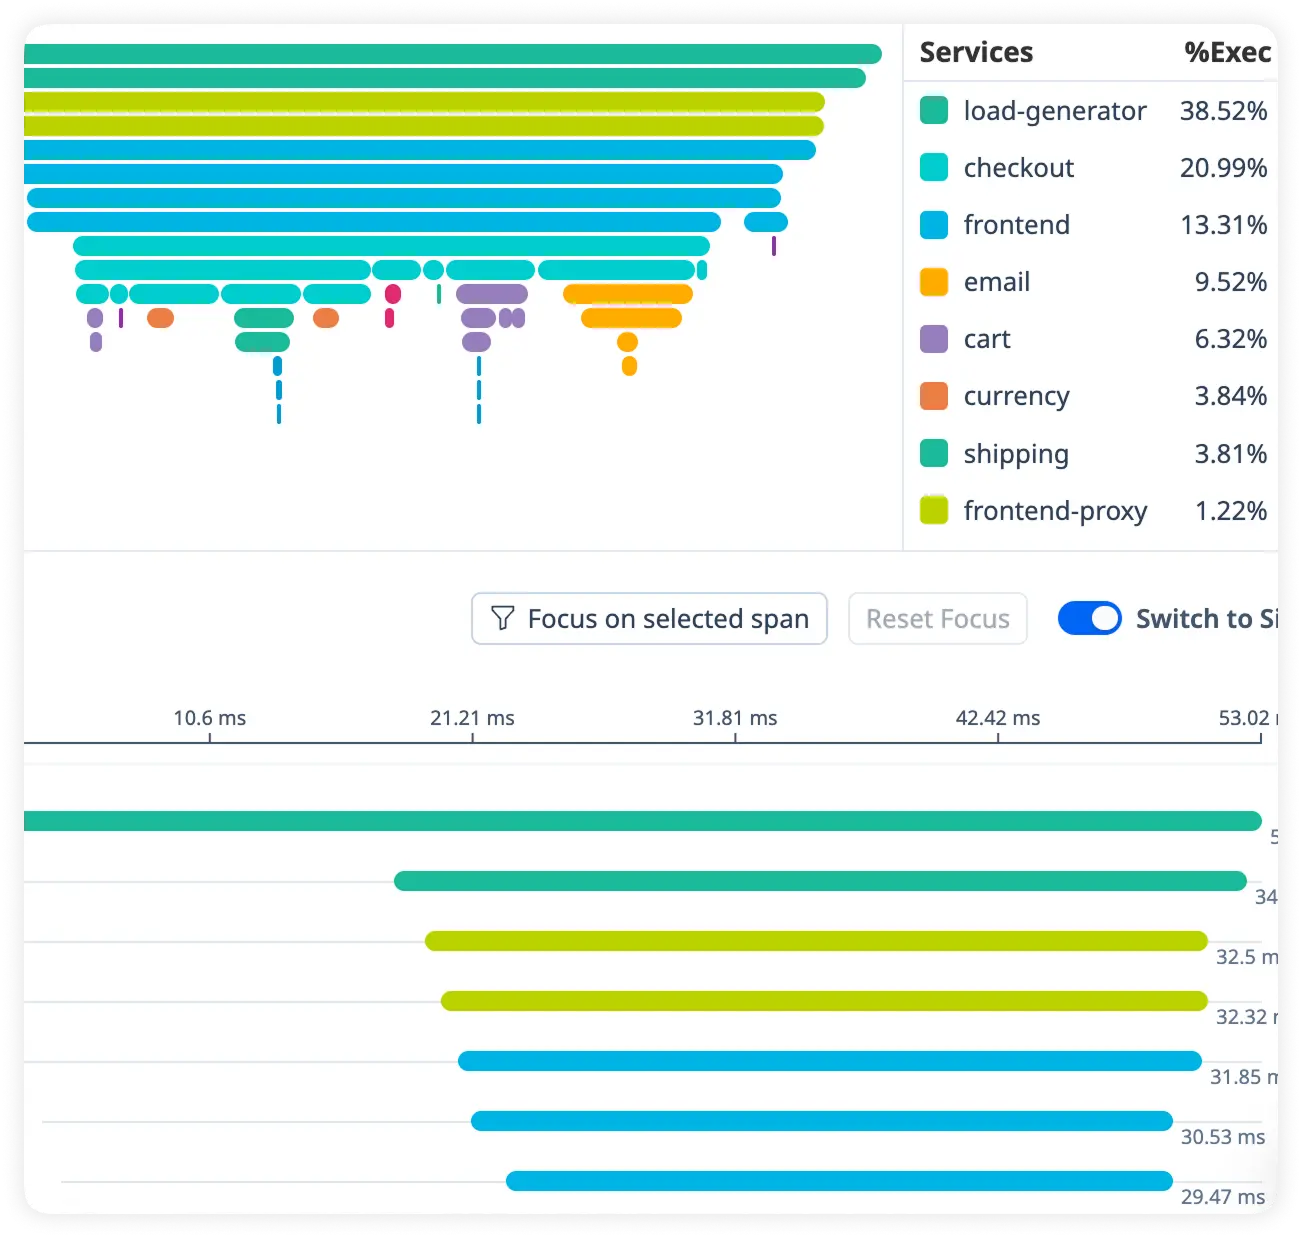
Monitor JVM Response Timing
Measure JVM processing time and runtime behavior across requests. Identify performance bottlenecks inside the Java virtual machine.
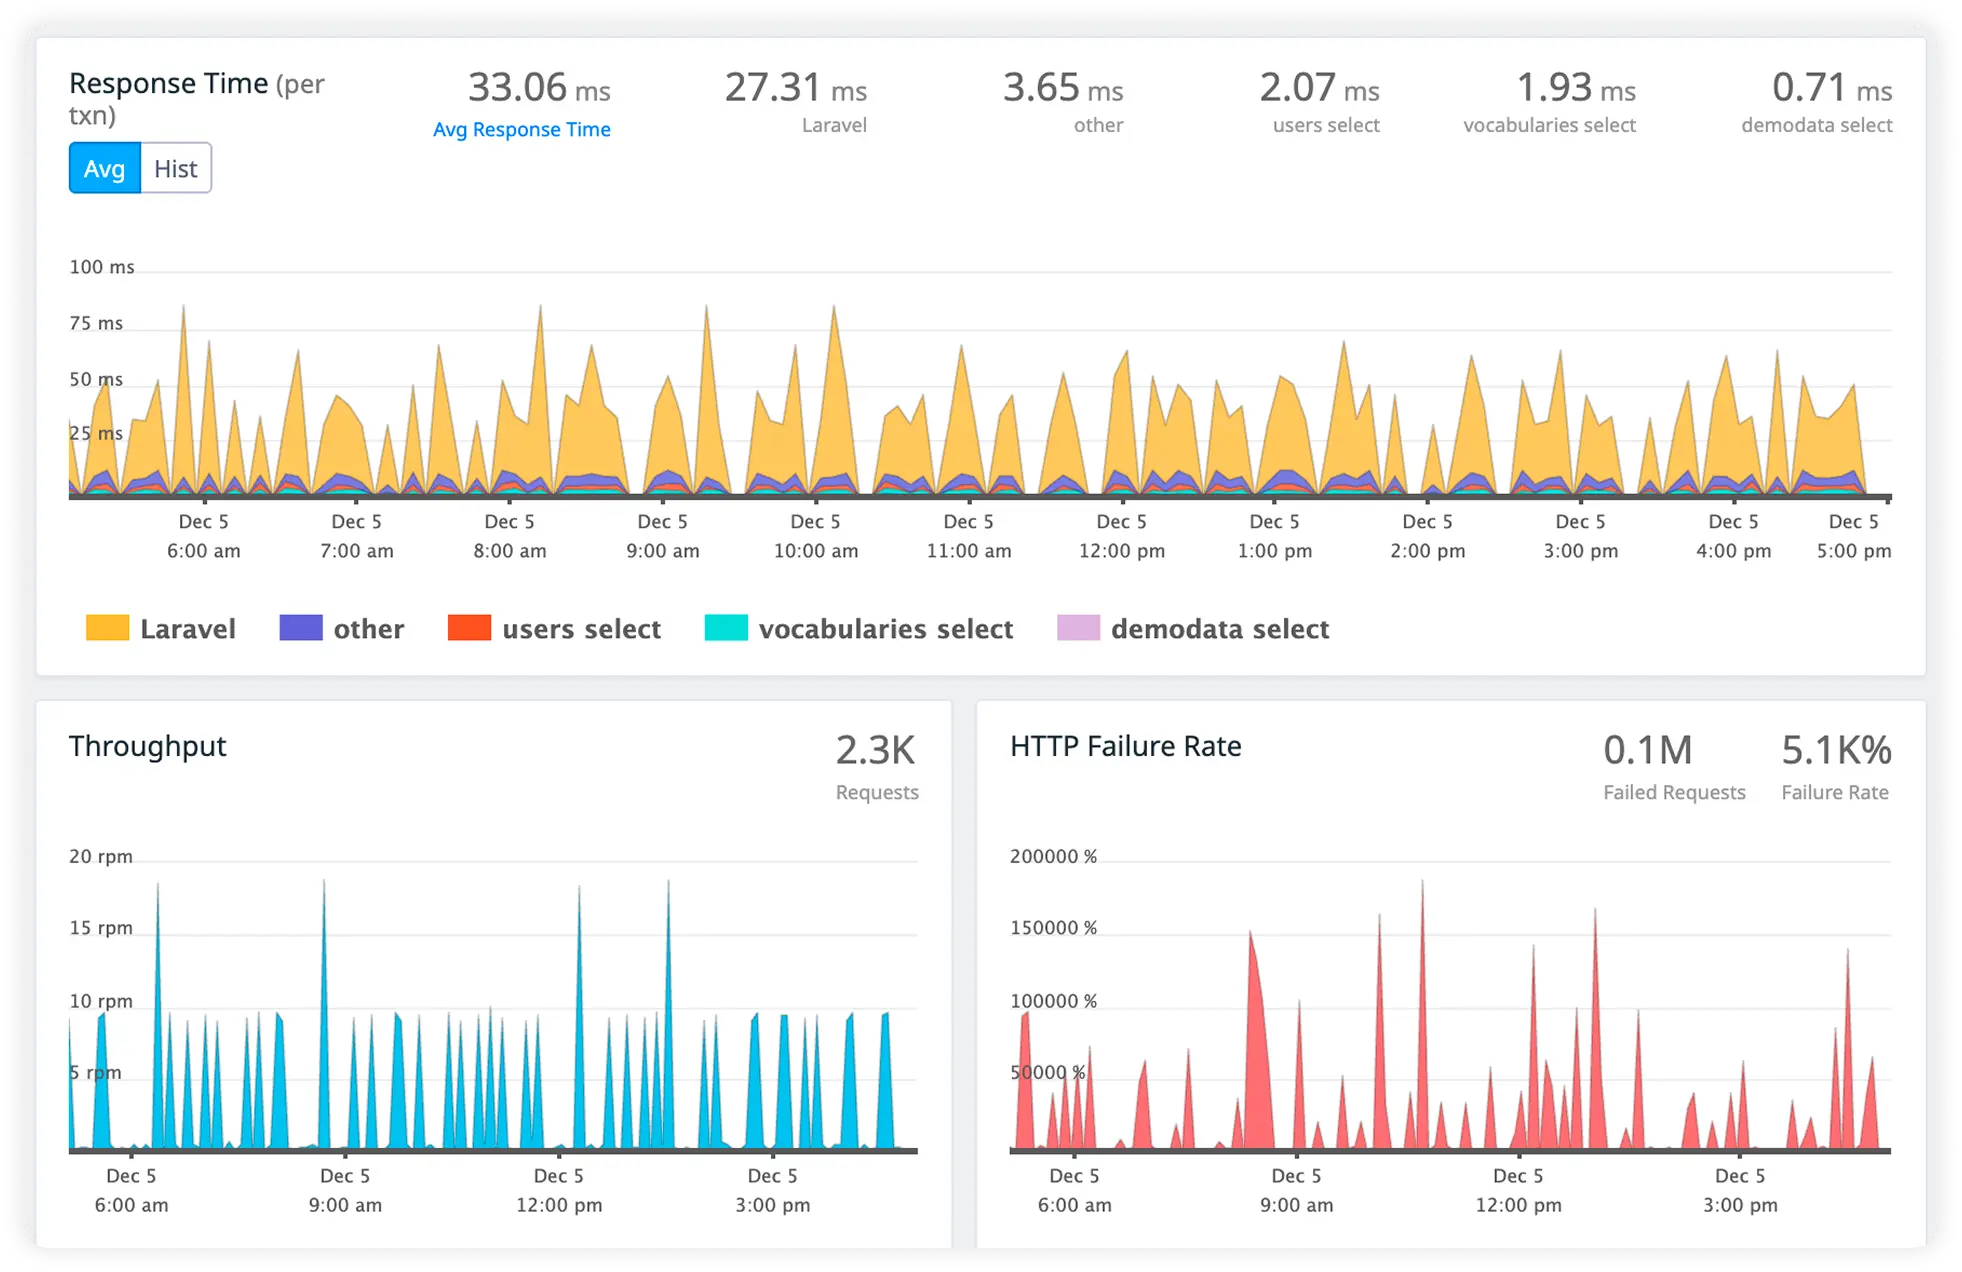
Identify Slow JDBC Calls
Analyze database query execution times and connection latency in real time. Eliminate inefficient database interactions slowing application performance.
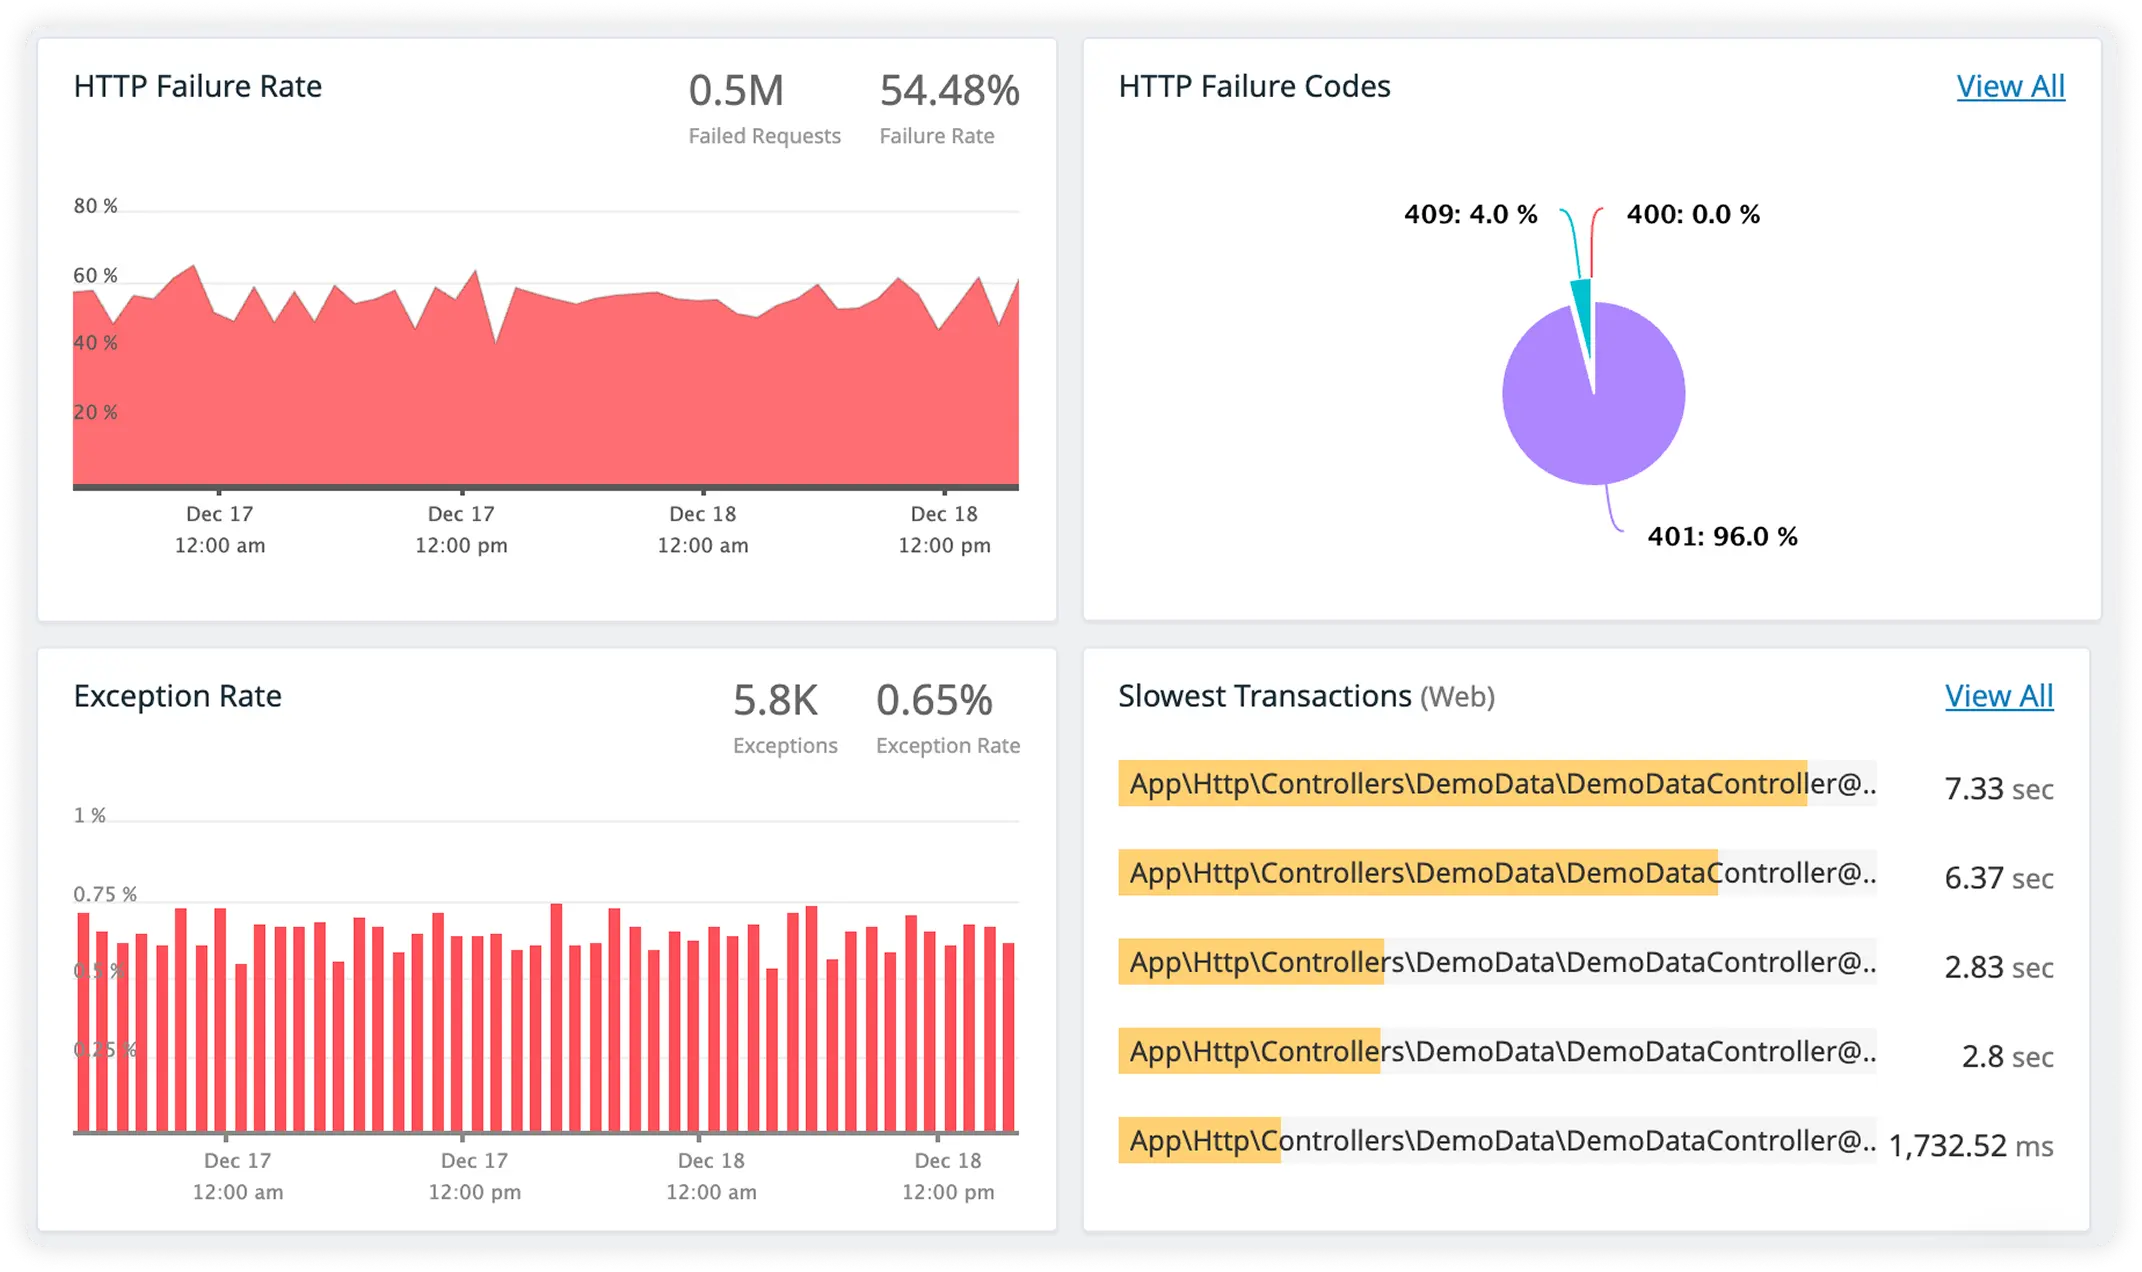
External Service Timing with Thread Execution Insight
Track response times for third-party services while monitoring thread execution behavior. Understand how concurrency and external dependencies impact application performance.
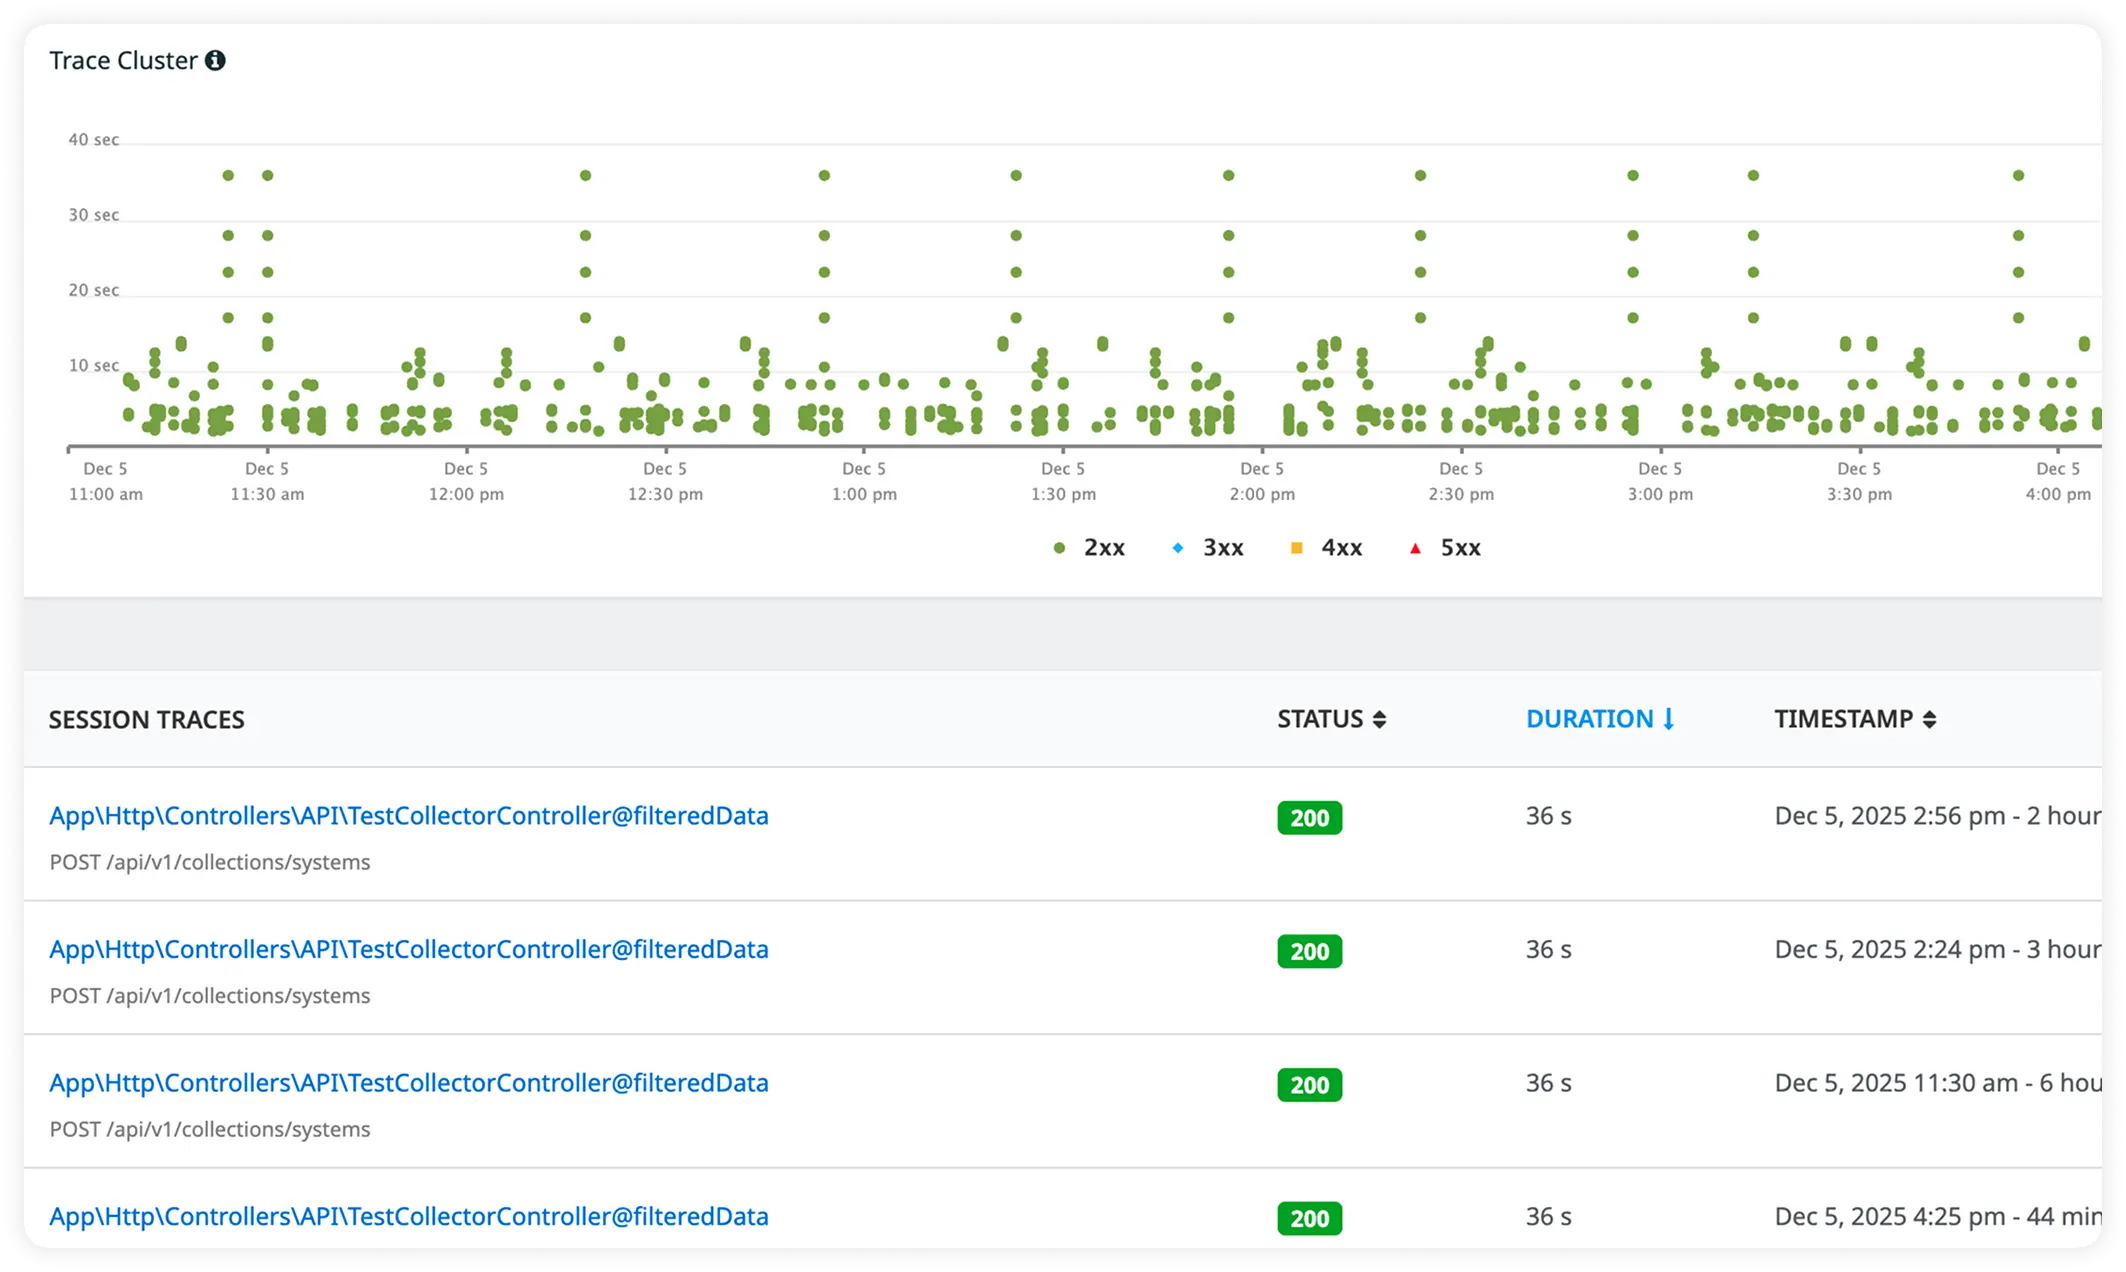
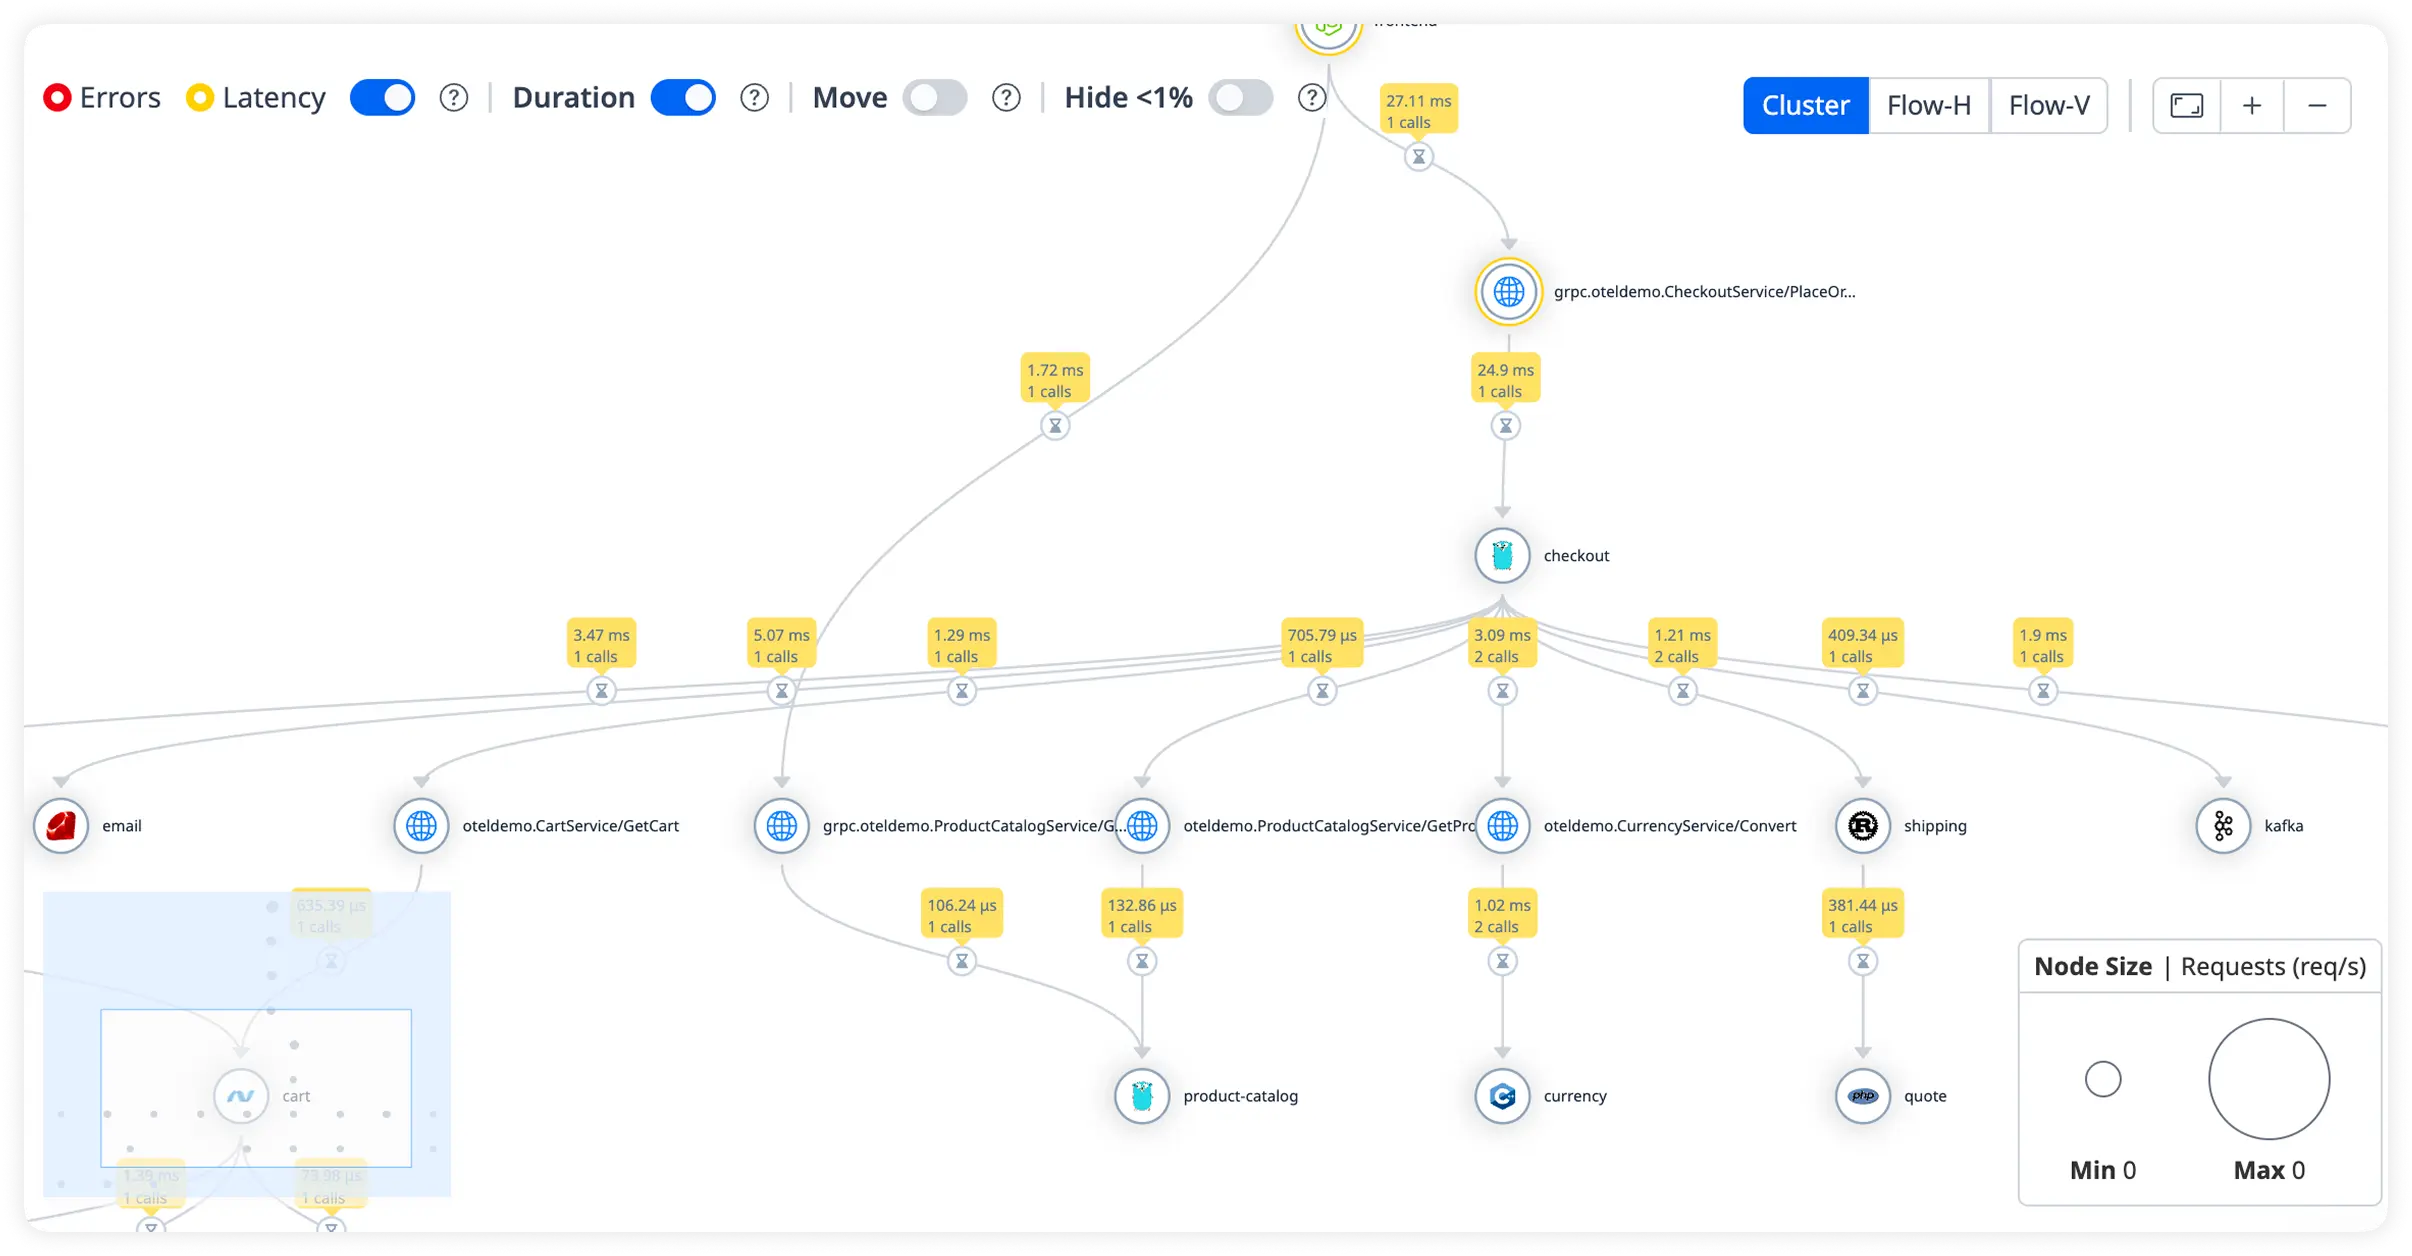
Why Teams Choose Atatus for wildfly Observability?
Engineering teams choose Atatus when production understanding matters more than surface metrics. It fits how WebLogic systems actually run and fail in the real world.
Trace Fidelity Unmatched
End-to-end spans capture WildFly method invocations with bytecode precision, rebuilding call graphs sans agent overhead.
Onboard in Minutes
Agentless integration hooks WildFly management APIs directly, yielding metrics streams without code rewrites.
Developer Dashboard Trust
Raw flame graphs expose CPU hogs in EJB interceptors, arming code owners with stack-sampled hotspots.
SRE Alert Precision
Anomaly thresholds on JMX beans filter noise, paging only on sustained WildFly metric deviations.
Backend Scale Confidence
Multi-tenant isolation segments cluster metrics, validating horizontal pod autoscaling under synthetic loads.
Custom Metric Control
MBean federation ingests bespoke WildFly counters, aligning dashboards to service-level objectives.
Log-Trace Fusion
Correlated stdout logs anchor distributed traces, surfacing N+1 query chains in Hibernate sessions.
Cross Team Alignment
Backend, SRE, and platform teams share a common understanding of production behavior, reducing escalation friction.
Confident Release Decisions
Teams validate runtime impact before and after changes, improving confidence in production releases.
Unified Observability for Every Engineering Team
Atatus adapts to how engineering teams work across development, operations, and reliability.
Developers
Trace requests, debug errors, and identify performance issues at the code level with clear context.
DevOps
Track deployments, monitor infrastructure impact, and understand how releases affect application stability.
Release Engineer
Measure service health, latency, and error rates to maintain reliability and reduce production risk.