Yii Performance Monitoring
Get end-to-end visibility into your Yii performance with application monitoring tools. Gain insightful metrics on performance bottlenecks with PHP monitoring to optimize your application.
Where Yii Production Loses Visibility and Control?
Hidden Execution Paths
Yii request execution flows through controllers, filters, and behaviors in ways that are hard to observe once deployed.
Silent Degradation
Performance degrades gradually under load, making issues visible only after users are already impacted.
Slow Root Cause
Failures surface as symptoms, not causes, forcing engineers to dig through layers of framework logic.
Database Uncertainty
Query behavior changes with data growth, but production impact is difficult to trace back to execution flow.
Dependency Blindspots
External calls slow down requests, yet their effect on Yii request lifecycles remains unclear.
Environment Drift
Production behavior diverges from staging due to configuration, traffic shape, and data volume differences.
Scale Surprises
Concurrency and background processing introduce runtime behavior that does not appear in low-load testing.
Debugging Overhead
Investigations rely on assumptions and manual correlation instead of concrete runtime evidence.
Clear Performance Visibility for
Yii Applications
Real-time observability for Yii that helps teams understand request behavior, optimize application performance, and resolve issues faster in production.
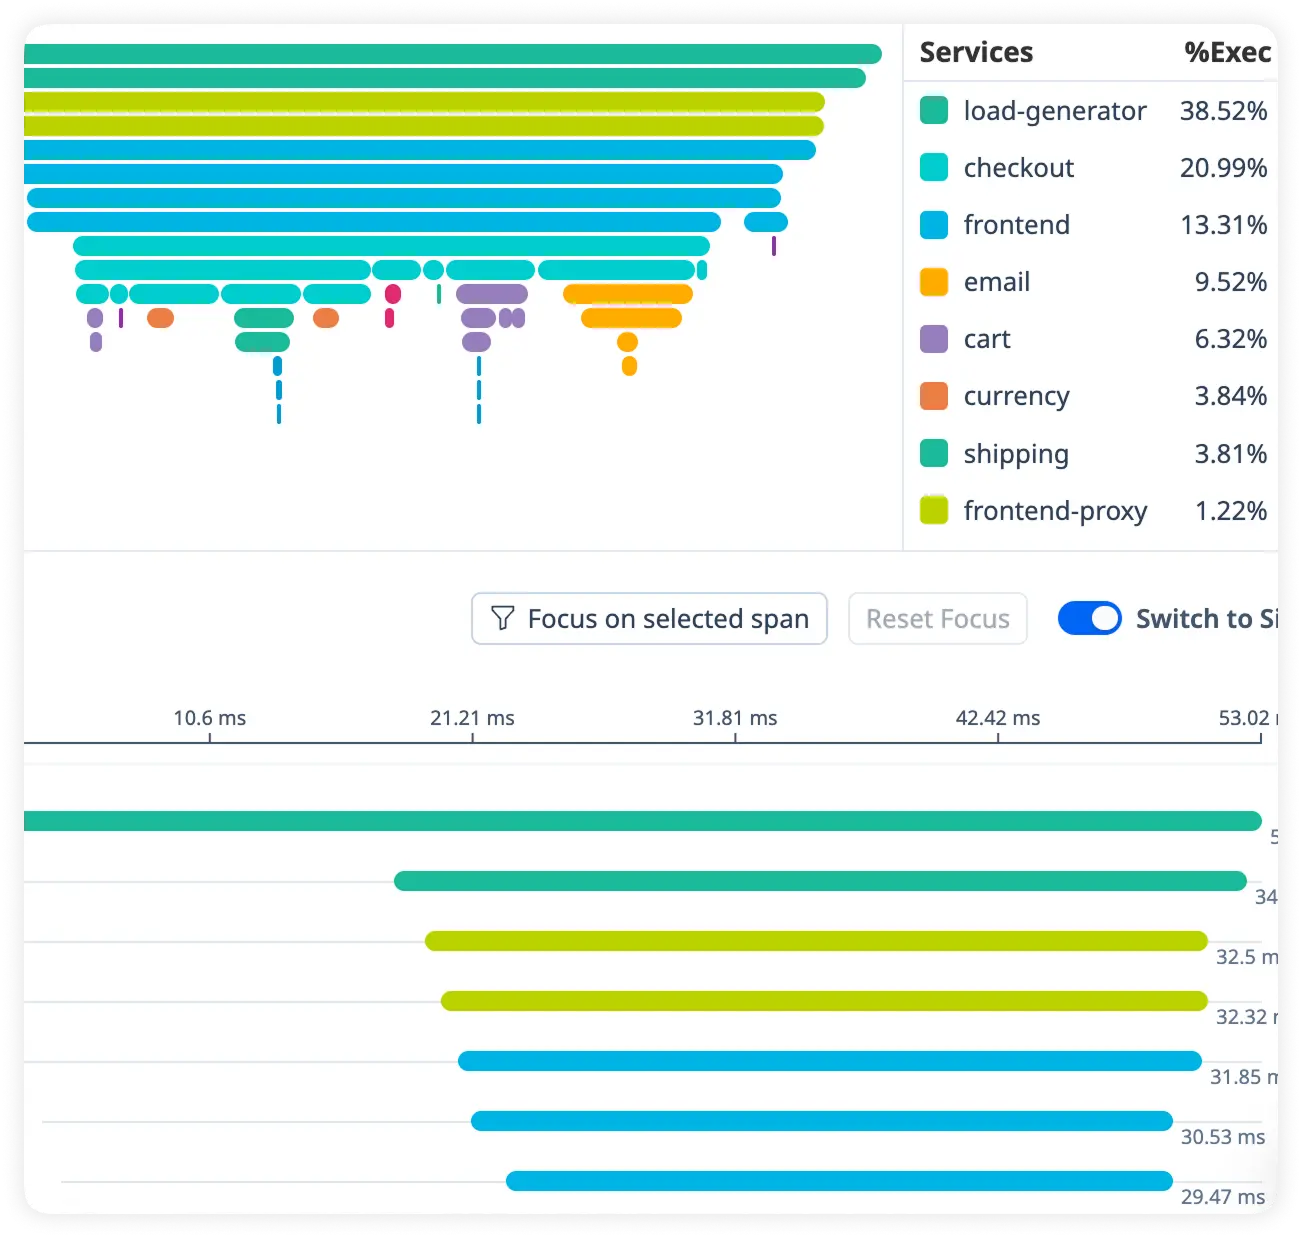
Detailed Request Duration Breakdown
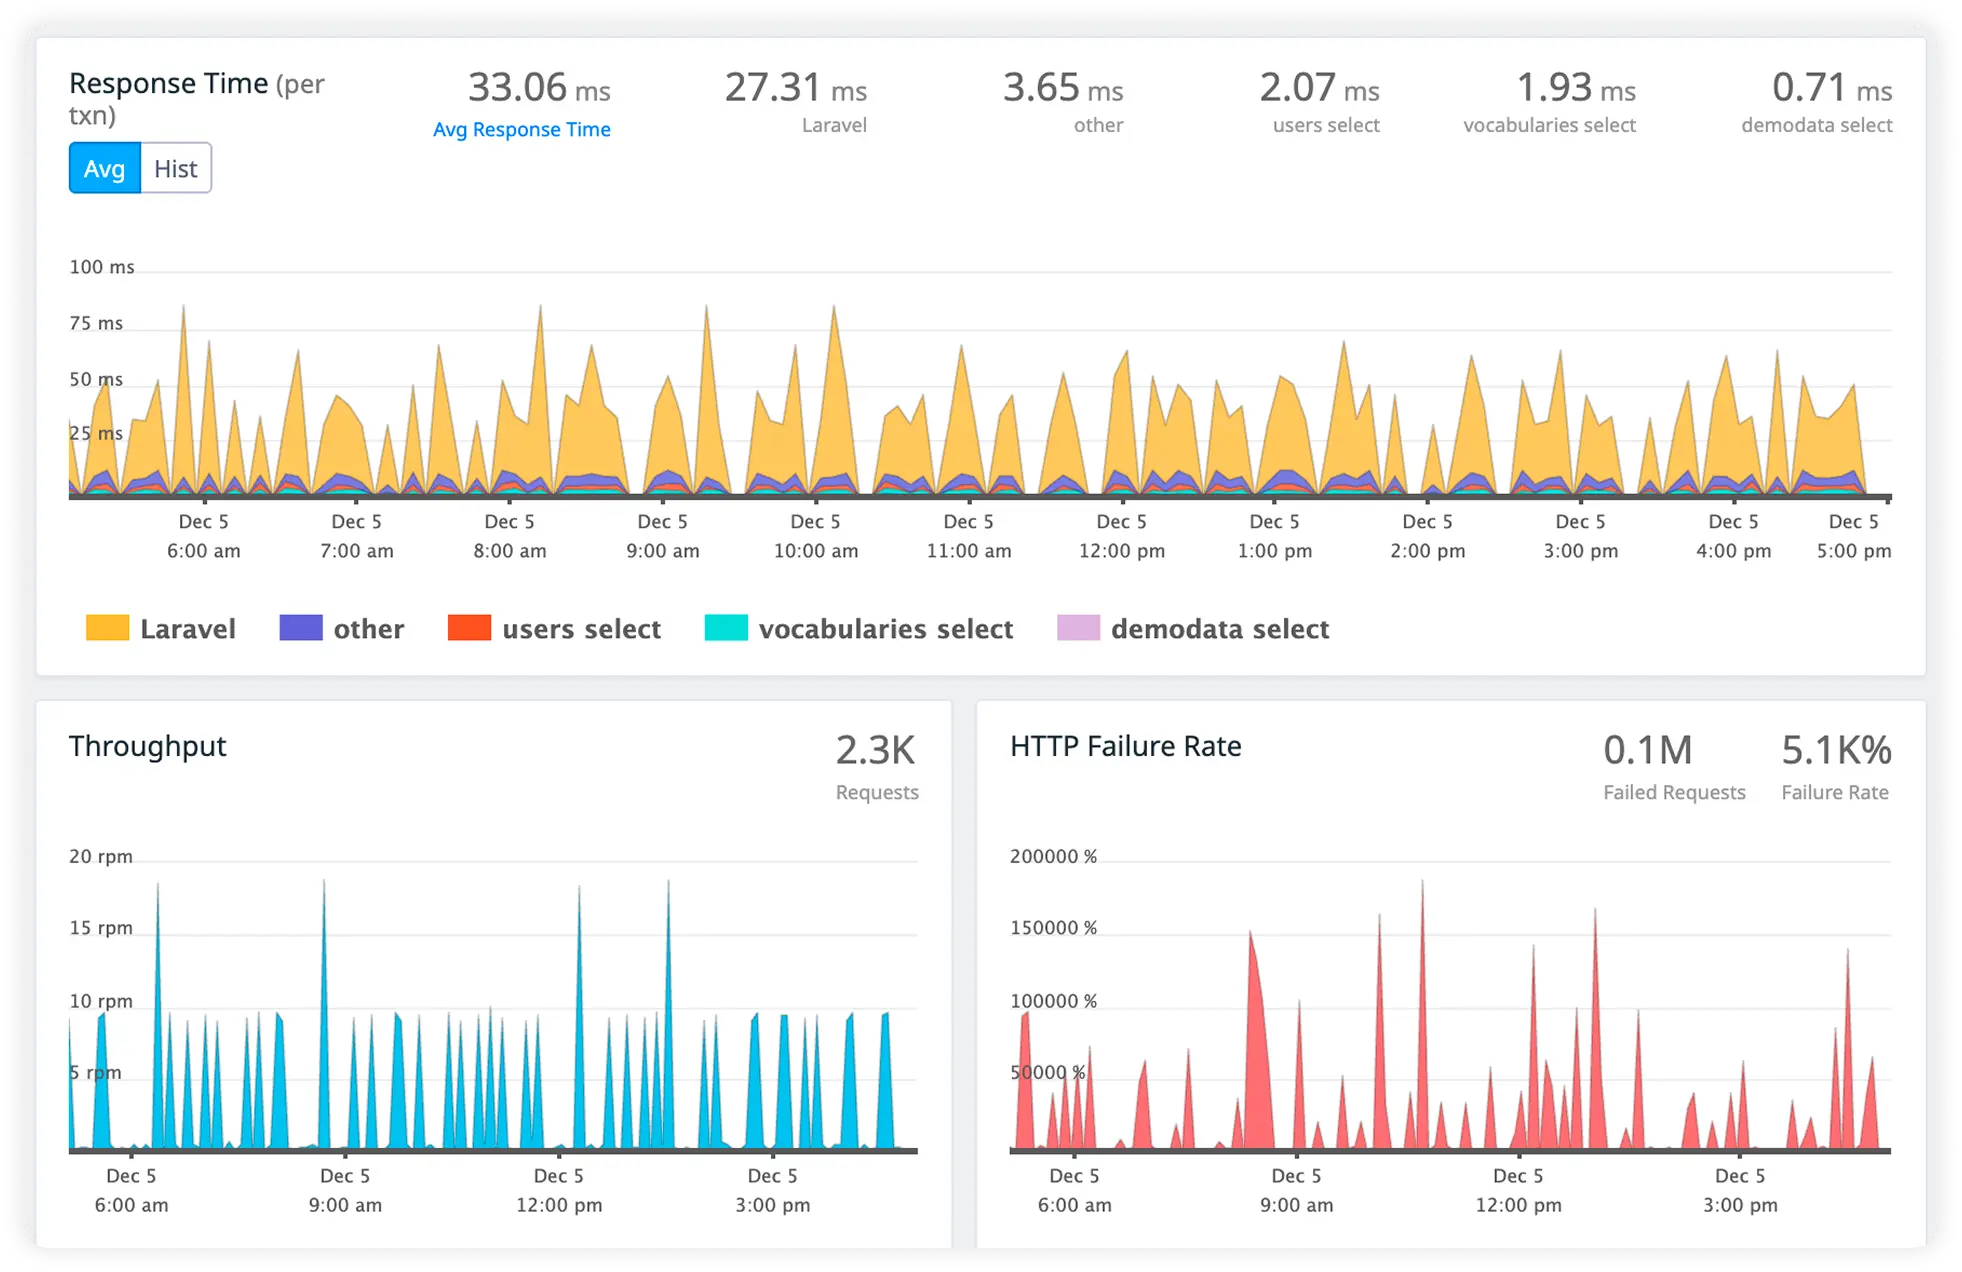
See exactly where time is spent across controllers, services, and database operations for every request. Quickly uncover slow execution paths affecting response times.
Identify Slow Database Calls
Track query execution time, frequency, and bottlenecks in real time. Eliminate inefficient database operations that degrade application speed.
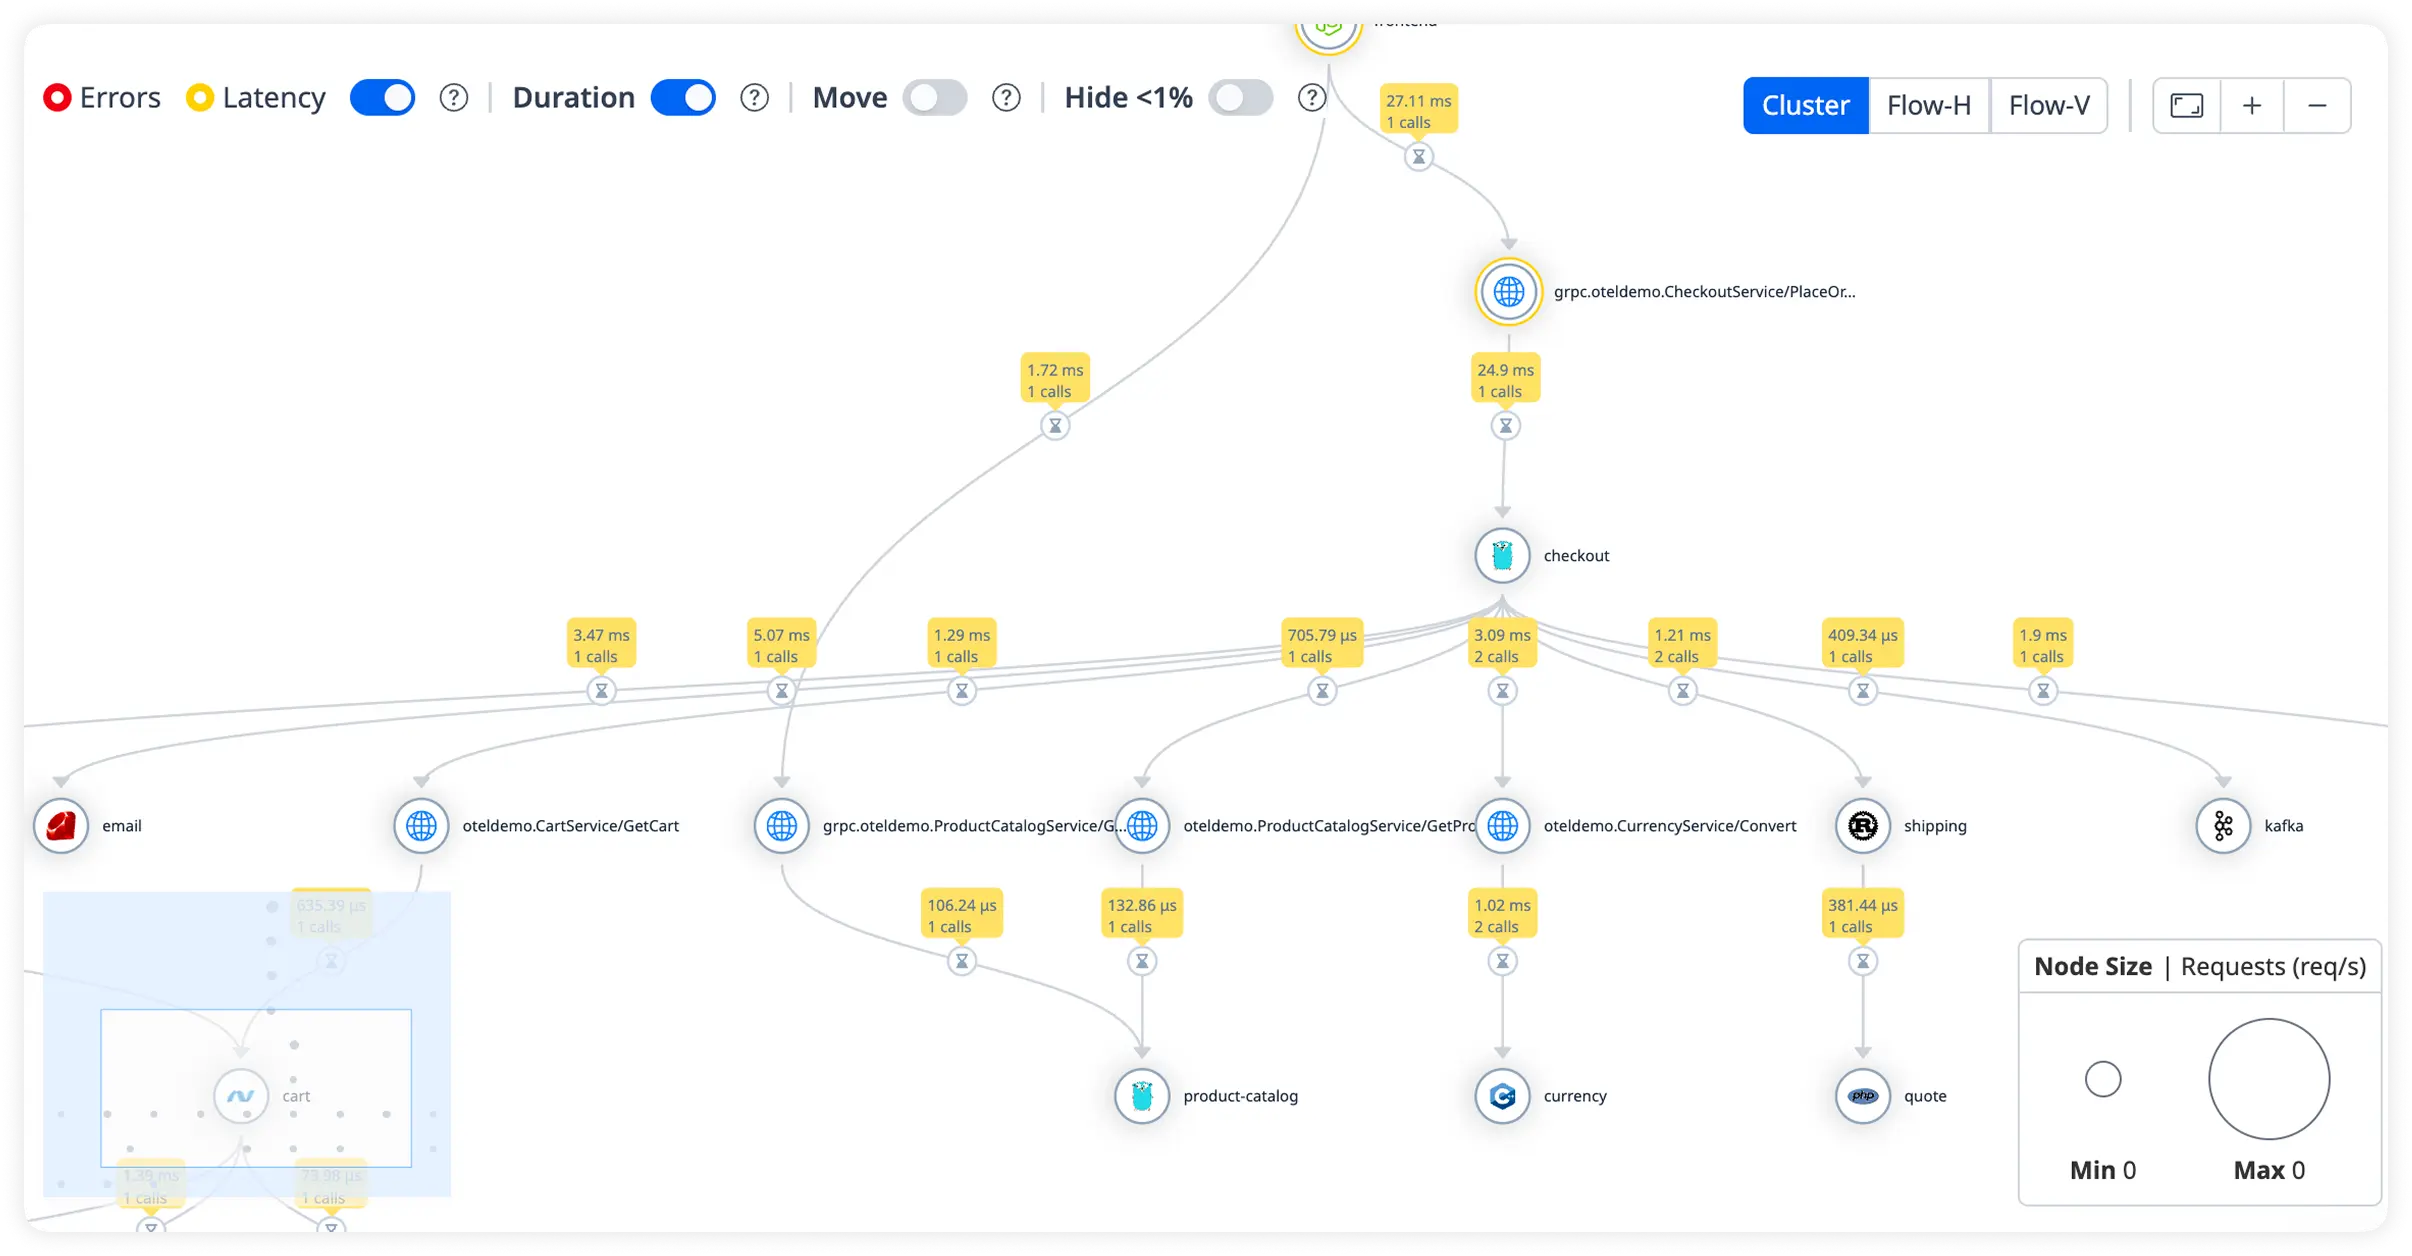
Monitor External Dependency Timing
Measure performance of third-party APIs and external services your Yii applications rely on. Detect slowdowns and failures before they impact users.
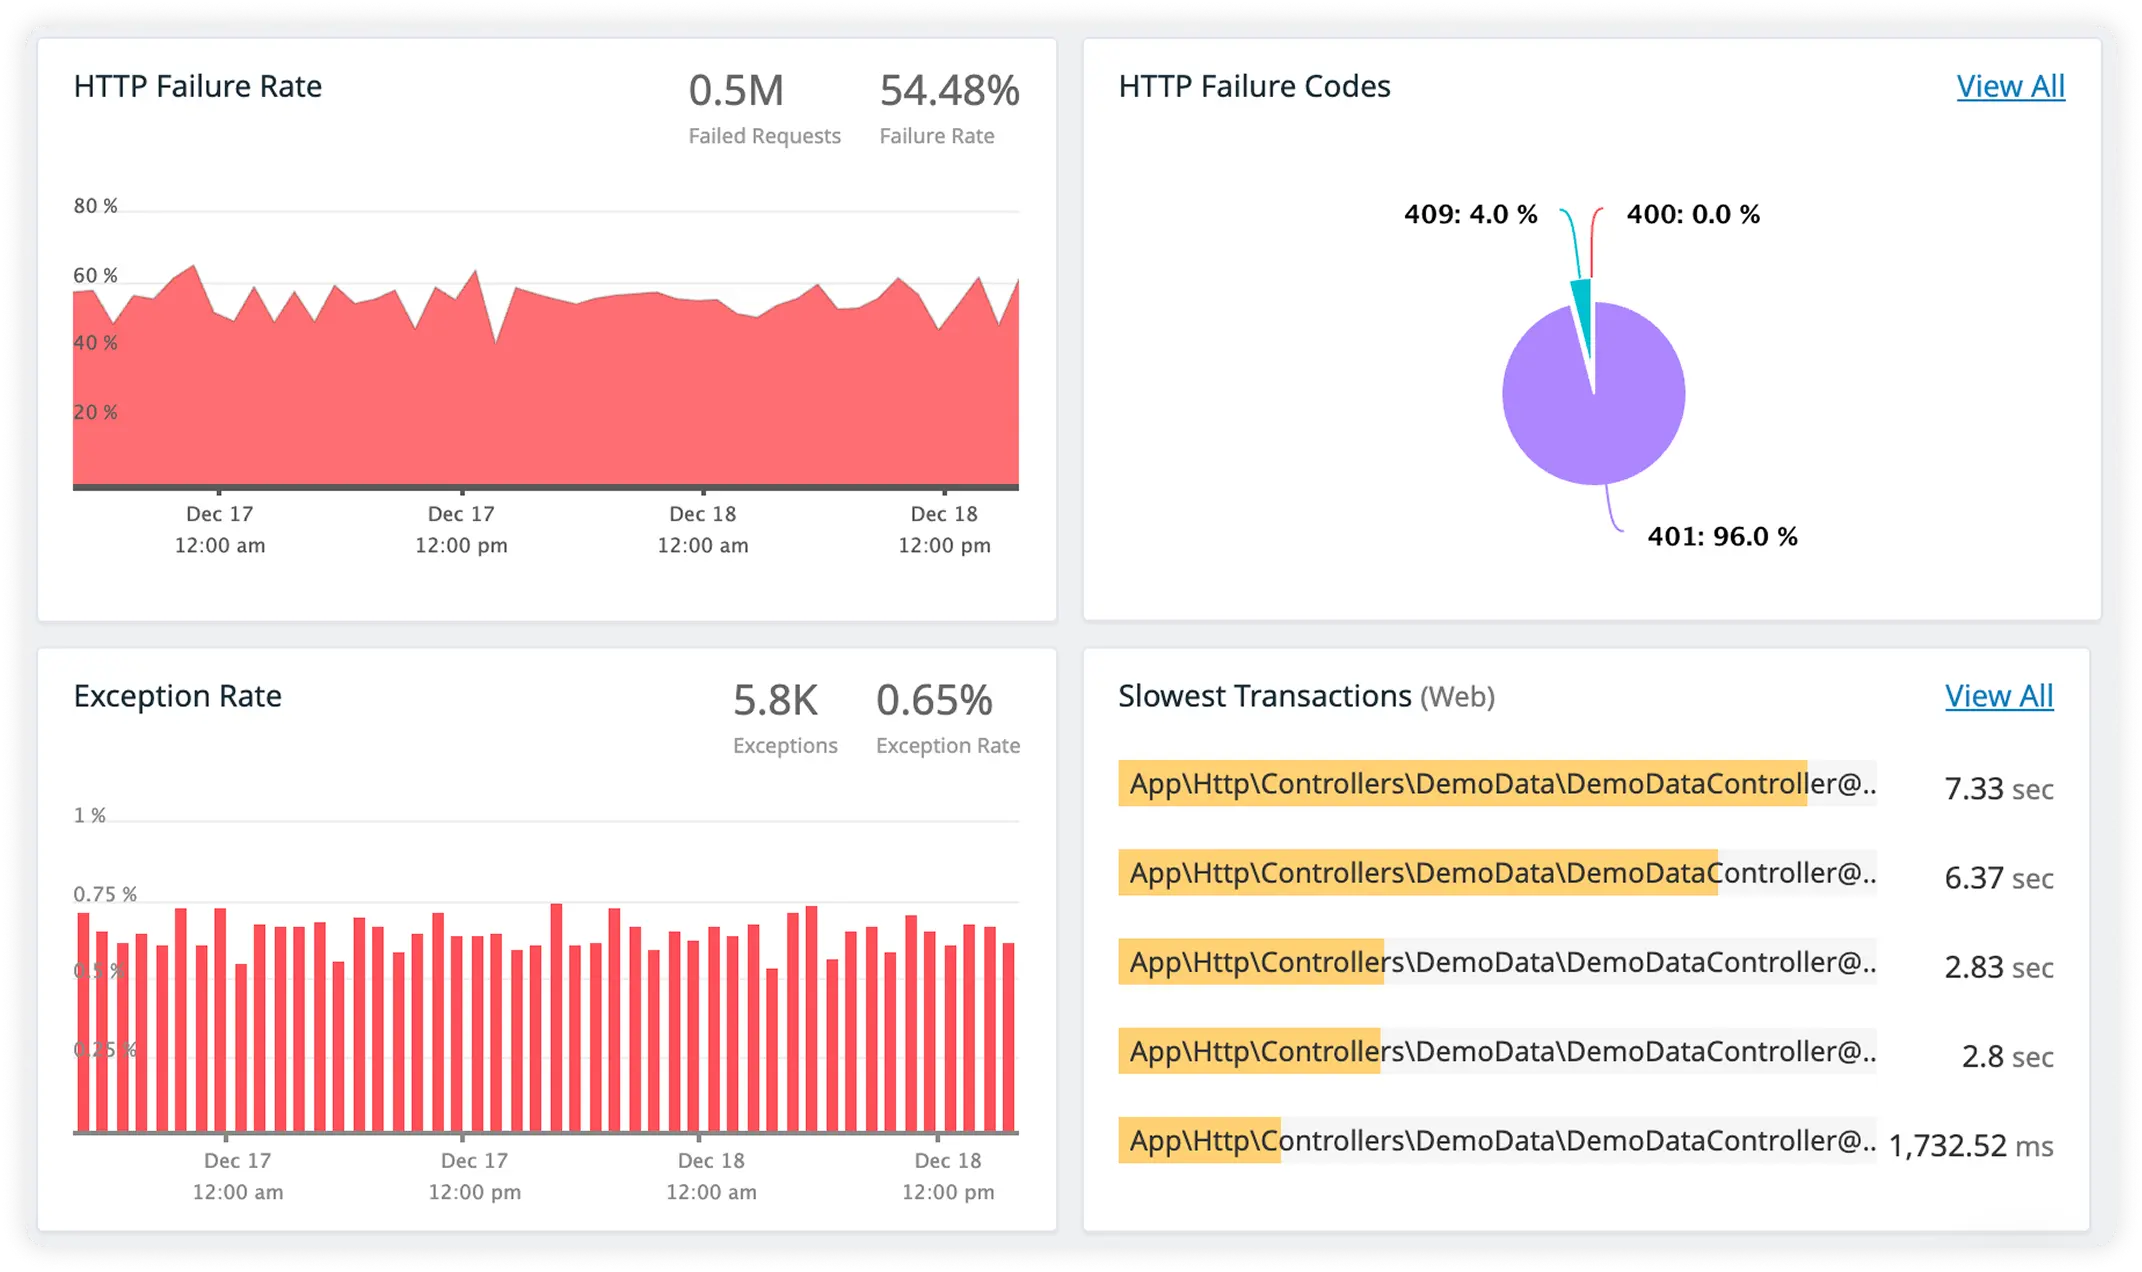
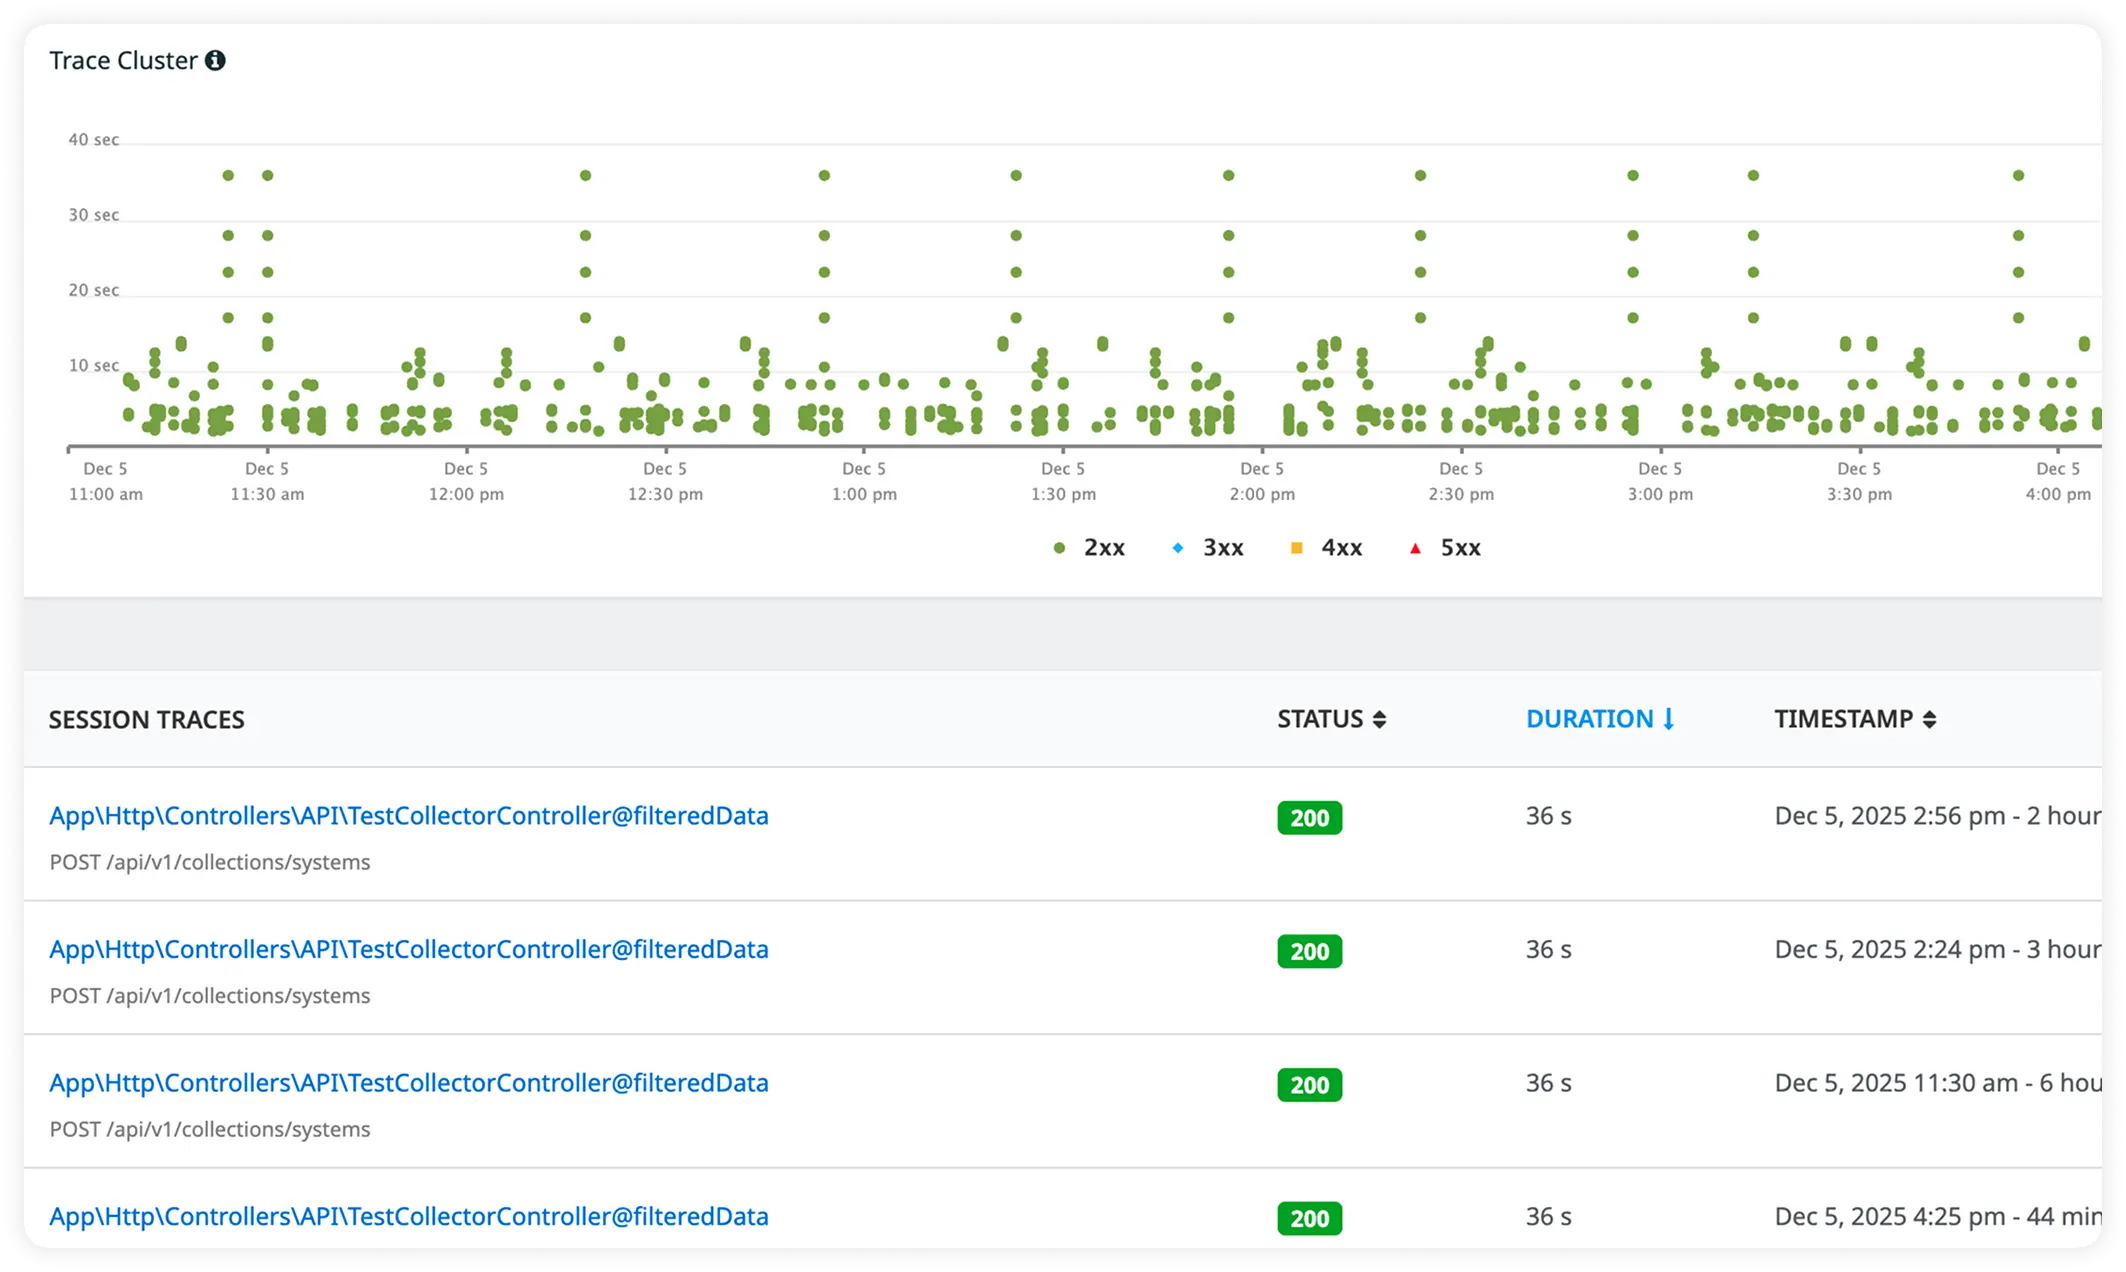
Rich Error Detail with Request-Linked Logs
Capture full error context alongside correlated logs for each request. Debug faster with complete visibility across errors, traces, and logs in one place.
Why Engineering Teams Choose Atatus for Yii Performance Monitoring?
Engineering teams choose Atatus to understand Yii behavior in production without adding operational drag. The decision is about precision, speed, and reliability at scale.
Runtime Clarity
Yii request execution becomes observable in production, exposing controller flow, lifecycle transitions, and runtime behavior under real traffic.
Adoption Simplicity
Integration aligns with existing Yii runtime setups without requiring architectural changes or release pipeline disruption.
Shared Runtime Context
Platform, SRE, and backend teams analyze incidents using the same Yii execution perspective instead of fragmented signals.
Incident Framing
Failures are investigated through request flow, blocking operations, and runtime constraints rather than alert volume.
Scaling Predictability
Yii behavior under concurrency, growing datasets, and background processing remains interpretable as load increases.
Signal Fidelity
Collected data reflects actual Yii execution behavior, avoiding approximations introduced by sampling or inference.
Engineering Onboarding
New engineers understand real production execution paths without relying on undocumented debugging knowledge.
Execution Boundaries
Performance tuning and remediation decisions are guided by observed execution limits and resource contention patterns.
Resource Discipline
Remediation efforts focus on managing execution pressure across memory, concurrency, and processing boundaries.
Unified Observability for Every Engineering Team
Atatus adapts to how engineering teams work across development, operations, and reliability.
Developers
Trace requests, debug errors, and identify performance issues at the code level with clear context.
DevOps
Track deployments, monitor infrastructure impact, and understand how releases affect application stability.
Release Engineer
Measure service health, latency, and error rates to maintain reliability and reduce production risk.