Zend Application Performance Monitoring
Get end-to-end visibility into your Zend performance with application monitoring tools. Gain insightful metrics on performance bottlenecks with PHP monitoring to optimize your application.
Where Zend Behavior Becomes Unpredictable at Scale?
Blind Requests
Traffic flows through Zend, but engineers cannot see which requests degrade first under load. Failures show up as user complaints, not engineering signals.
Hidden Bottlenecks
Performance issues hide inside PHP execution paths, extensions, and shared resources. Teams know something is slow but not where time is actually spent.
No Failure Narrative
Errors appear as isolated events. There is no clear story of what happened before, during, and after the failure across services.
Delayed Detection
Zend apps degrade gradually. By the time alerts trigger, latency has already cascaded across dependent systems.
Fragmented Signals
Metrics, logs, and traces live in different tools. Engineers mentally stitch evidence together while production continues to burn.
Scale Side Effects
What works in staging fails at real traffic volumes. Memory pressure, concurrency limits, and connection pooling break silently.
Debugging Guesswork
Root cause analysis becomes hypothesis driven. Teams test assumptions instead of validating facts.
Incident Escalation Loops
Incidents move across teams without converging on a root cause. Each handoff adds context loss, assumptions compound, and resolution depends on partial evidence rather than system behavior.
Complete Runtime Visibility for
Zend Applications
Production-grade observability for Zend that helps teams understand application behavior, diagnose performance issues, and keep systems operating reliably.
Detailed Request Latency Breakdown
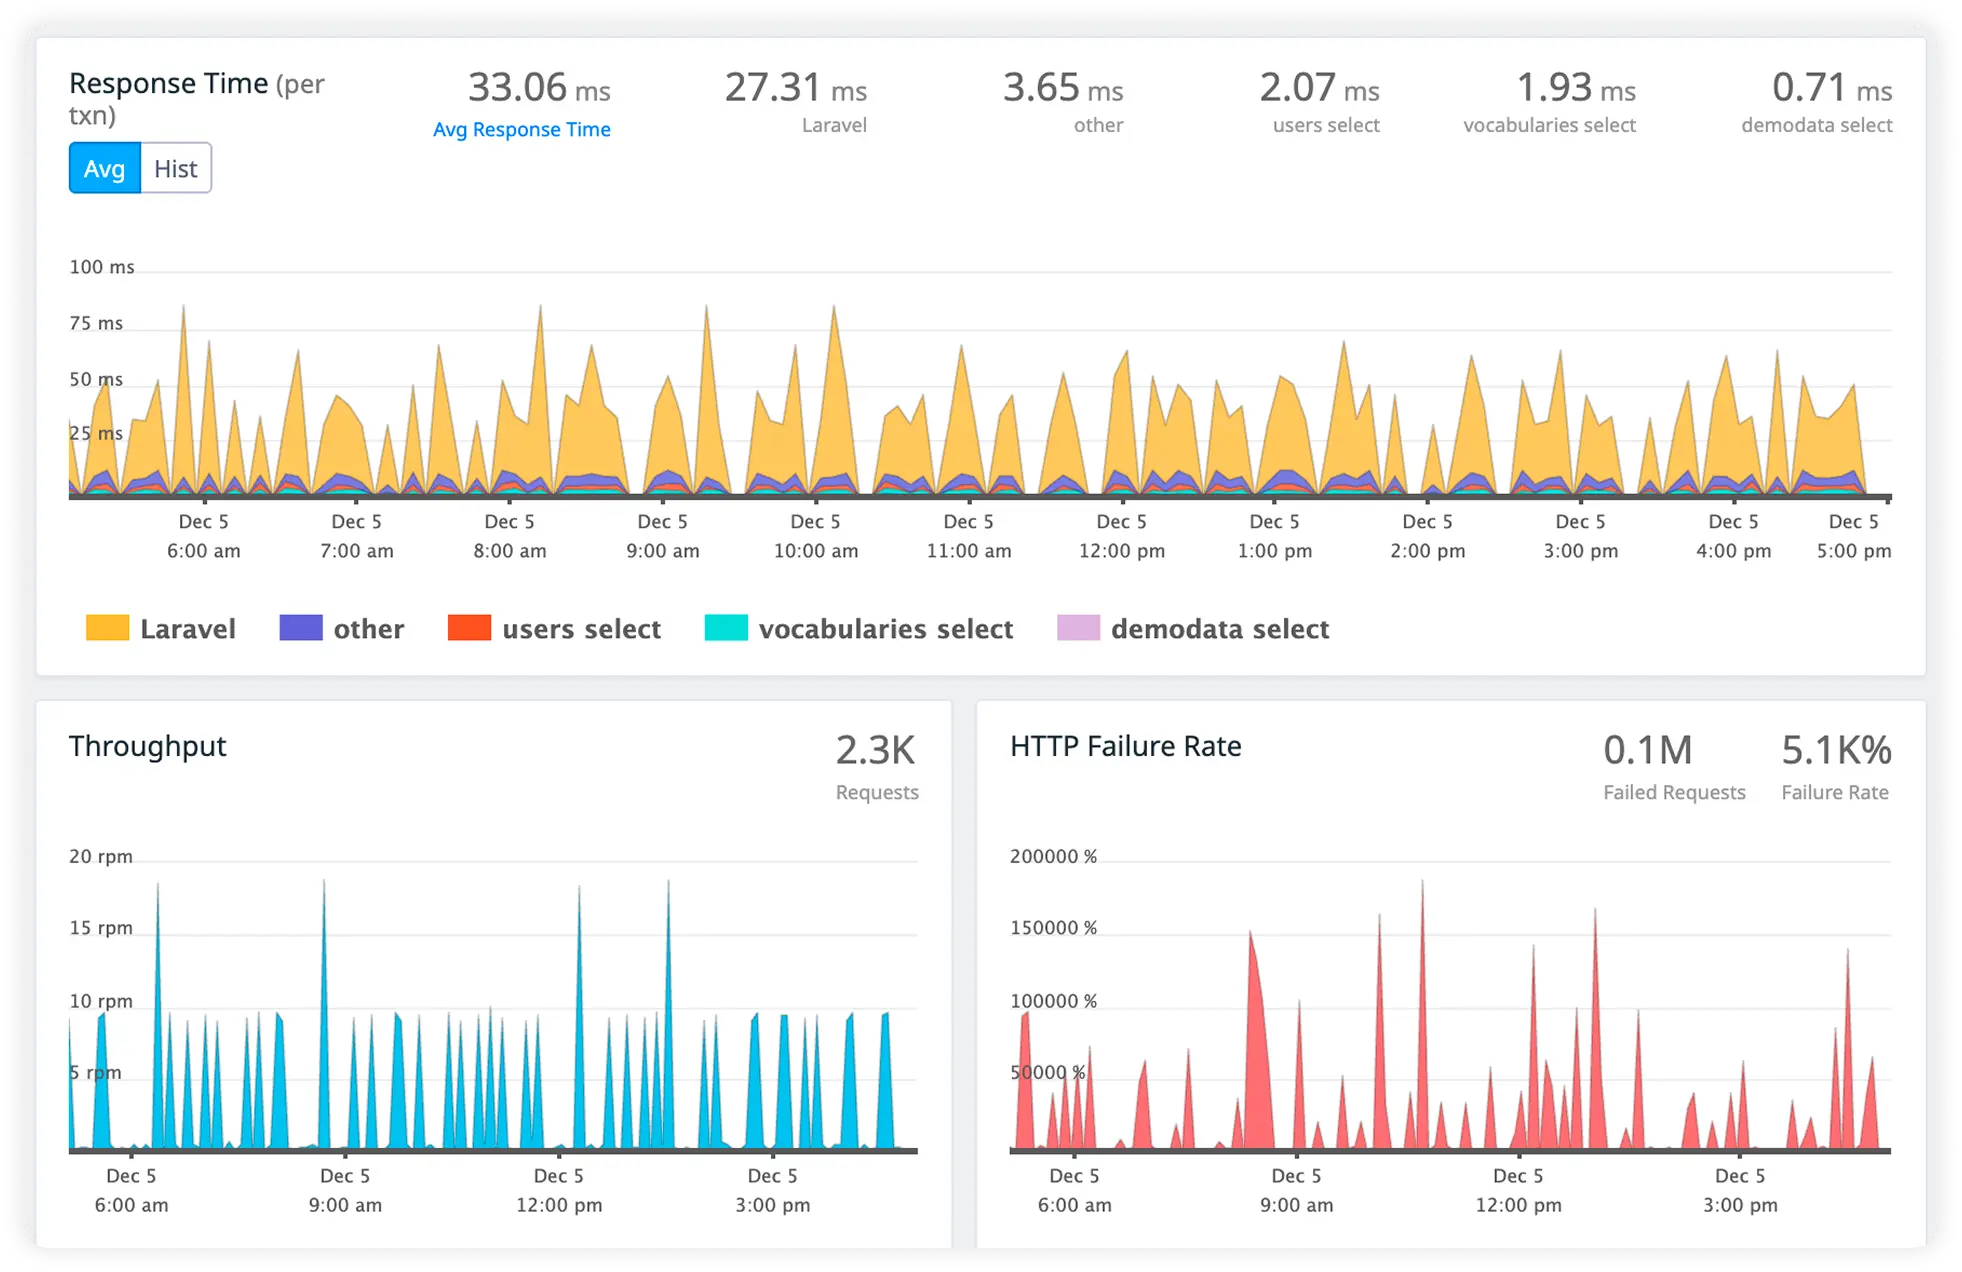
Break down each request to see where time is spent across controllers, services, and database operations. Quickly identify slow execution paths impacting overall response times.
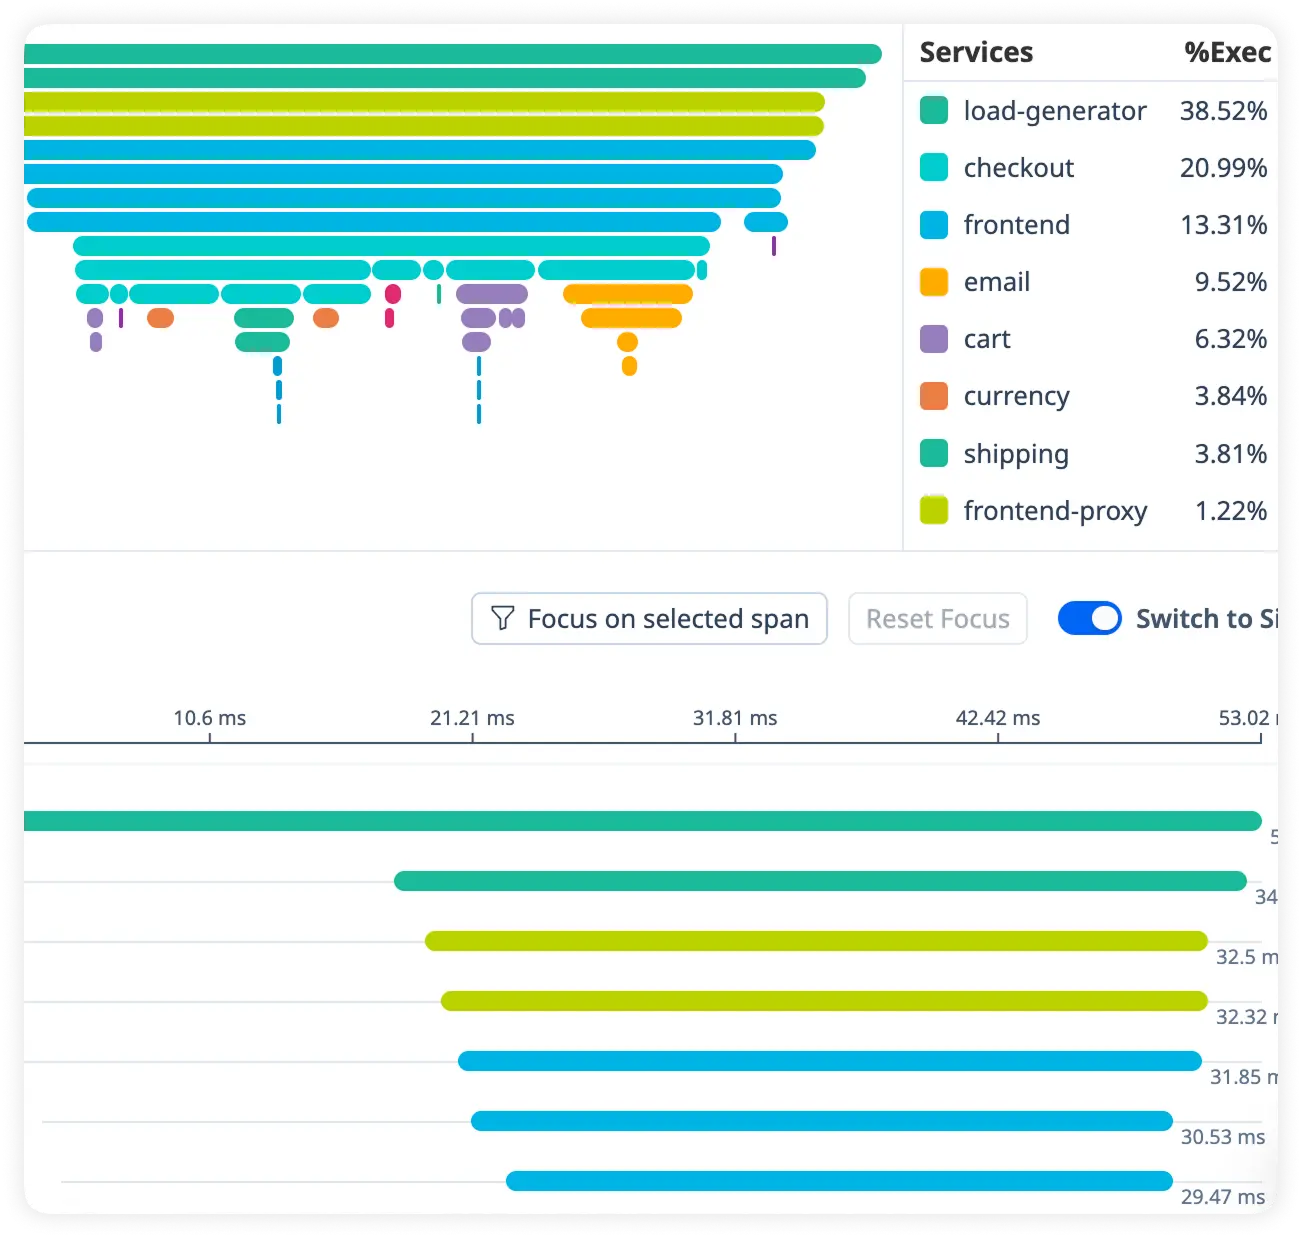
Precise Slow Call Attribution
Attribute latency to specific functions, internal services, or external calls within your Zend application. Pinpoint the exact components responsible for performance slowdowns.
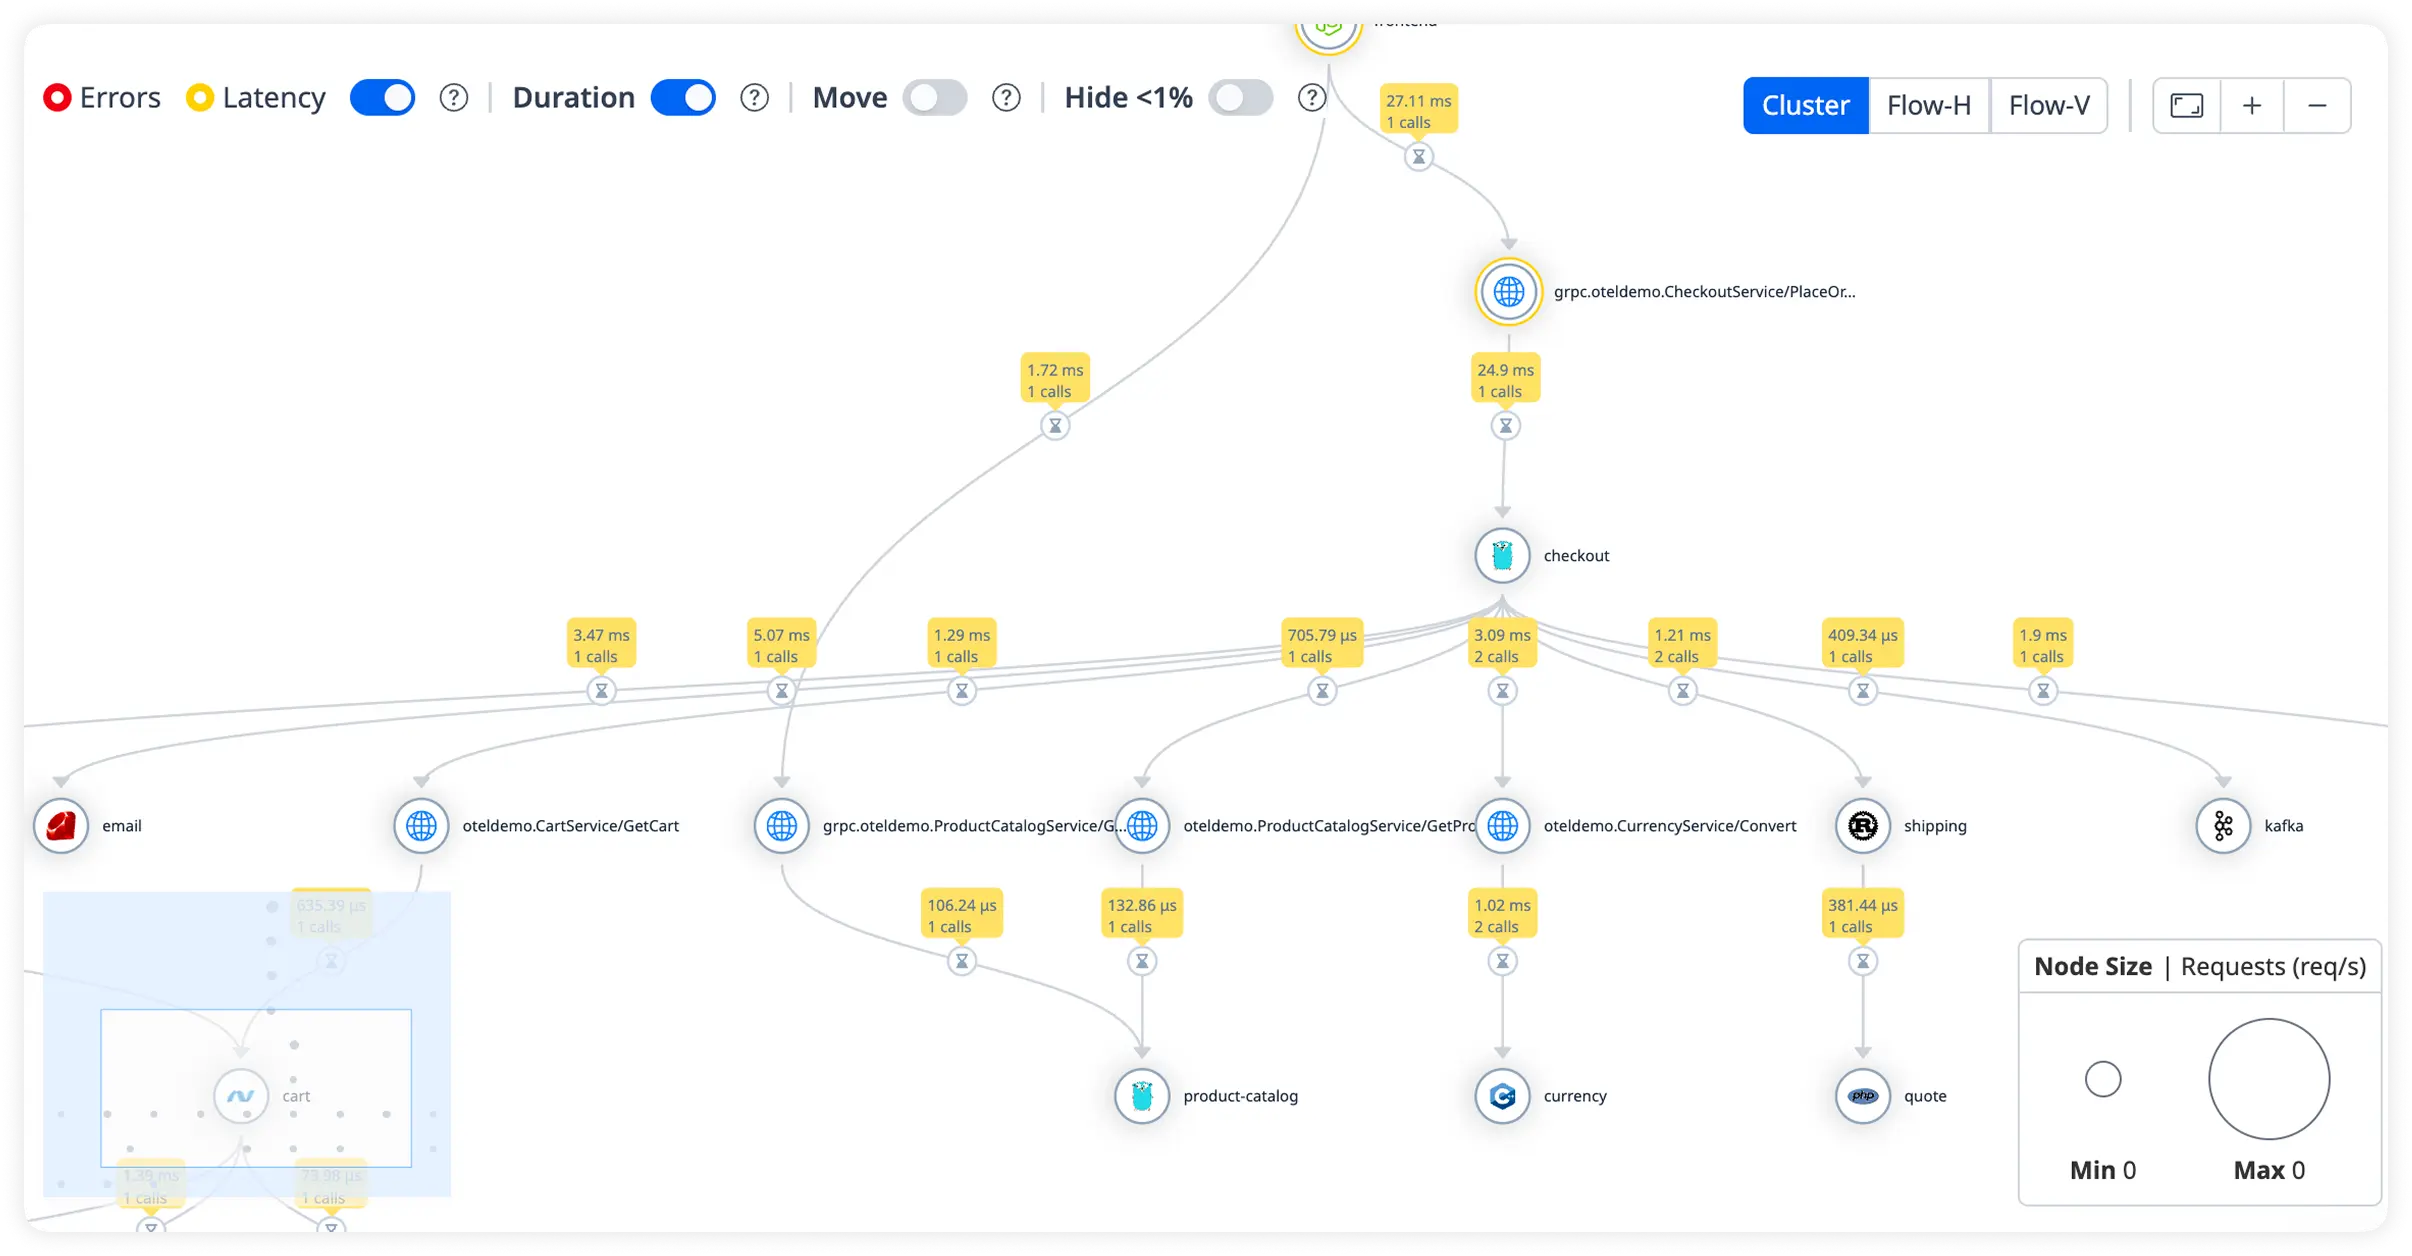
Real-Time Dependency Timing
Track response times across third-party services, APIs, and internal dependencies in real time. Understand how external systems influence overall application performance.
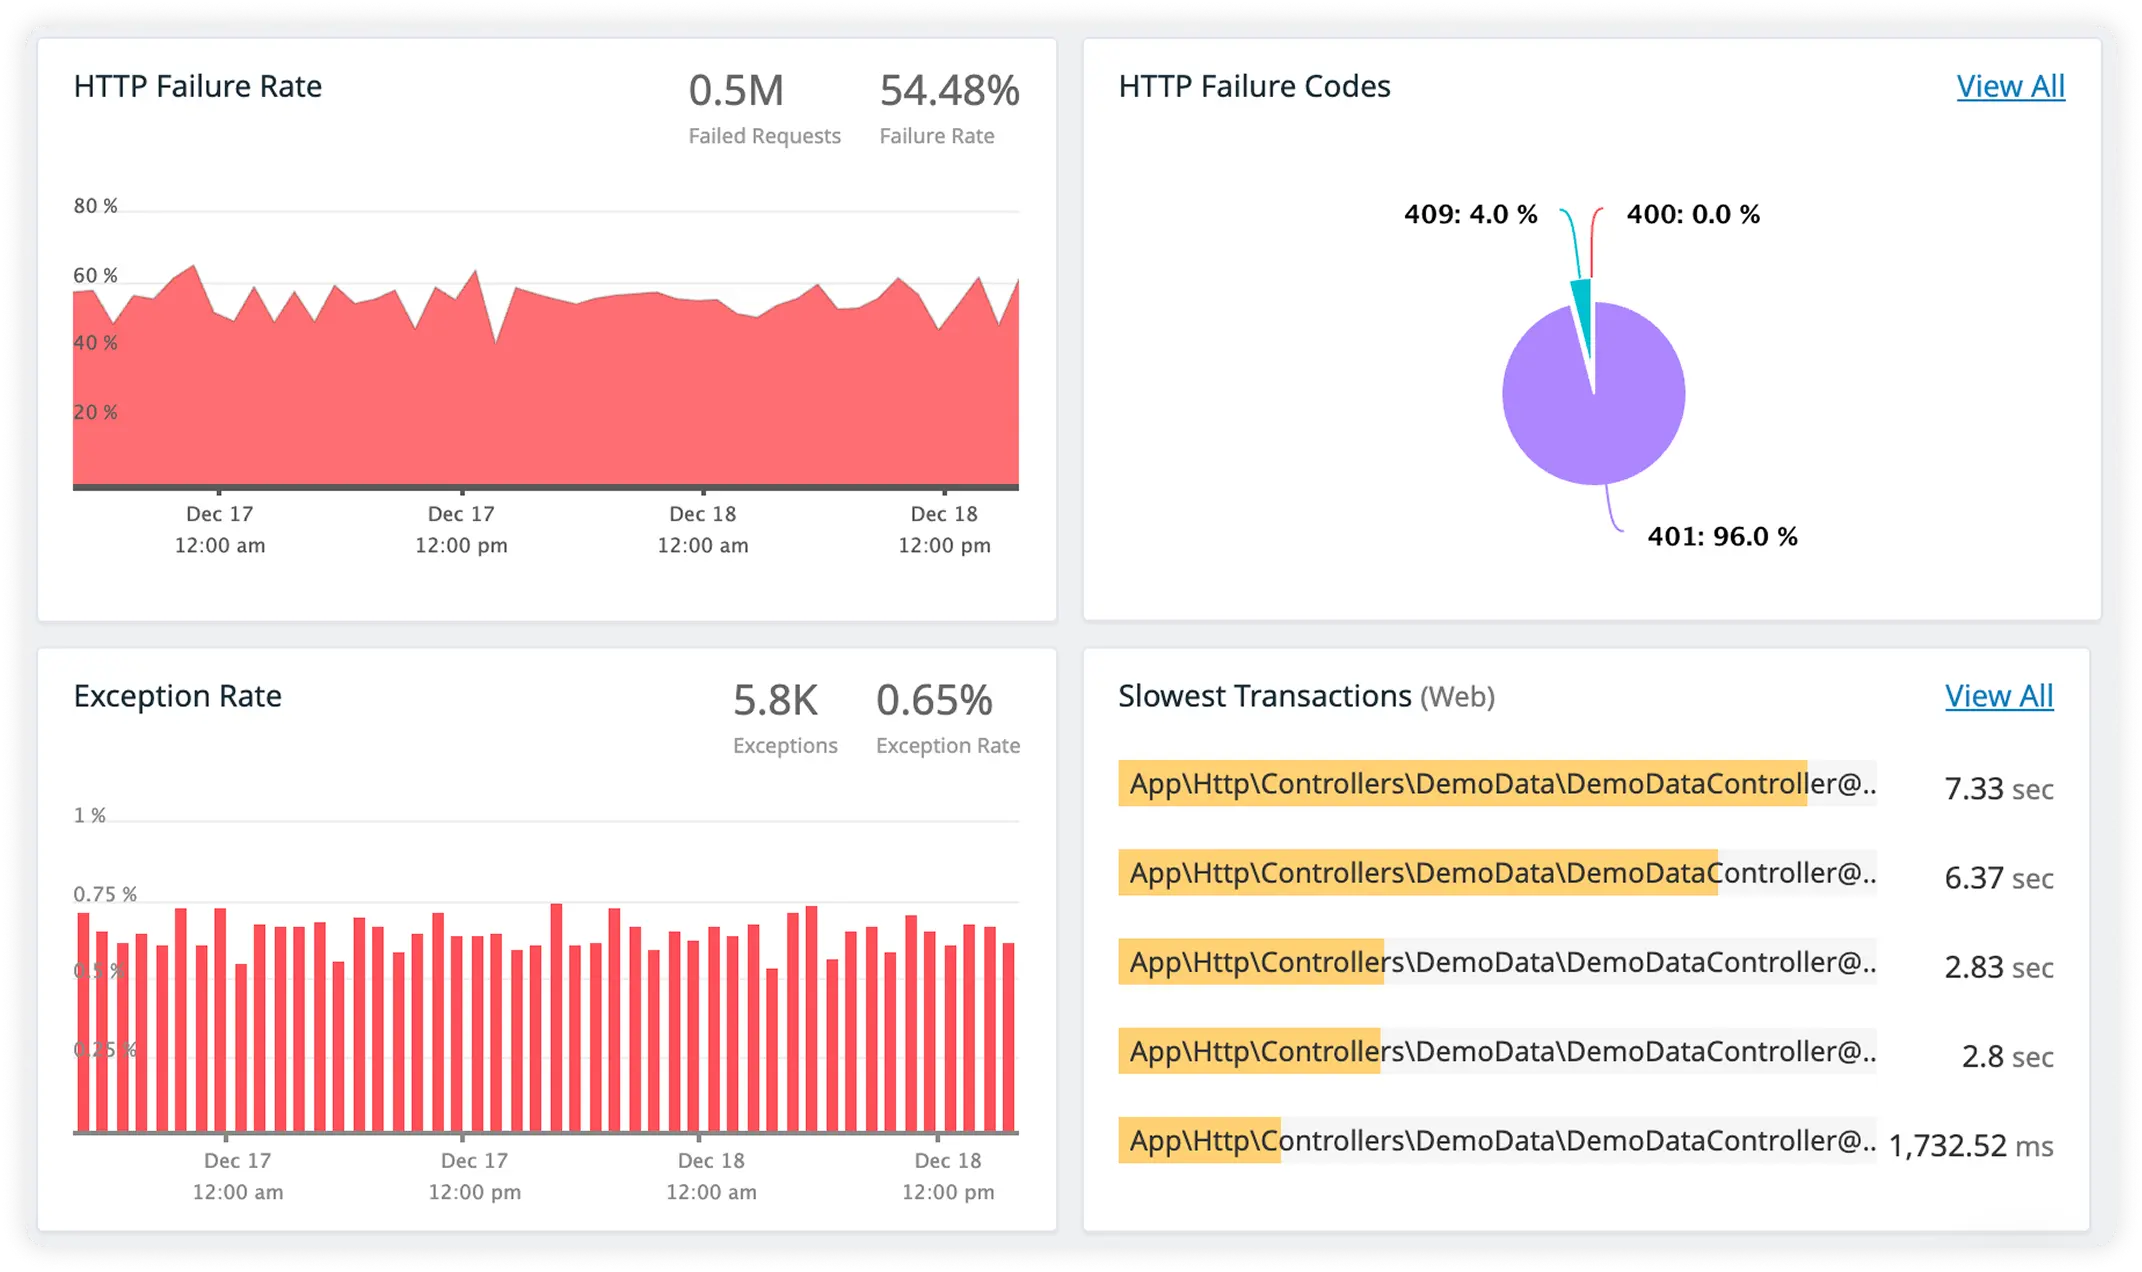
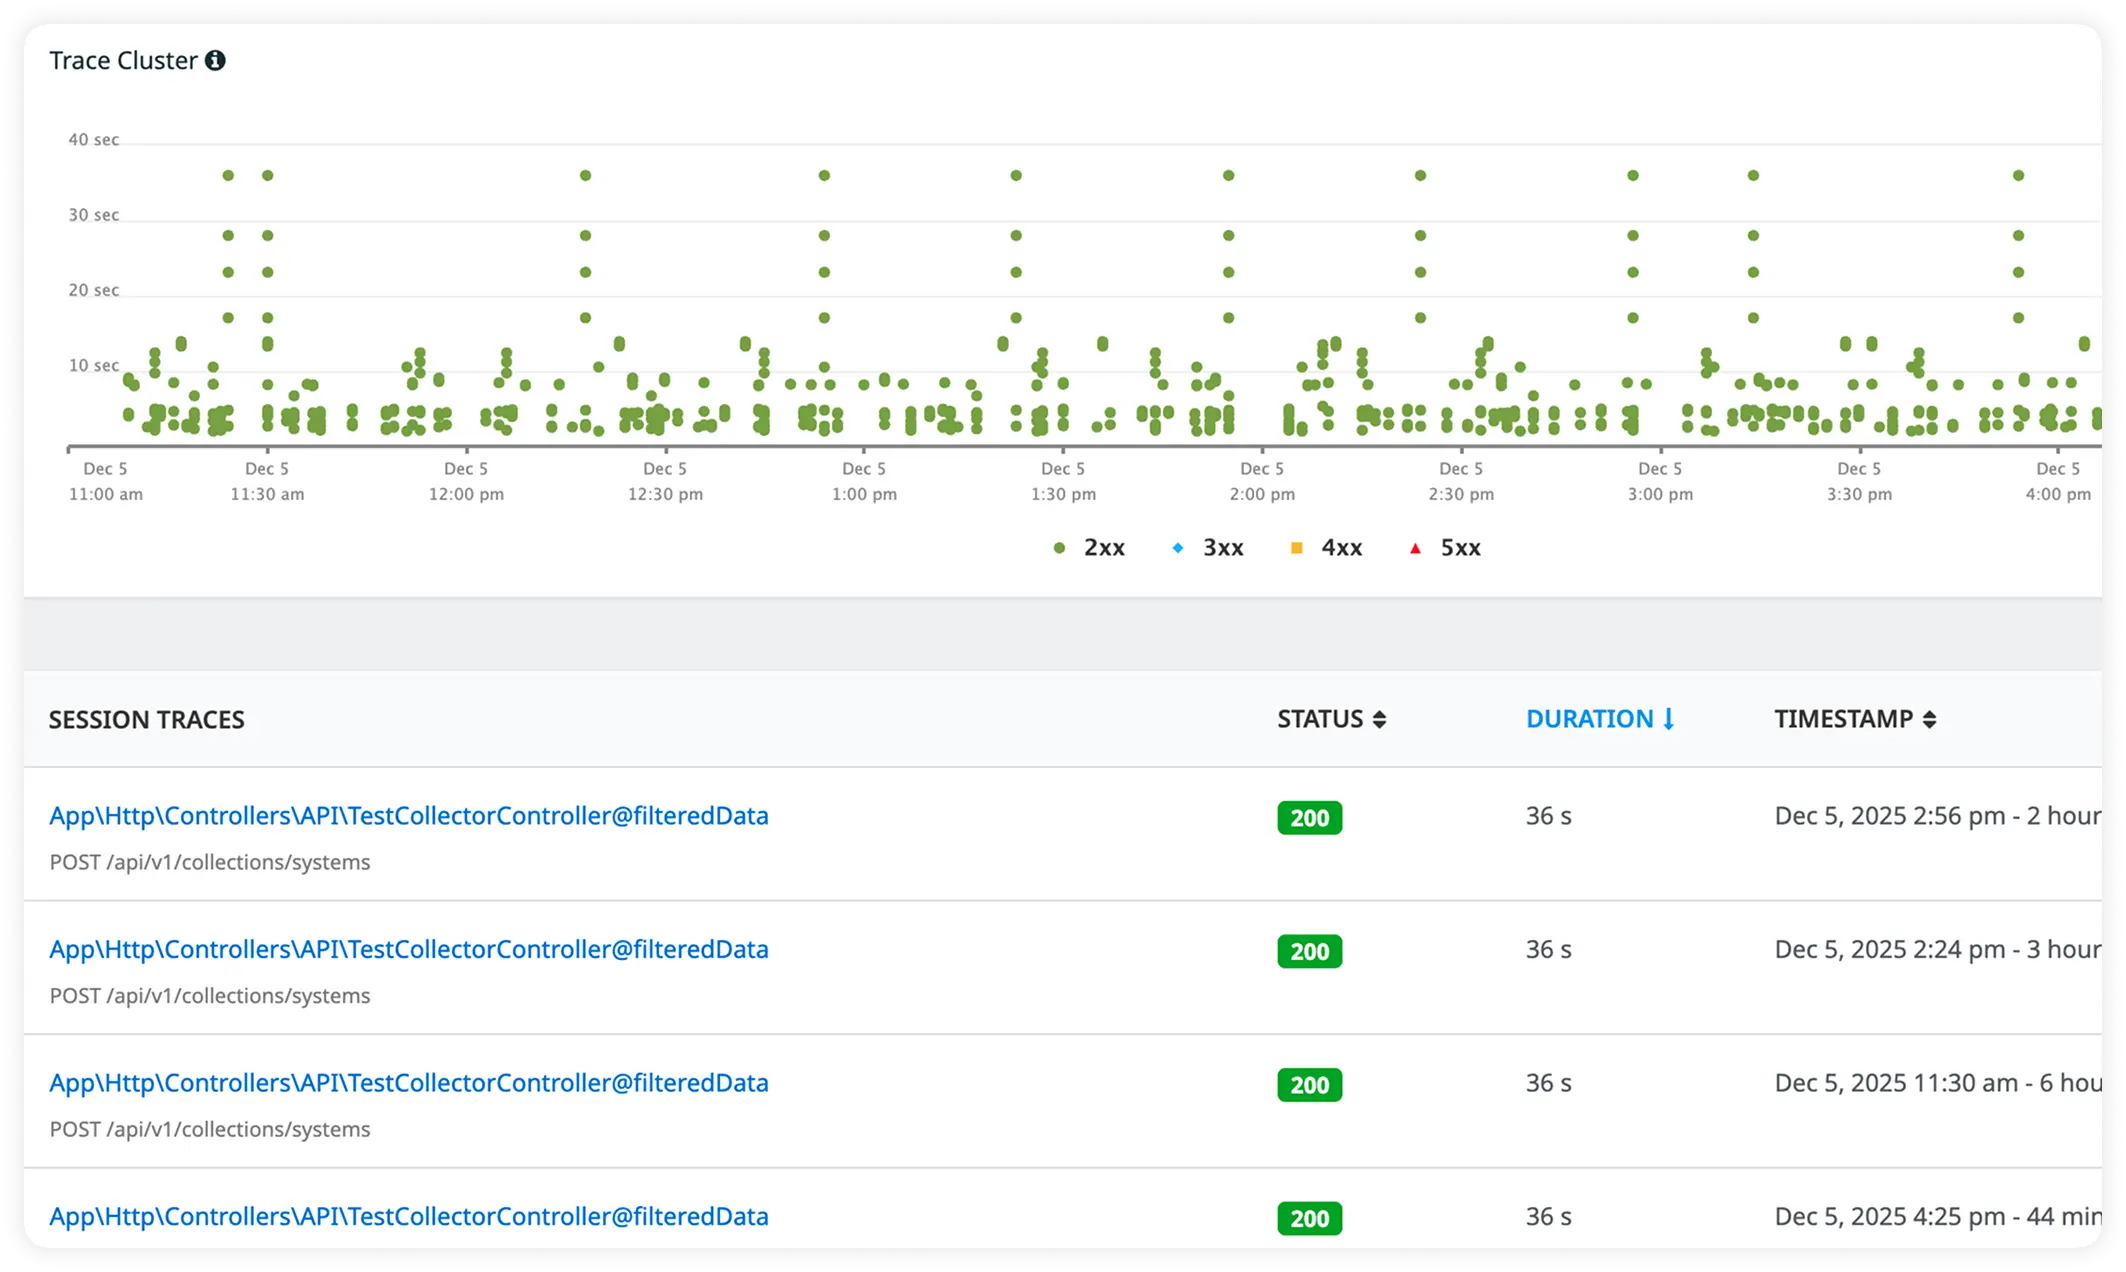
Rich Exception Context with Trace-Linked Logs
Capture full exception details alongside correlated logs for every request. Debug faster with complete context across traces, logs, and errors in one unified view.
Why Engineering Teams Choose Atatus for Zend Observability?
Engineering teams choose Atatus when they need confidence in Zend systems under real production pressure. The decision is about clarity, speed, and trust at scale.
Runtime Visibility
Zend execution behavior is visible in production, making slow paths and degradation patterns clear without recreating traffic elsewhere.
Execution Insight
Request flow through the Zend Engine can be understood at runtime instead of inferred from symptoms.
Production Grounding
Analysis is based on real traffic and real load, not staging assumptions or synthetic tests.
Scale Awareness
Zend behavior under concurrency, memory pressure, and high throughput remains explainable as traffic grows.
Faster Diagnosis
Performance issues are identified through observed execution behavior, reducing time spent testing assumptions during incident response.
Consistent Context
Platform, SRE, and backend teams evaluate incidents using the same Zend runtime context, minimizing misalignment during investigations.
Reduced Recurrence
By addressing execution-level issues, teams reduce the likelihood of recurring performance problems caused by the same underlying constraints.
Predictable Tuning
Performance tuning decisions are guided by measured Zend runtime limits, making optimizations more reliable and repeatable.
Release Predictability
Zend behavior after releases can be evaluated against prior execution patterns to detect unintended regressions.
Unified Observability for Every Engineering Team
Atatus adapts to how engineering teams work across development, operations, and reliability.
Developers
Trace requests, debug errors, and identify performance issues at the code level with clear context.
DevOps
Track deployments, monitor infrastructure impact, and understand how releases affect application stability.
Release Engineer
Measure service health, latency, and error rates to maintain reliability and reduce production risk.