Real-Time Dynamic Dashboards
Your Data, Your Way With Real-Time Logs, Traces, and Metrics at a Glance.
Dashboard and Visibility Challenges
Without unified dashboards, teams face these critical monitoring and troubleshooting challenges:
Tool Switching Slows Down Troubleshooting
Engineers waste time switching between multiple monitoring tools to correlate metrics, logs, and traces, losing context and delaying incident resolution.
"As a DevOps engineer, I have to switch between 5 different dashboards to understand a single performance issue, wasting 30 minutes every incident."
Lack of Unified Visibility Across Stack
Fragmented monitoring across application, infrastructure, and user experience layers makes it impossible to see the full picture of system health.
"As a platform lead, I can see my application metrics are fine, but have no idea why users are complaining about slow performance because I can't see frontend metrics."
Custom Metrics Are Difficult to Visualize
Most monitoring tools make it hard to track business-specific metrics and KPIs, forcing teams to use separate analytics tools for custom visualization needs.
"As a product manager, I want to track our payment success rate on the same dashboard as application health, but our monitoring tool doesn't support custom business metrics."
Slow Loading Dashboards During Incidents
When dashboards are needed most—during incidents—they become slow and unresponsive due to high query volumes, preventing rapid response.
"As an incident commander, during our last major outage, the dashboard took 2 minutes to load each time, making it impossible to coordinate the response effectively."
Limited Dashboard Customization Options
Rigid dashboard layouts and limited widget options make it impossible to create views that match team workflows and responsibilities.
"As a QA lead, I can't create a dashboard showing just the metrics I care about because the tool forces me to use pre-defined layouts that don't fit my needs."
No Dashboard Version Control or Backup
Accidental dashboard changes or deletions can't be reverted, and there's no way to track who changed what or restore previous configurations.
"As a monitoring admin, someone accidentally deleted our main production dashboard and we spent 4 hours recreating it from memory because there was no backup."
Built for Developers,
Loved by Teams
Experience enterprise-grade dashboards without the enterprise complexity. Get started in minutes and scale effortlessly.
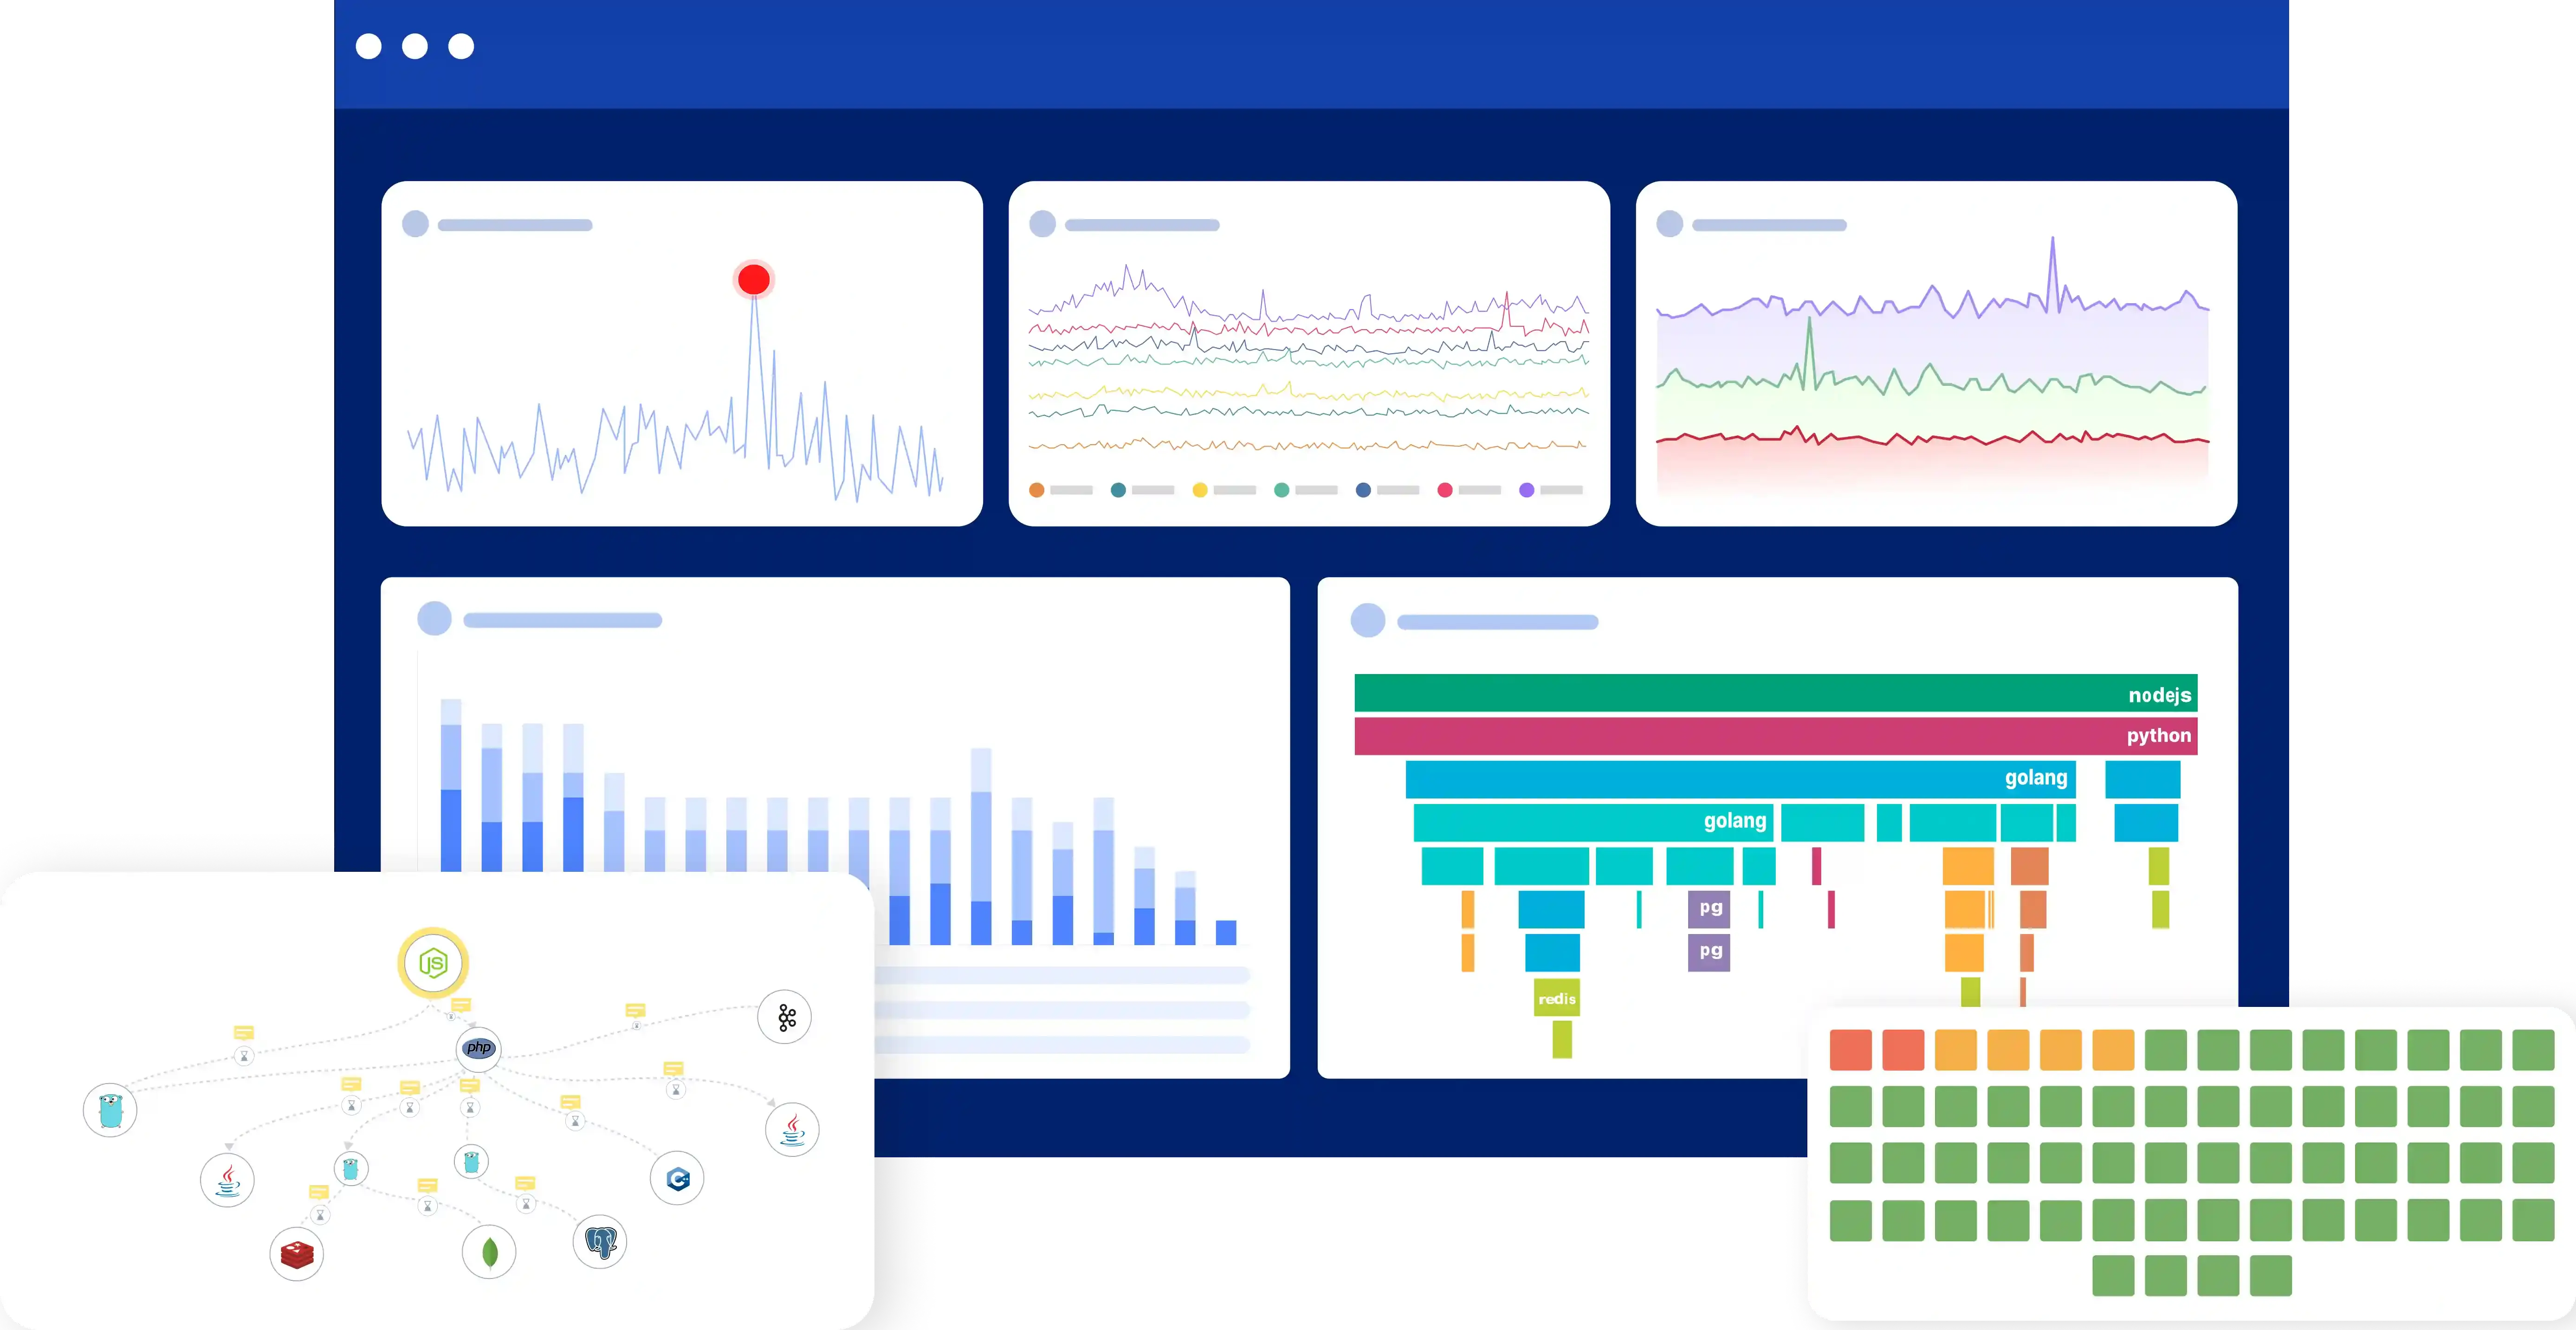
Real-Time Data Visualization
Monitor live metrics with dynamic charts and graphs. Instantly spot anomalies, performance dips, and trends across your entire stack.
Custom Dashboard Builder
Create personalized layouts with drag-and-drop controls. Add widgets, save views, and share dashboards without writing code.
Collaborative Insights
Work together in live dashboards. Share views, add comments, tag teammates, and make data-backed decisions as a unified team.
How Atatus Dashboards Accelerate Troubleshooting
Unify your monitoring with measurable improvements in incident resolution time
Unified Observability View
Single dashboard showing APM, infrastructure, logs, RUM, and synthetic monitoring. Correlate metrics across your entire stack without tool switching.
Real-Time Metric Streaming
Live streaming metrics with sub-second refresh rates. See your system's current state without delays or manual refreshes.
Custom Dashboard Builder
Drag-and-drop dashboard builder with 50+ widget types. Create custom views for different teams, roles, and use cases in minutes.
Business Metrics Integration
Track custom business KPIs alongside technical metrics. Monitor revenue, conversions, and user engagement on the same dashboard as application health.
High-Performance Visualization
Fast dashboard loading even with millions of data points. Optimized queries and caching ensure dashboards remain responsive during incidents.
Dashboard Sharing and Embedding
Share dashboards with stakeholders via public links or embed them in internal tools. Create TV displays for NOC centers and war rooms.
Everything You Need to
Visualize & Analyze
Production-ready dashboard features that help you monitor faster with confidence
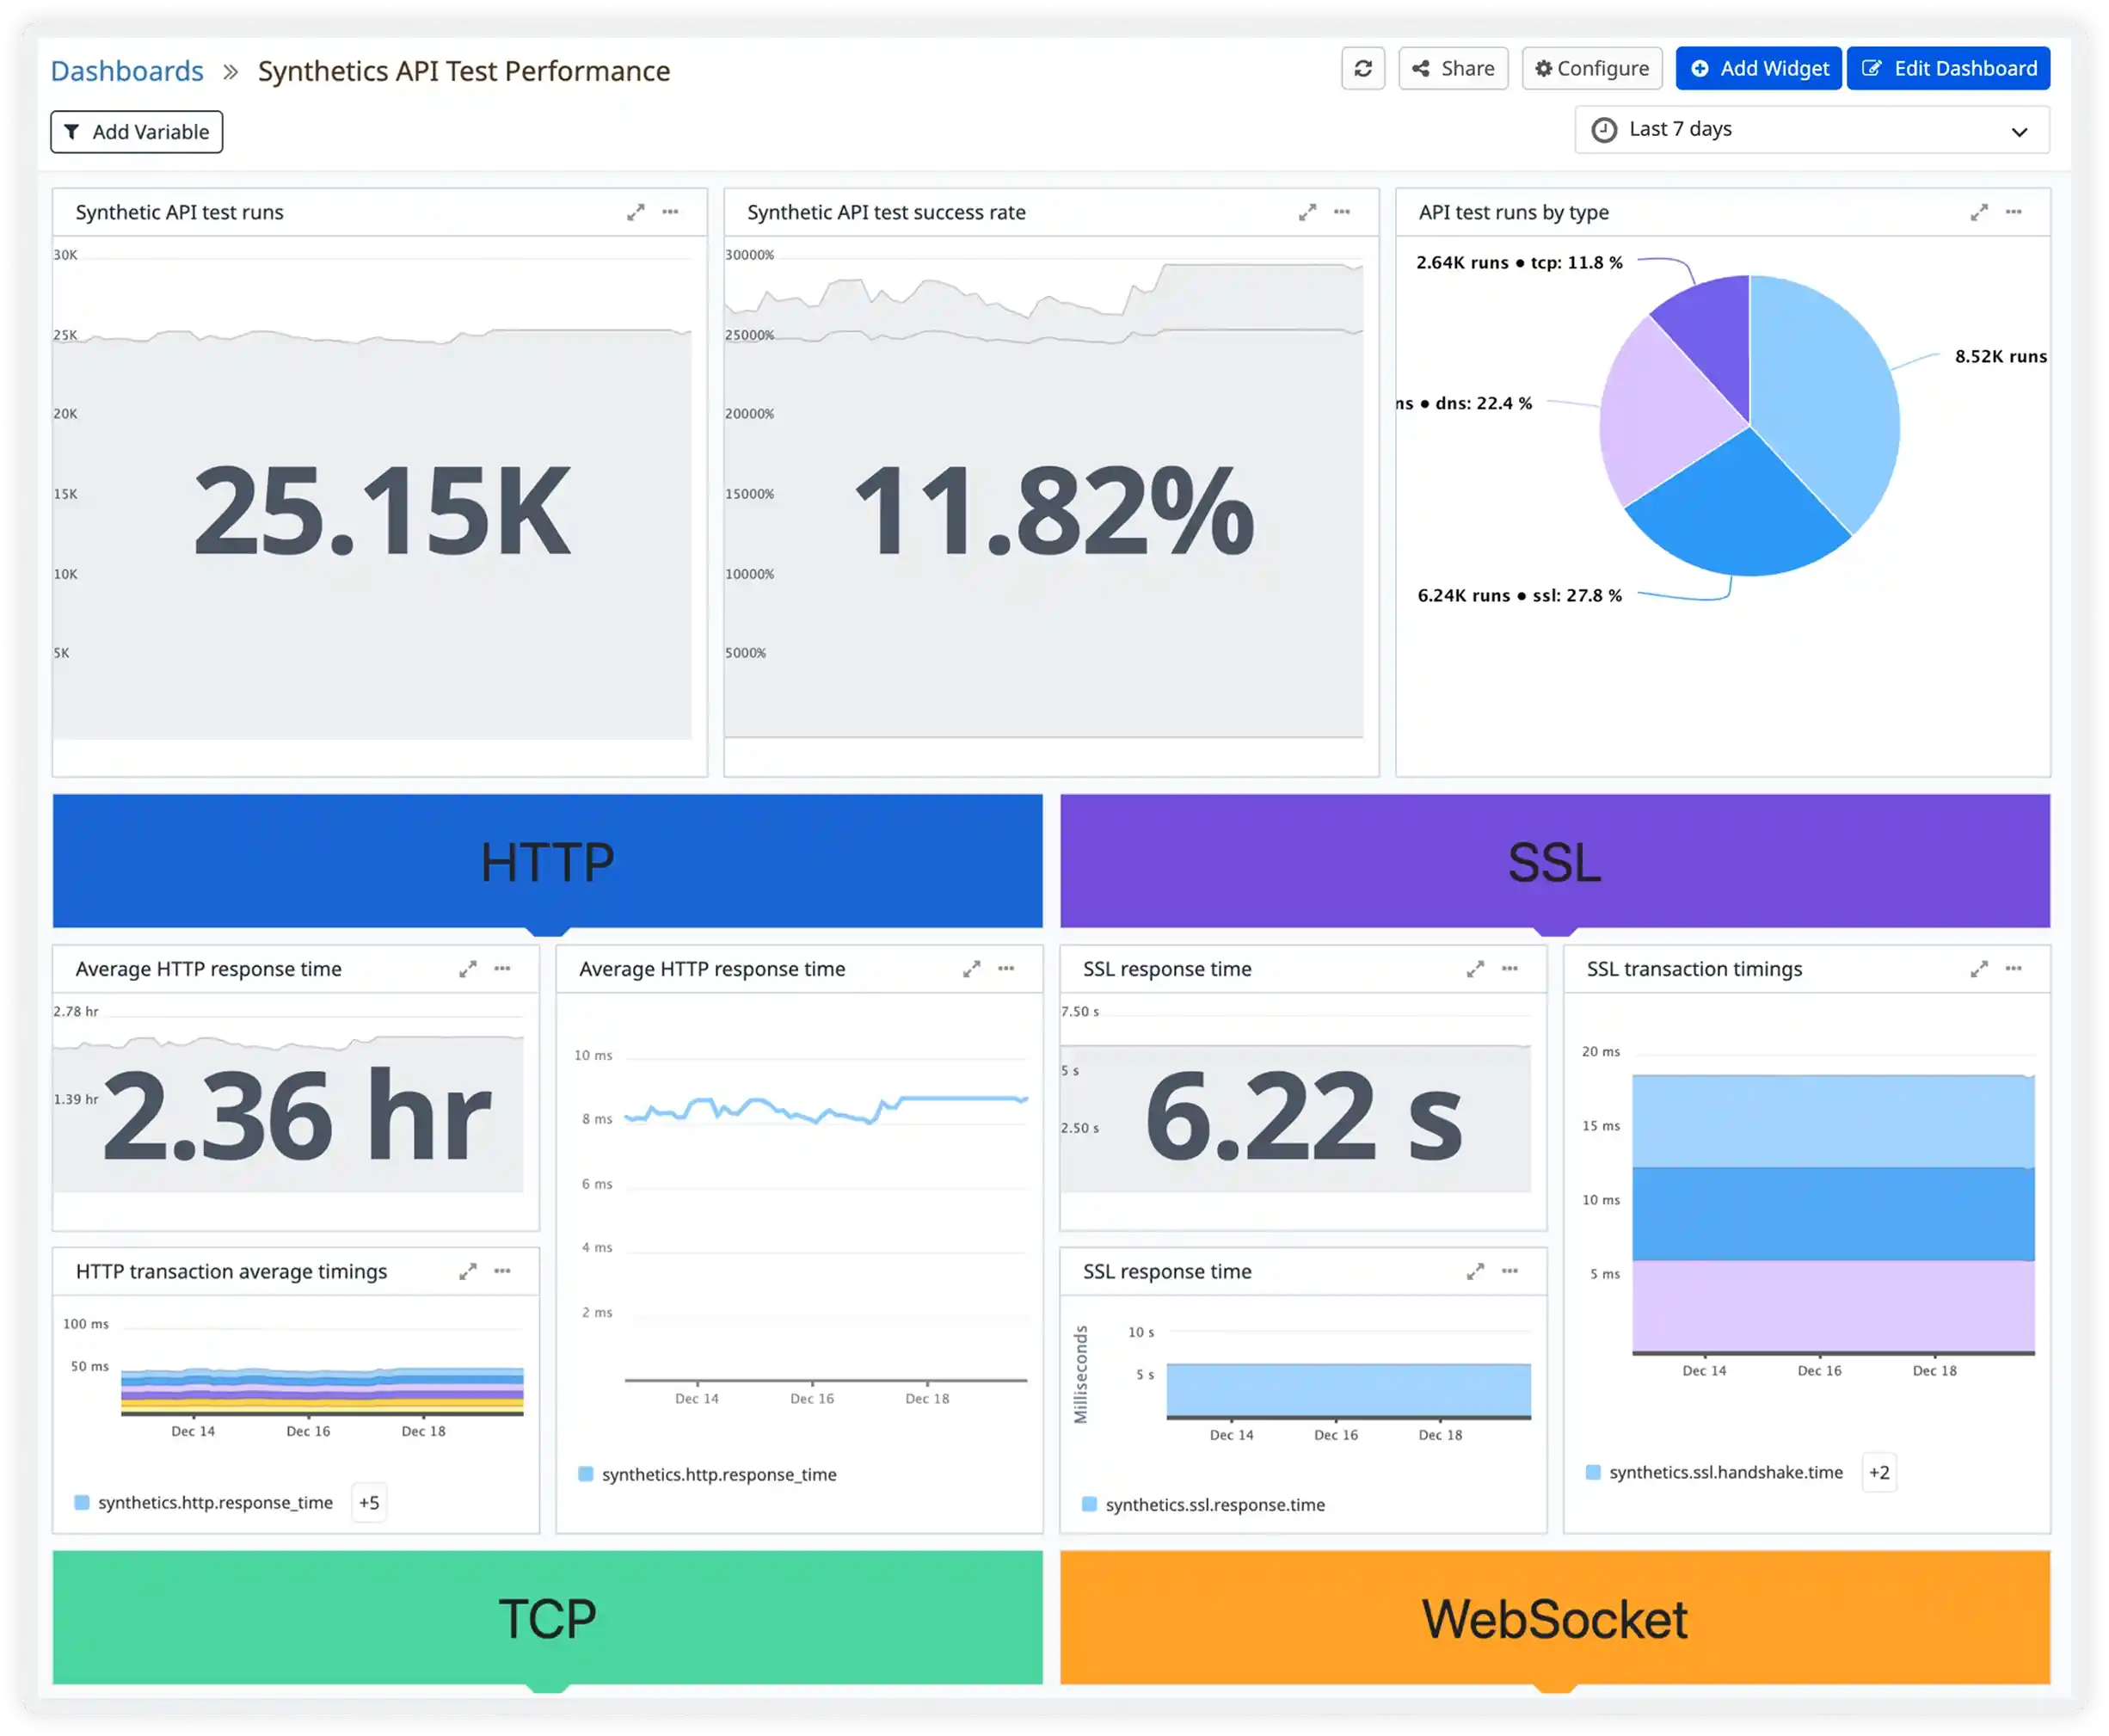
Proactively test performance before users do
Continuously validate application availability and performance using synthetic checks. Track response times, failures, and trends across endpoints to catch issues before real users are impacted.
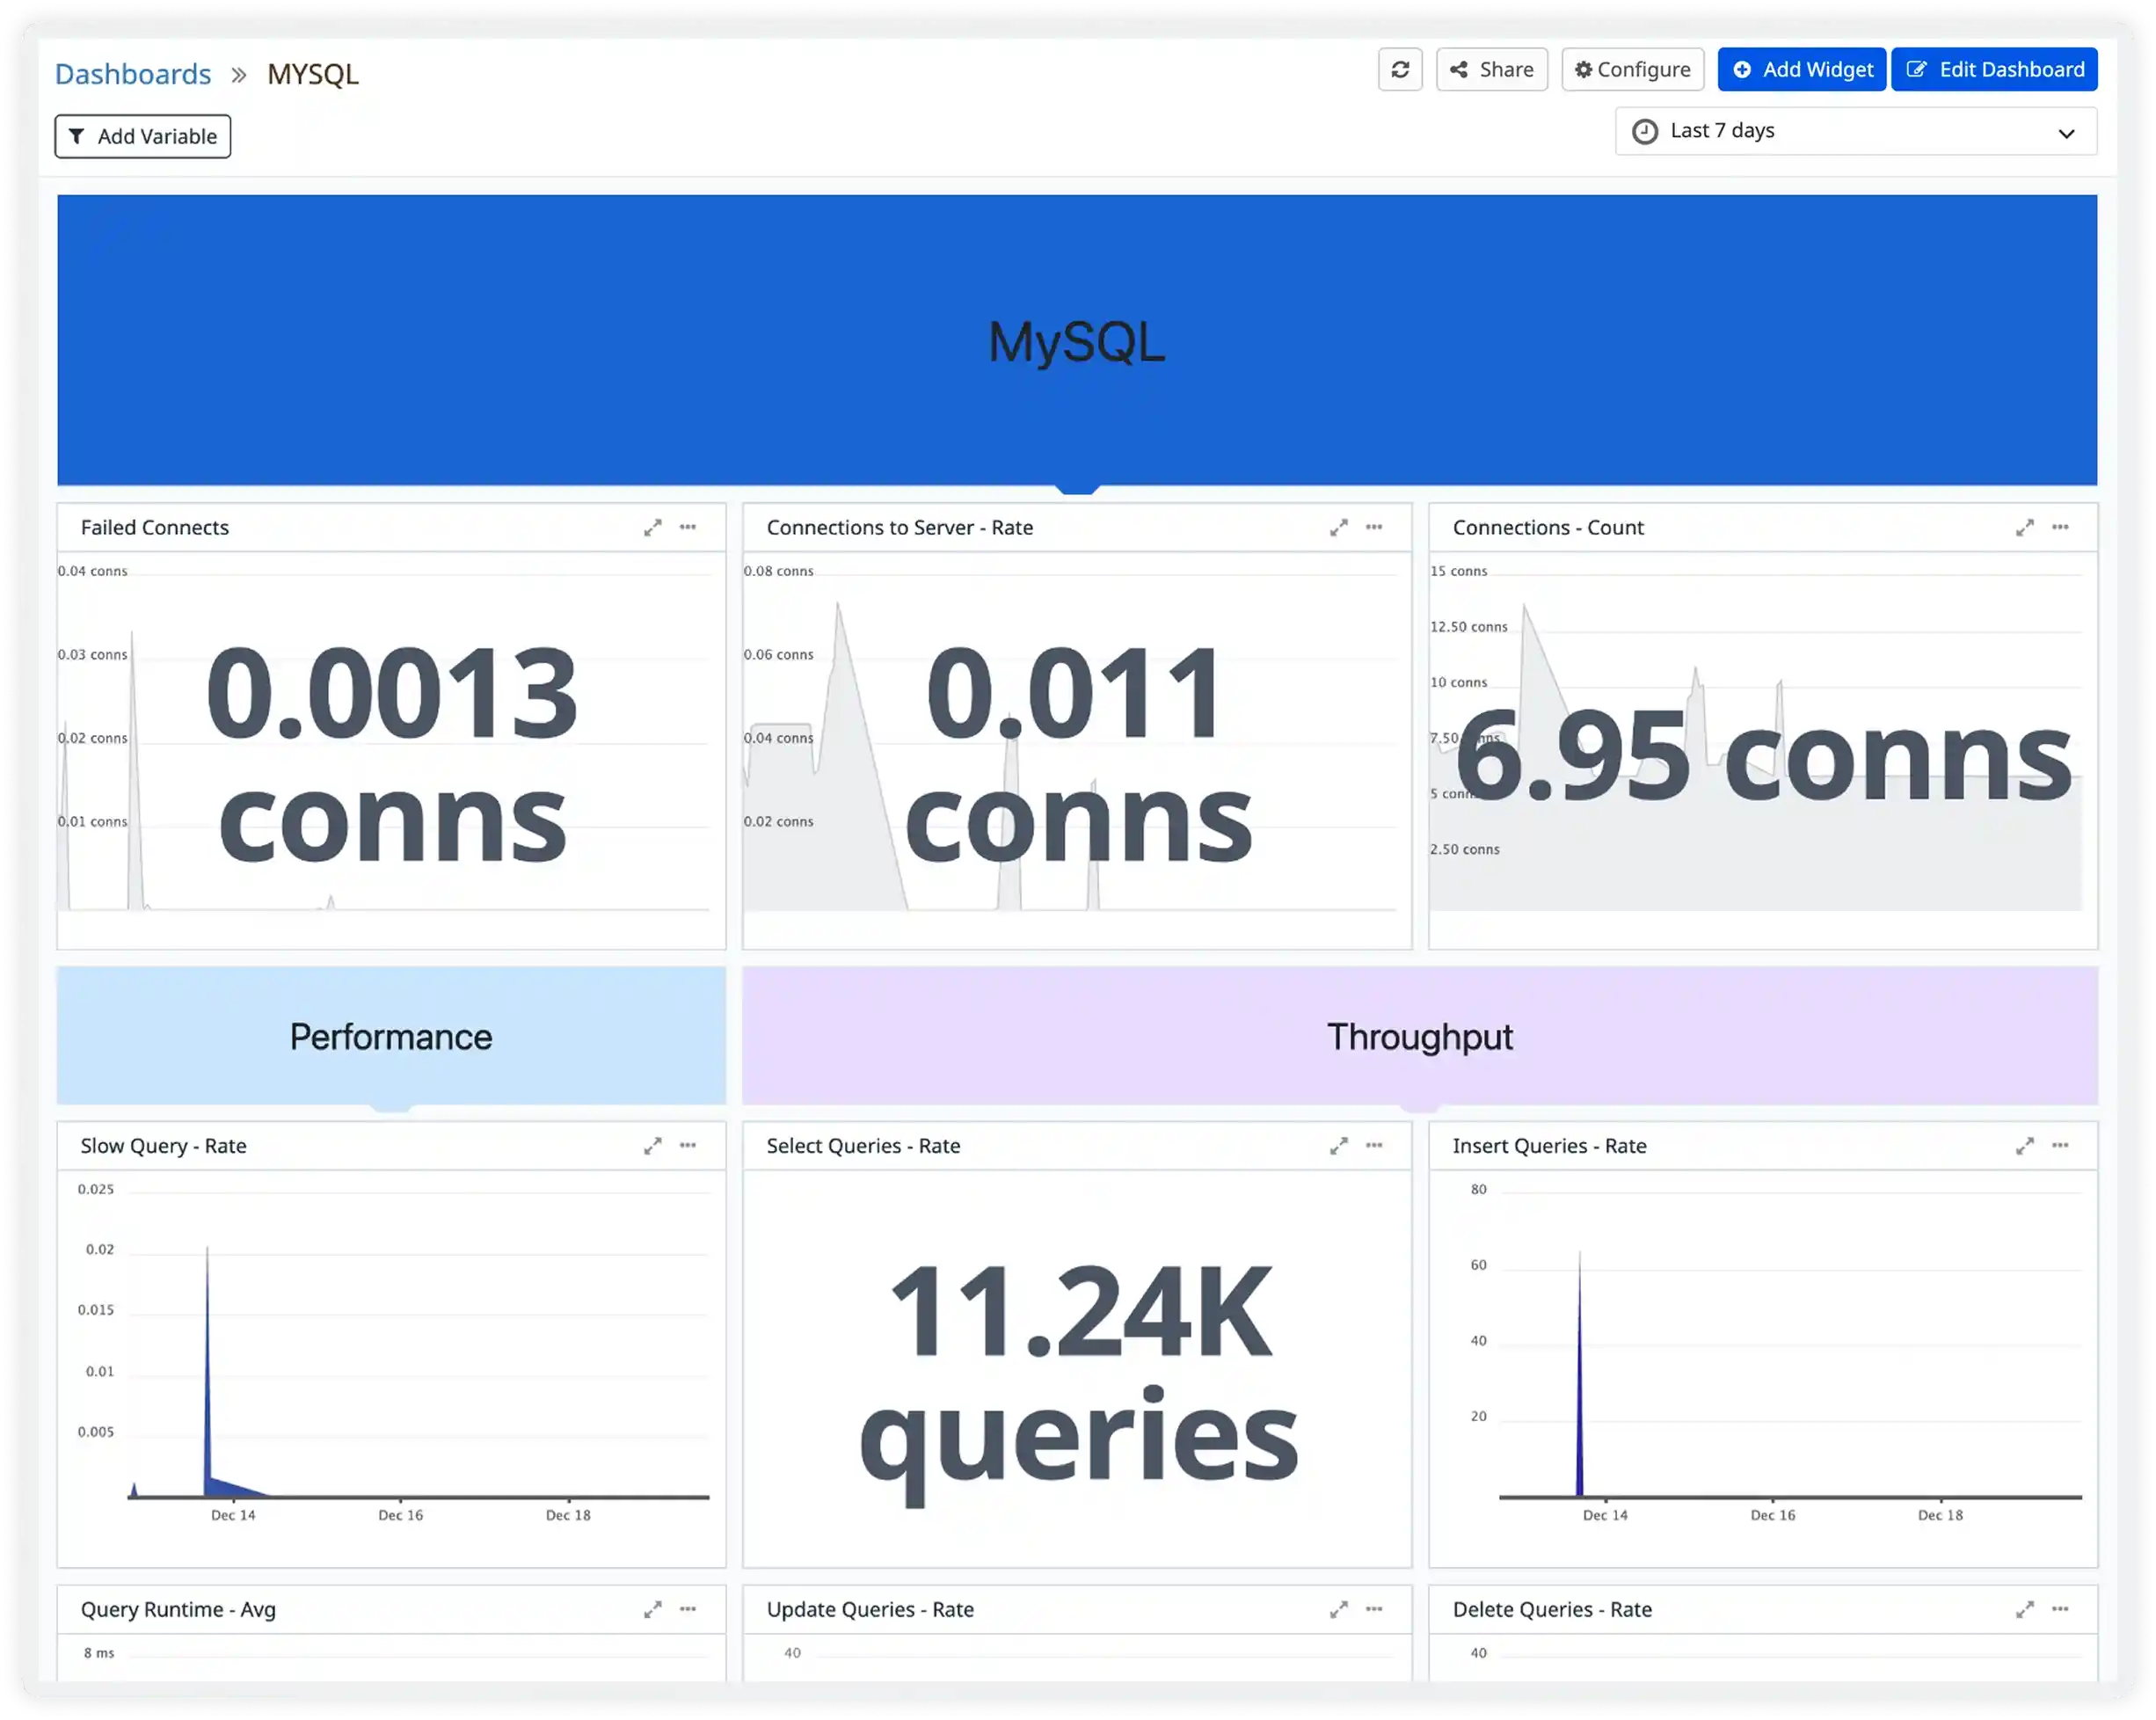
See Exactly What’s Slowing Down Your Database
Analyze MySQL queries, locks, wait events, and execution behavior in one place. Quickly understand performance bottlenecks and optimize database workloads with confidence.
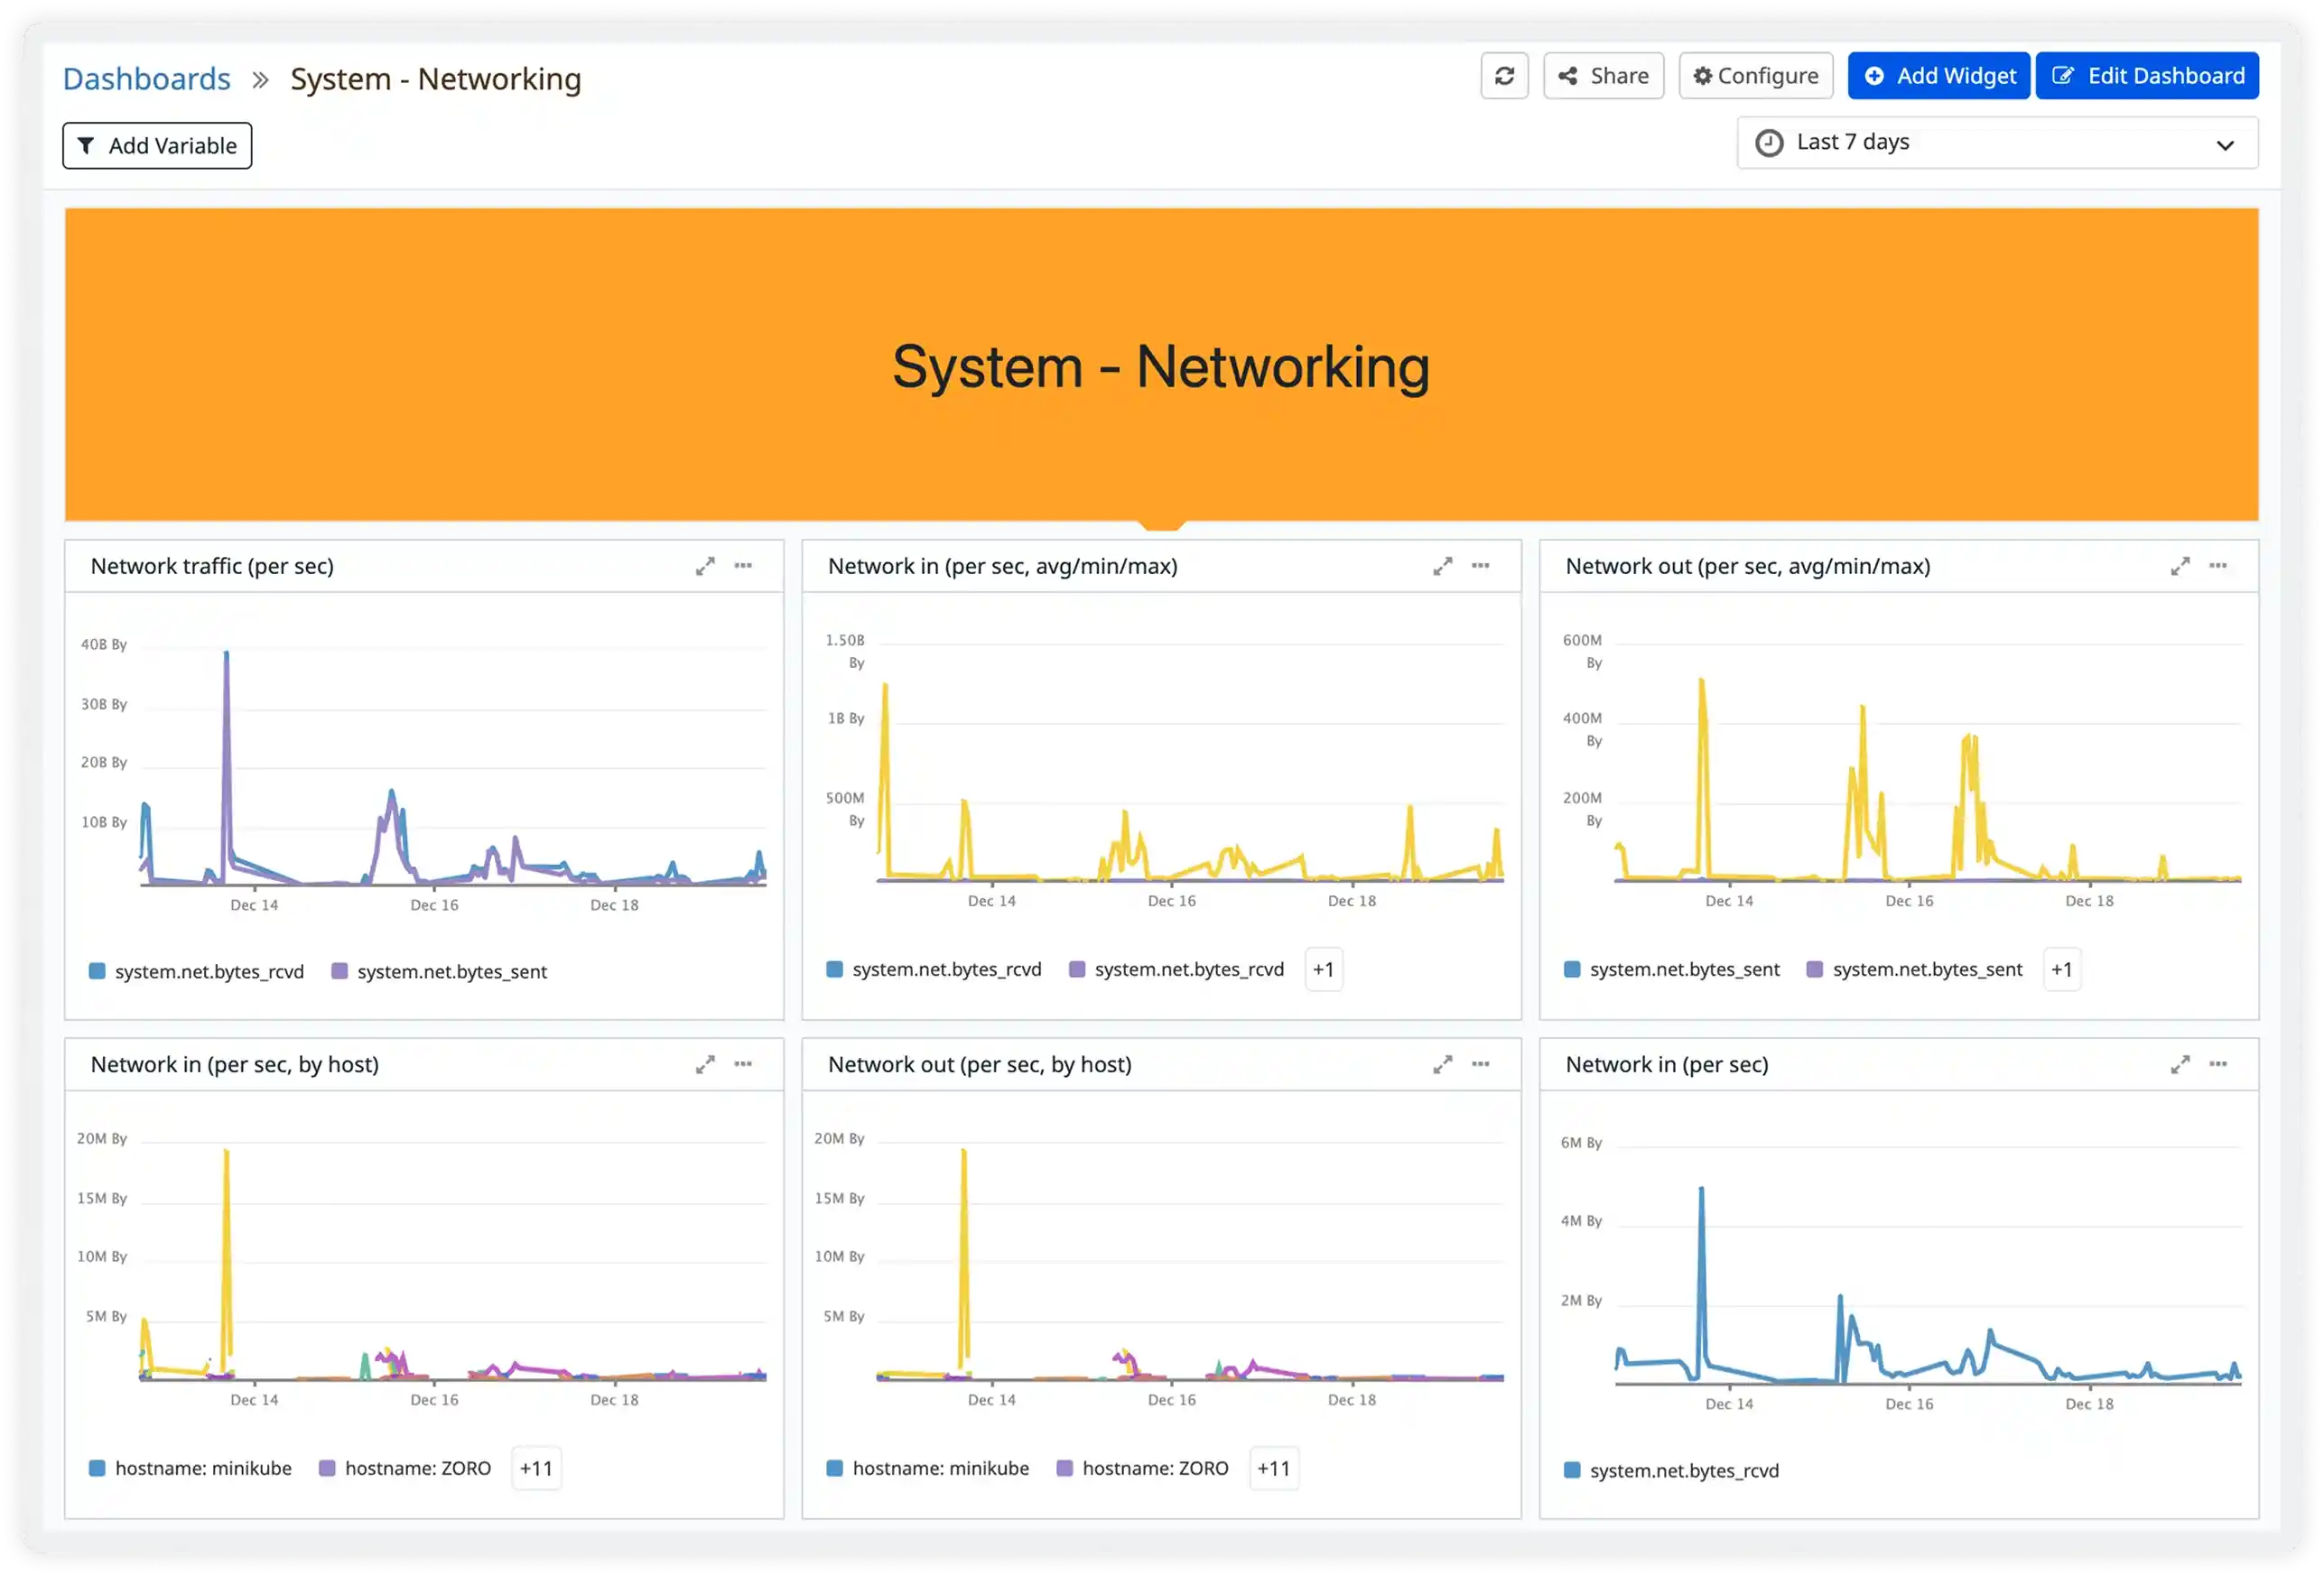
Monitor Network Traffic Across Systems
Visualize network in and out metrics by host to detect anomalies, traffic bursts, and bandwidth saturation before they affect reliability.
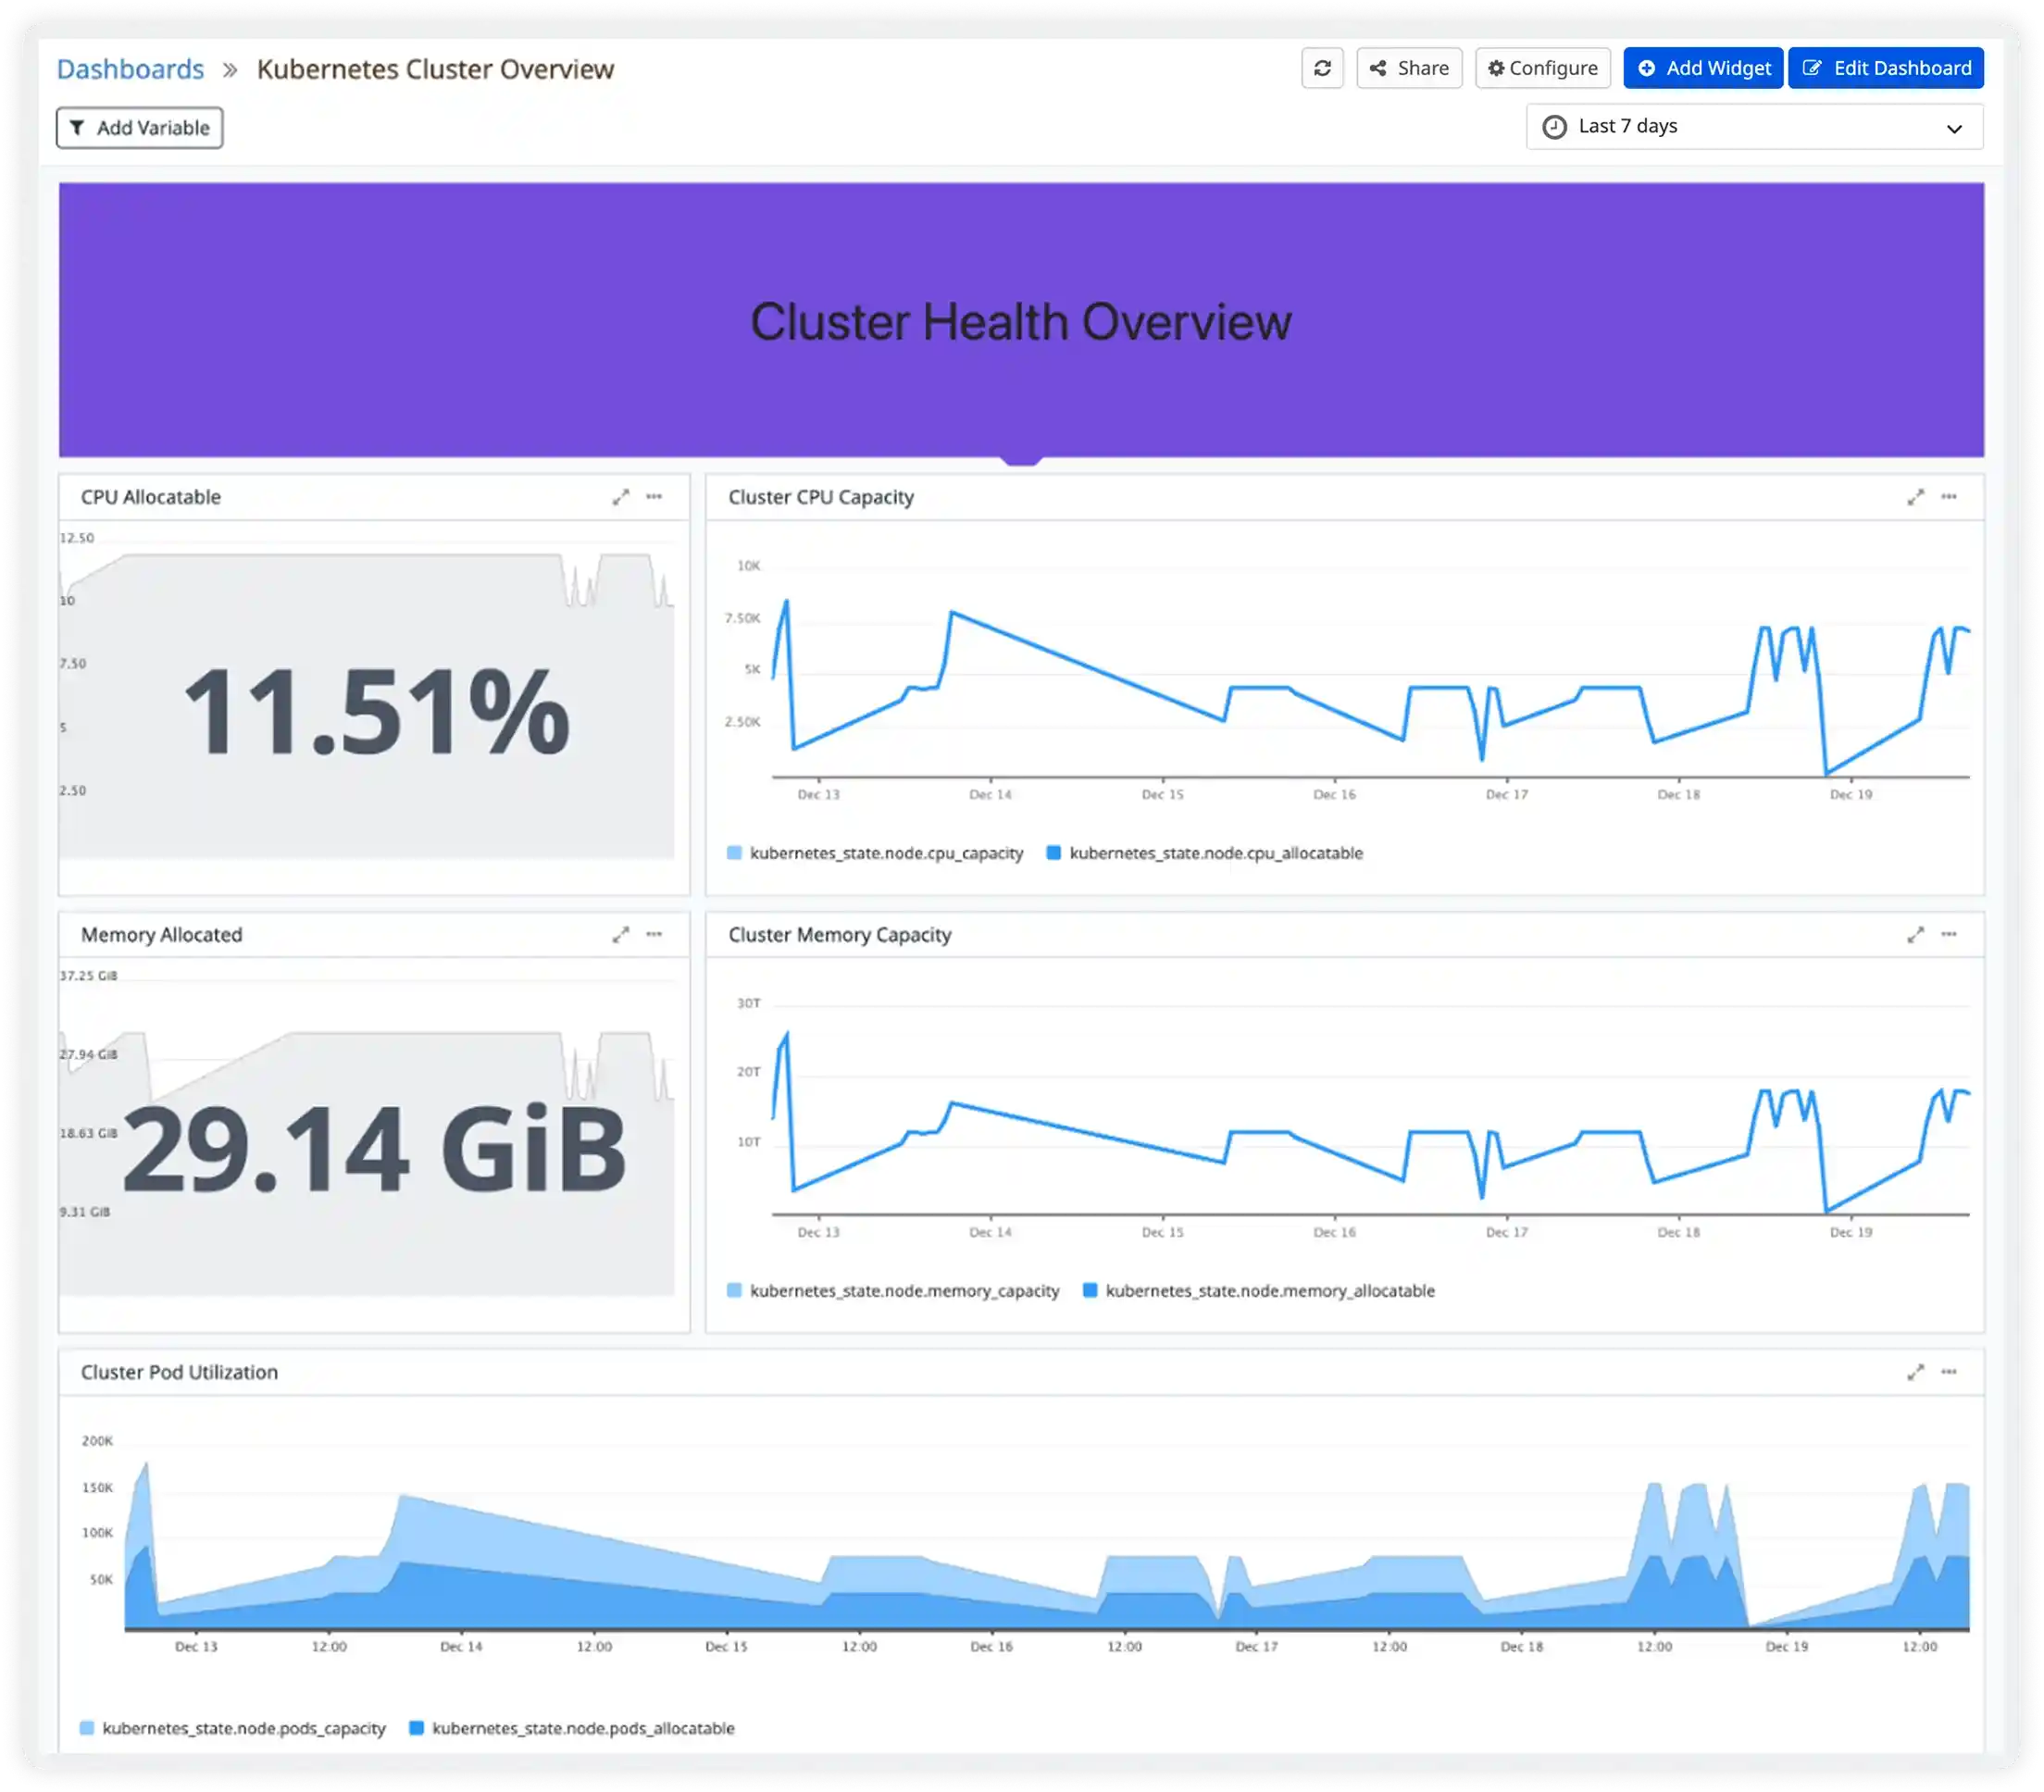
Understand How Your Cluster Really Performs
Monitor node health, pod behavior, and resource usage across namespaces. Identify scheduling issues, resource waste, and performance risks across your Kubernetes environment.
Start Visualizing in Under 5 Minutes
Three simple steps to unified observability dashboards. No credit card required.
Connect Data Sources
Link your applications, infrastructure, and services to Atatus. Auto-discover metrics and start visualizing data instantly.
Build Your Dashboard
Use drag-and-drop to arrange widgets. Add charts, graphs, and metrics that matter to your team. Save multiple views.
Share and Collaborate
Share dashboards with your team. Set permissions, add comments, and make data-backed decisions together in real-time.
Milestones that spark performance excellence
Reflections from clients who've achieved unmatched excellence through innovative strategies.
Read customer stories


