AI-Powered Database Monitoring
Query-level visibility • AI-assisted explain-plan guidance • Predictable database spend
Database Performance Challenges
Without proper database monitoring, teams struggle with these critical performance bottlenecks:
Slow Database Queries
Applications timing out due to slow database queries, but no visibility into which queries are causing the problem.
"As a database administrator, our app is slow and I suspect it's the database, but I can't identify which queries are the bottleneck."
Database Downtime
Database crashes or becomes unresponsive without warning, causing complete application outages and data loss risks.
"As a platform engineer, our database went down at 2 AM on a Saturday, and we lost $100K in revenue before we could restore it."
No Query Optimization Insights
Queries running inefficiently but no recommendations on indexes, query rewrites, or schema optimizations to improve performance.
"As a backend developer, I know my queries are slow, but I don't know if I need indexes, better joins, or query rewrites."
Replication Lag Issues
Read replicas falling behind primary database, causing stale data and inconsistencies in the application.
"As an architect, our read replicas lag behind by minutes, causing users to see outdated data and breaking our eventual consistency model."
Connection Pool Exhaustion
Application unable to get database connections during peak traffic, leading to failed requests and poor user experience.
"As a DevOps engineer, during high traffic, our connection pool maxes out and new requests fail. We need better connection management."
Lack of Database Performance History
No historical database performance data to identify trends, plan capacity, or compare performance before and after schema changes.
"As a database architect, I need to prove that our schema migration improved performance, but we have no baseline metrics from before the change."
Database Monitoring for
Real Workloads
Deep query intelligence with AI-assisted analysis to diagnose issues faster, optimize safely, and control database observability cost at scale.
Find the query. Fix the cause.
Jump from a slow application request to the exact SQL query and its execution plan in seconds. Understand where time is spent and why performance degrades under real production load.
AI-assisted query optimization
Automatically analyze explain plans and query patterns to surface missing indexes and inefficient execution paths. Get practical recommendations that help teams improve performance with confidence.
Operate at scale with predictable cost
Use representative query sampling and configurable retention tiers to focus on high-impact data while keeping observability spend controlled and predictable.
How Atatus Database Monitoring Optimizes Performance
Identify and resolve database bottlenecks with measurable query optimization and cost reduction
Identify Slow Queries Instantly
Automatic slow query detection with query execution plans, query analysis, and performance insights. Optimize queries 10x faster.
Prevent Database Outages
Proactive monitoring of database health, disk space, connections, and replication. Get alerted before issues cause downtime.
Smart Query Optimization
AI-powered recommendations for missing indexes, query rewrites, and schema optimizations. Reduce query time by 90%.
Monitor Replication Health
Real-time replication lag monitoring, replica health checks, and automated failover recommendations. Ensure data consistency.
Connection Pool Optimization
Track connection pool usage, idle connections, wait times, and connection errors. Right-size pools for optimal performance.
Database Cost Optimization
Identify over-provisioned databases, recommend right-sizing, and optimize storage. Reduce database costs without impacting performance.
Complete Database
Performance Visibility
From slow queries to resource bottlenecks - everything you need to optimize database performance
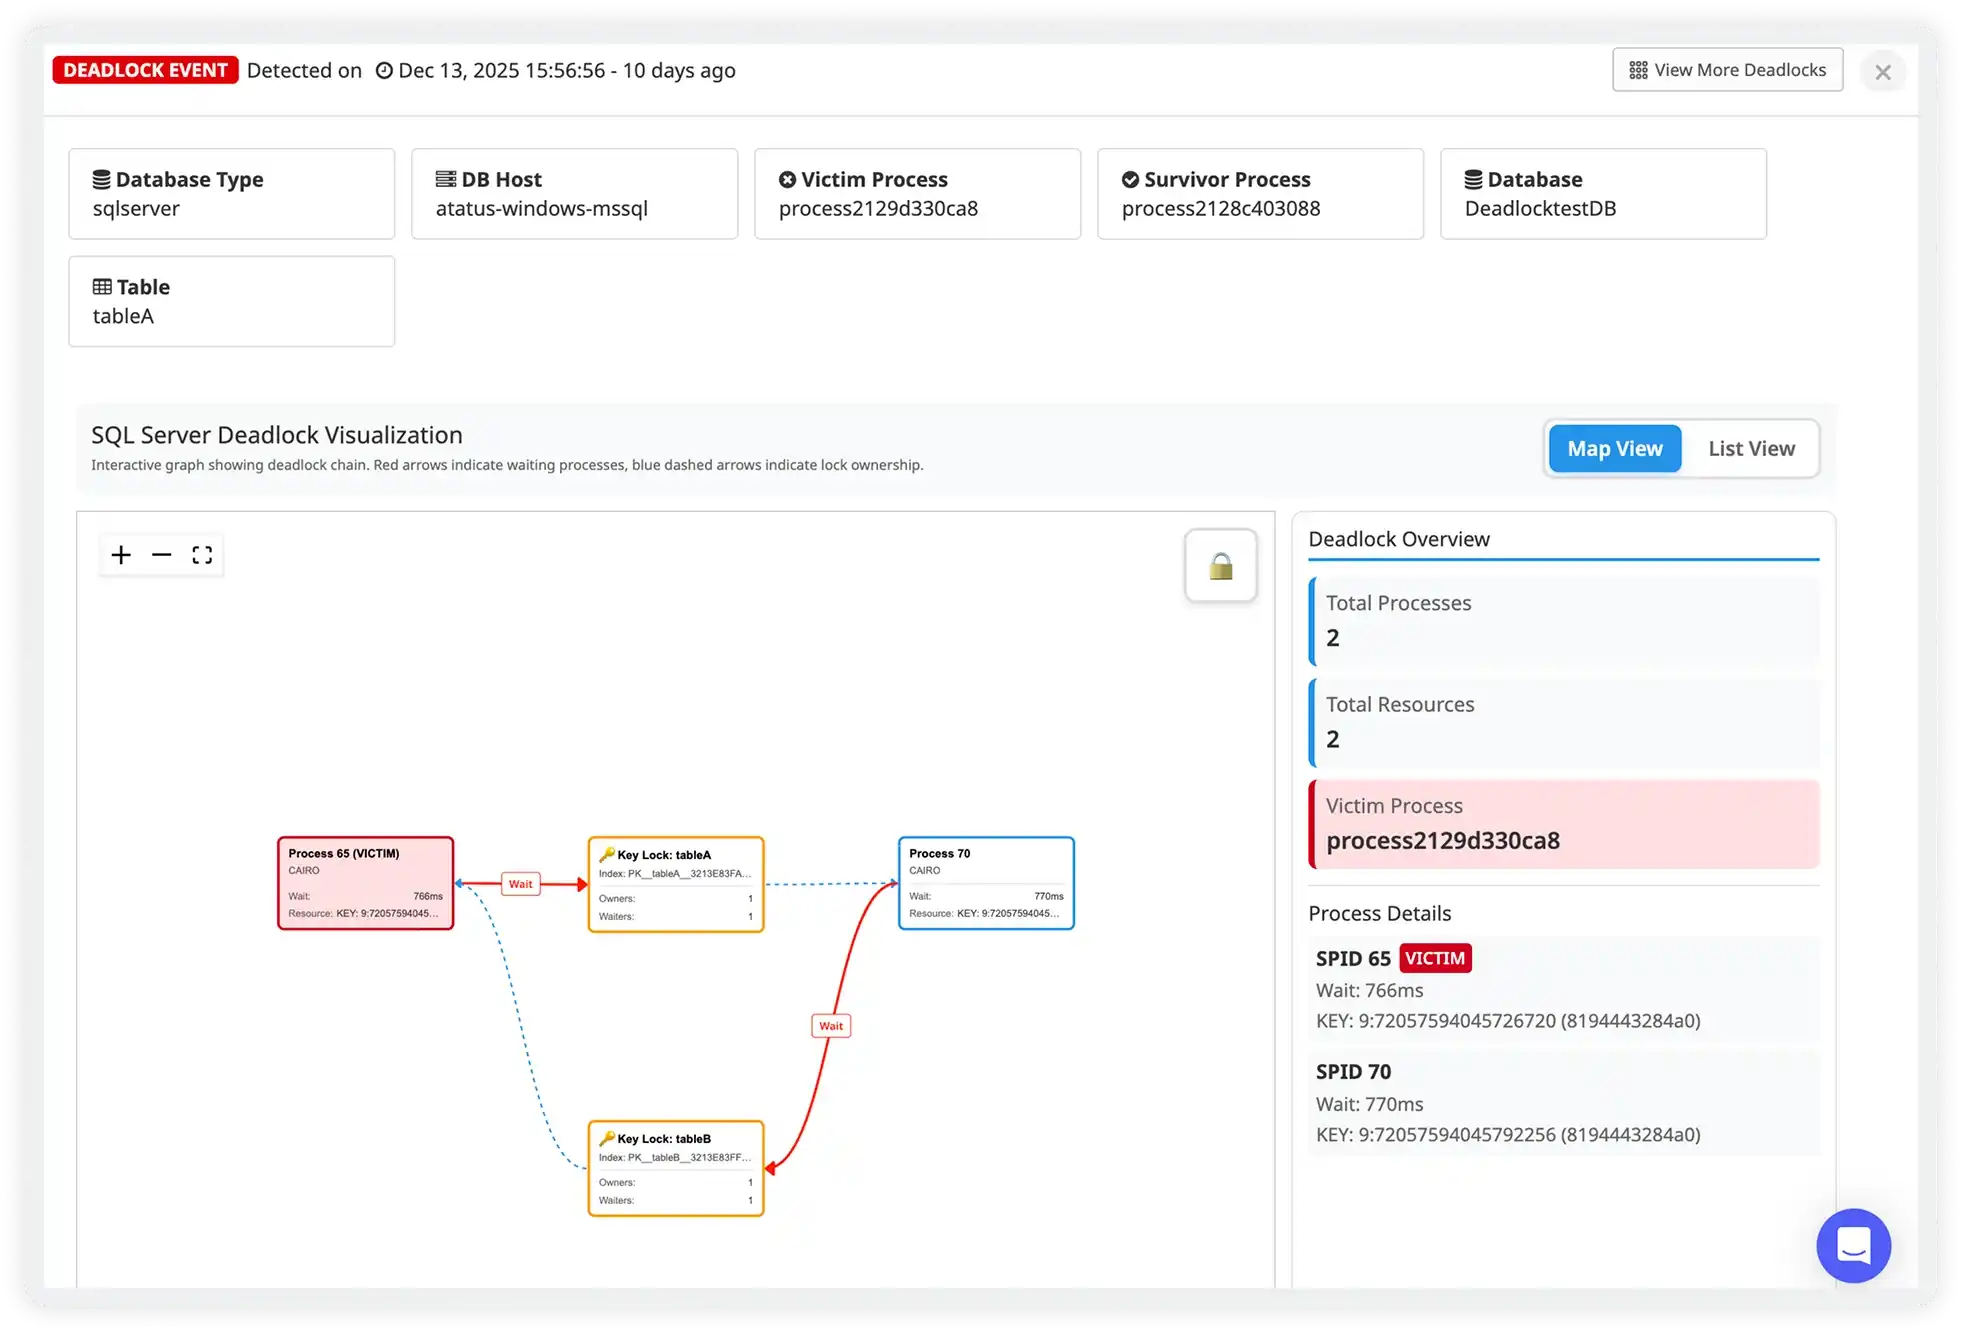
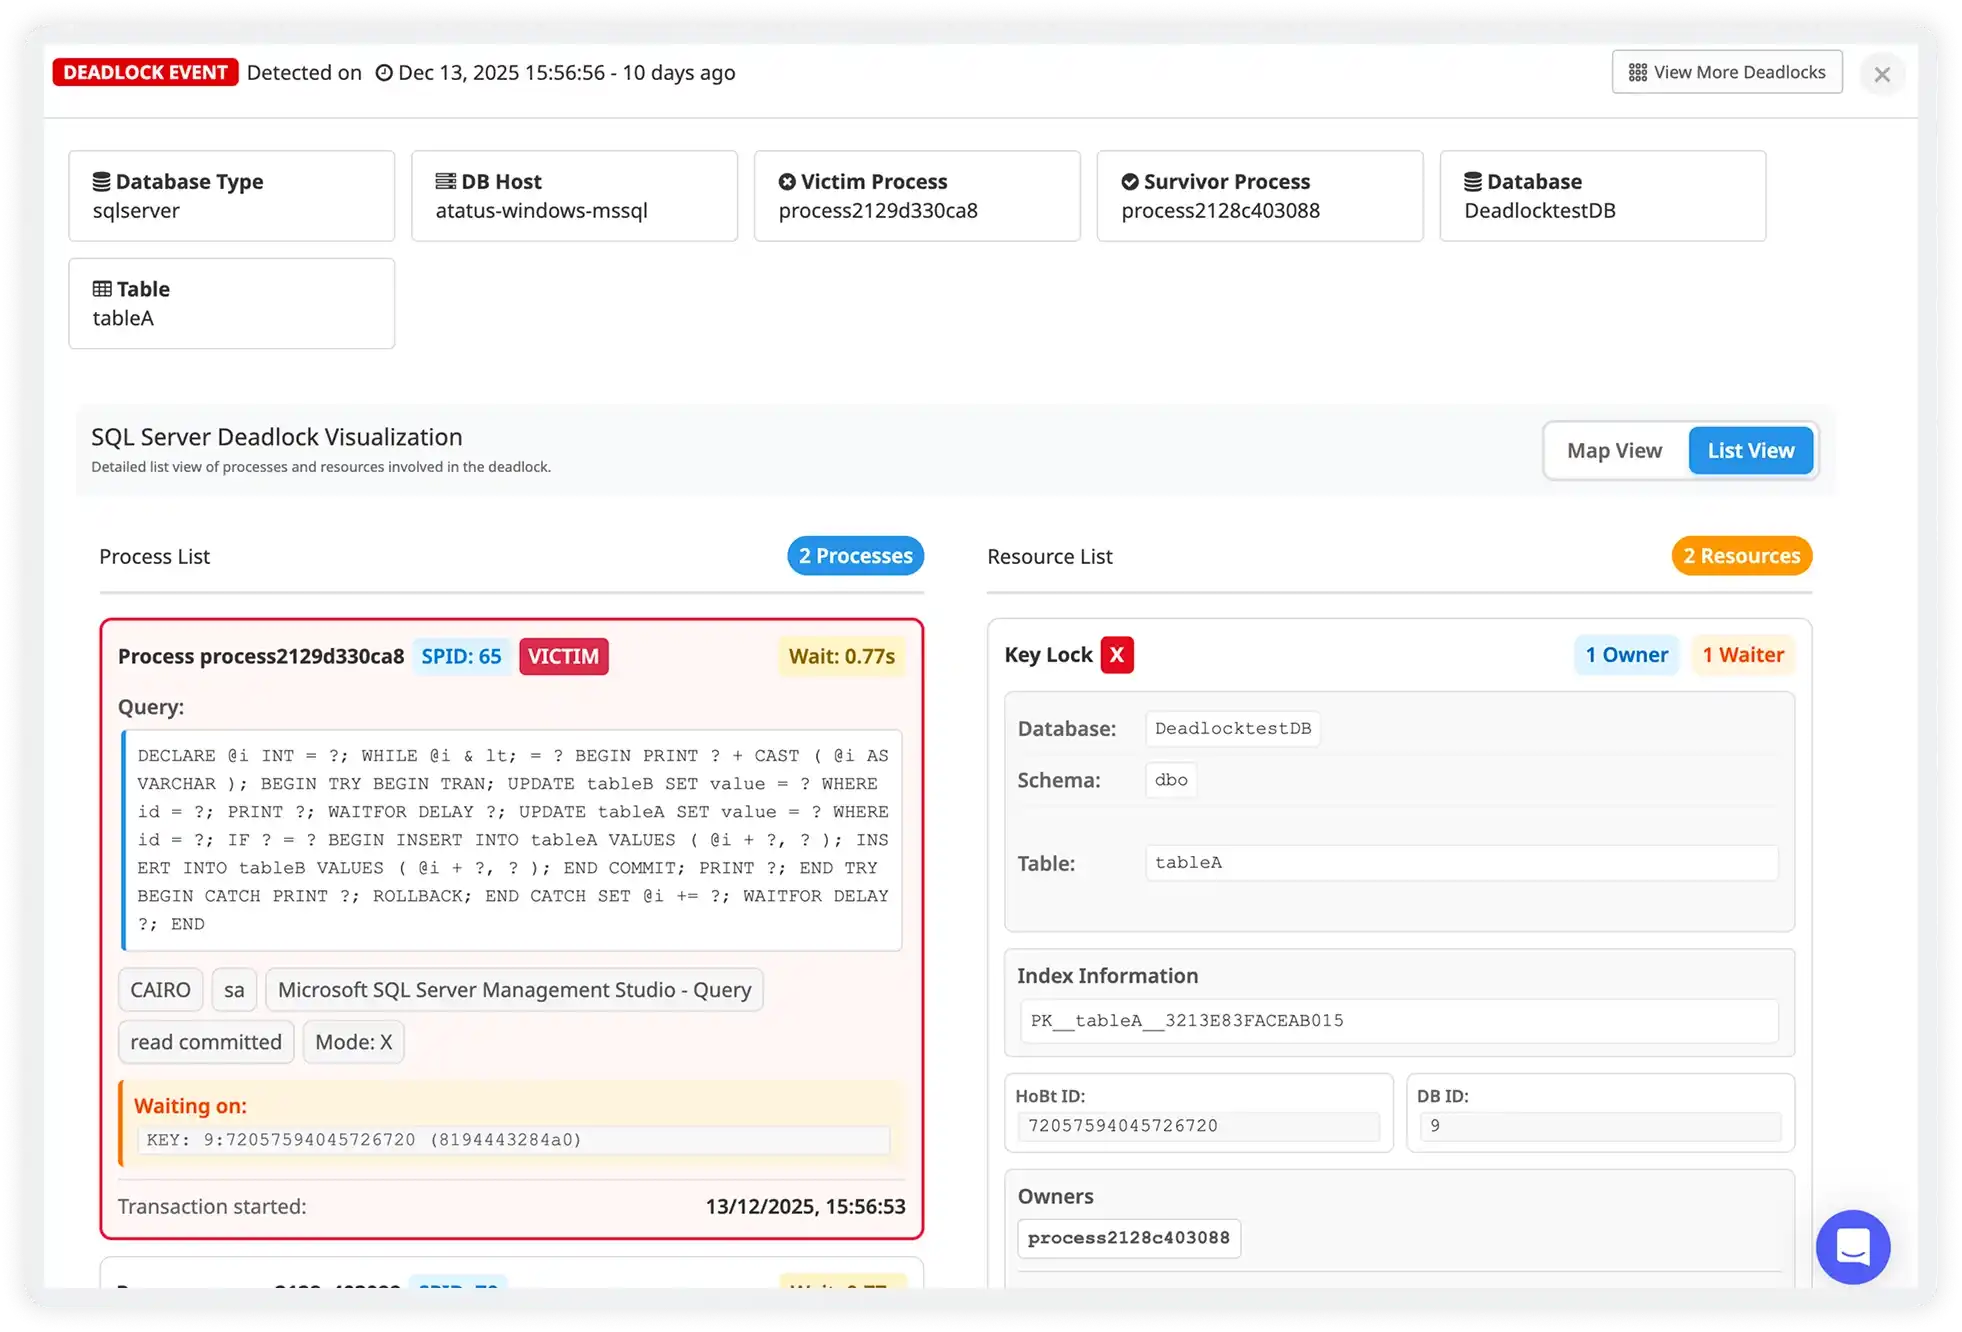
Reduce Production Impact from Database Deadlocks
Automatically capture database deadlock events with detailed context, including affected databases, hosts, tables, and involved processes. Quickly understand where contention occurs and identify the statements responsible for blocking and rollback events.
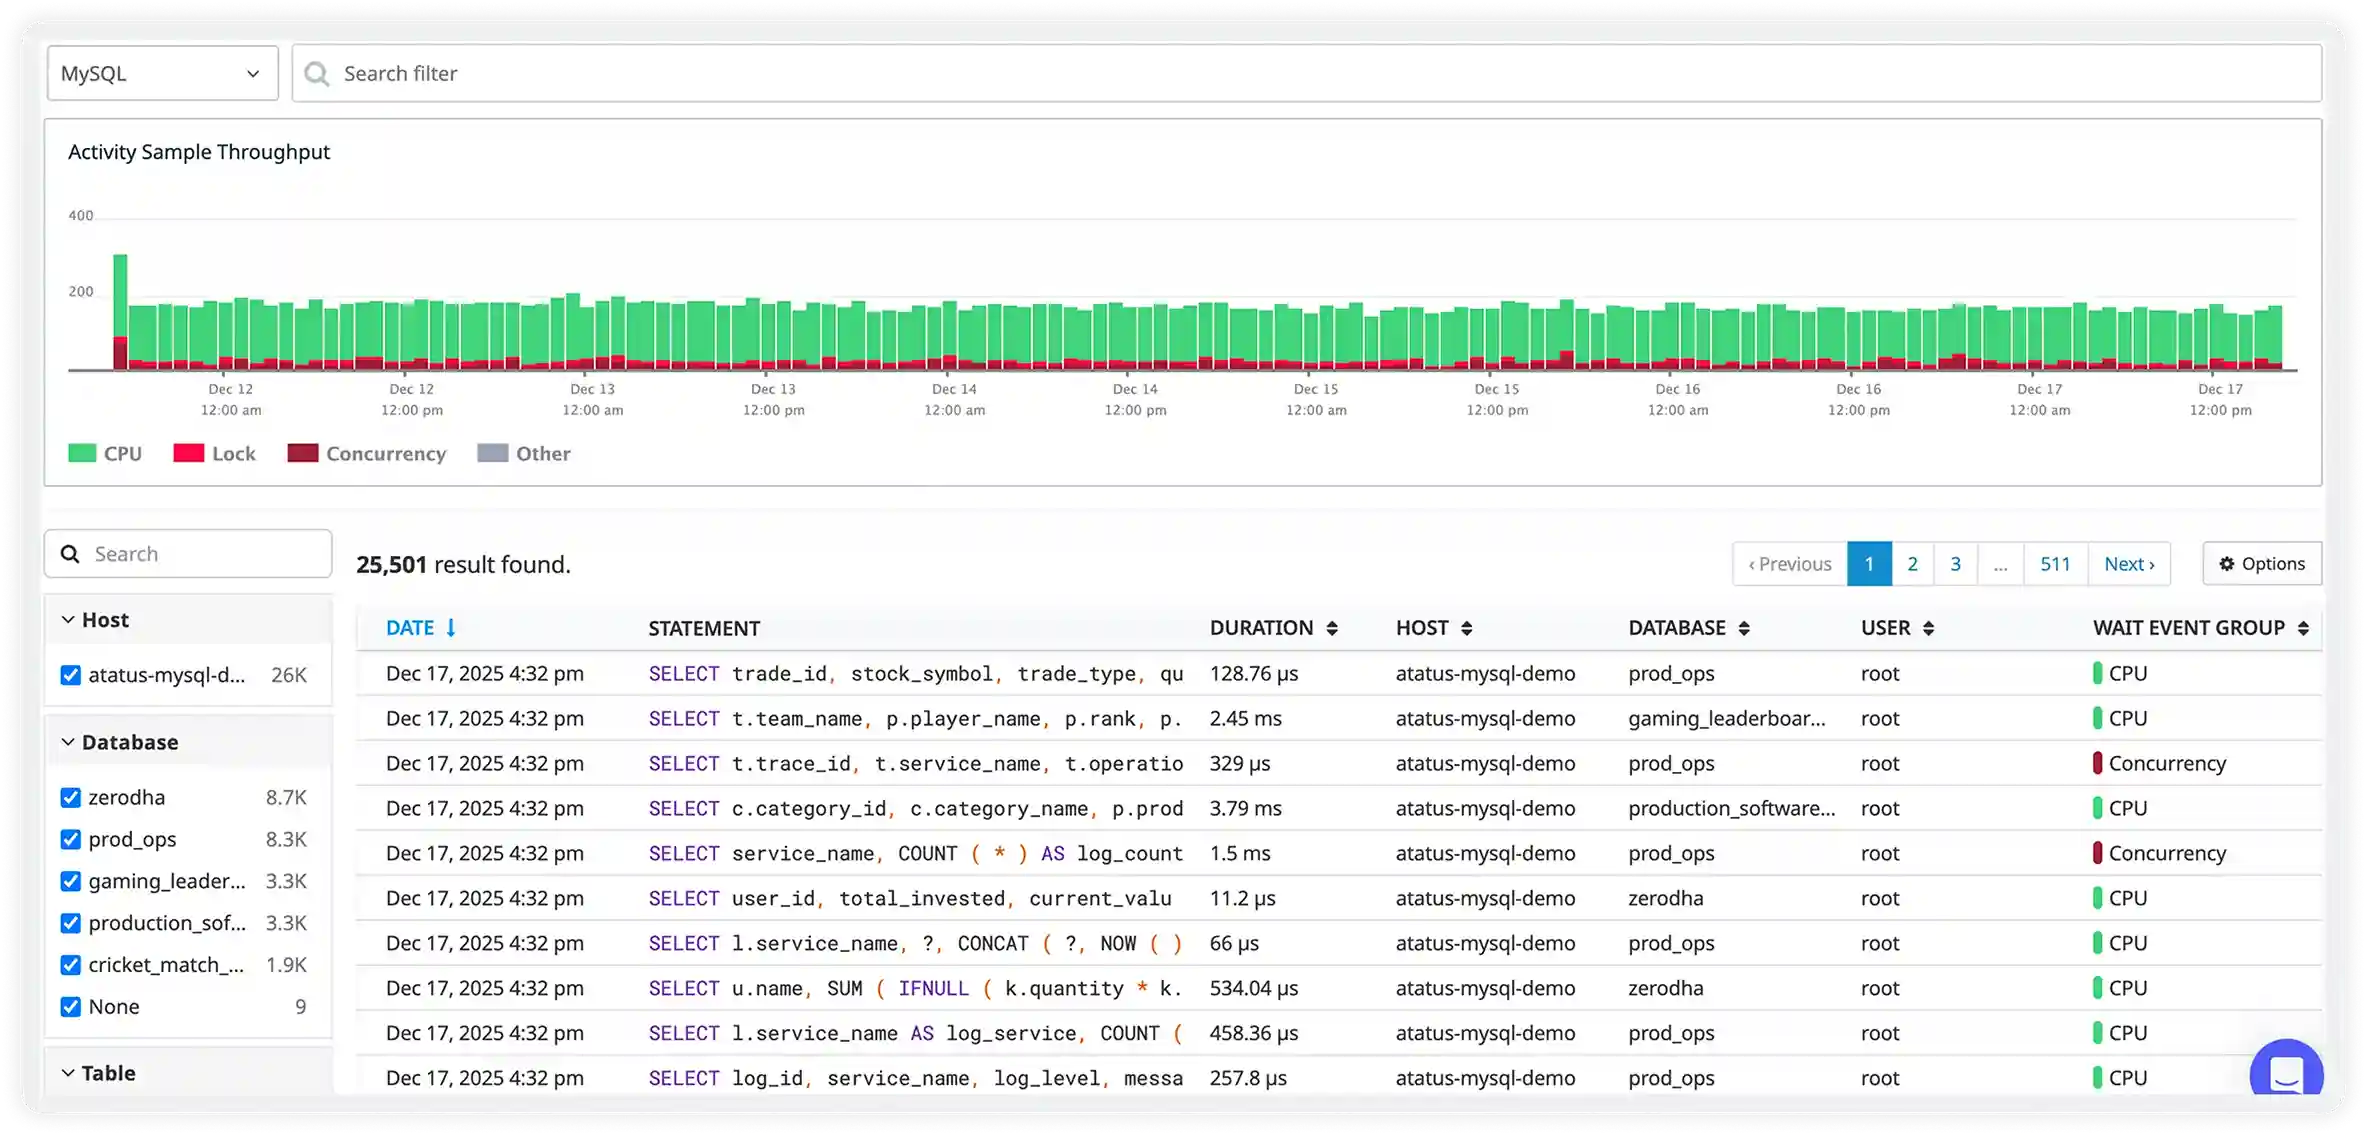
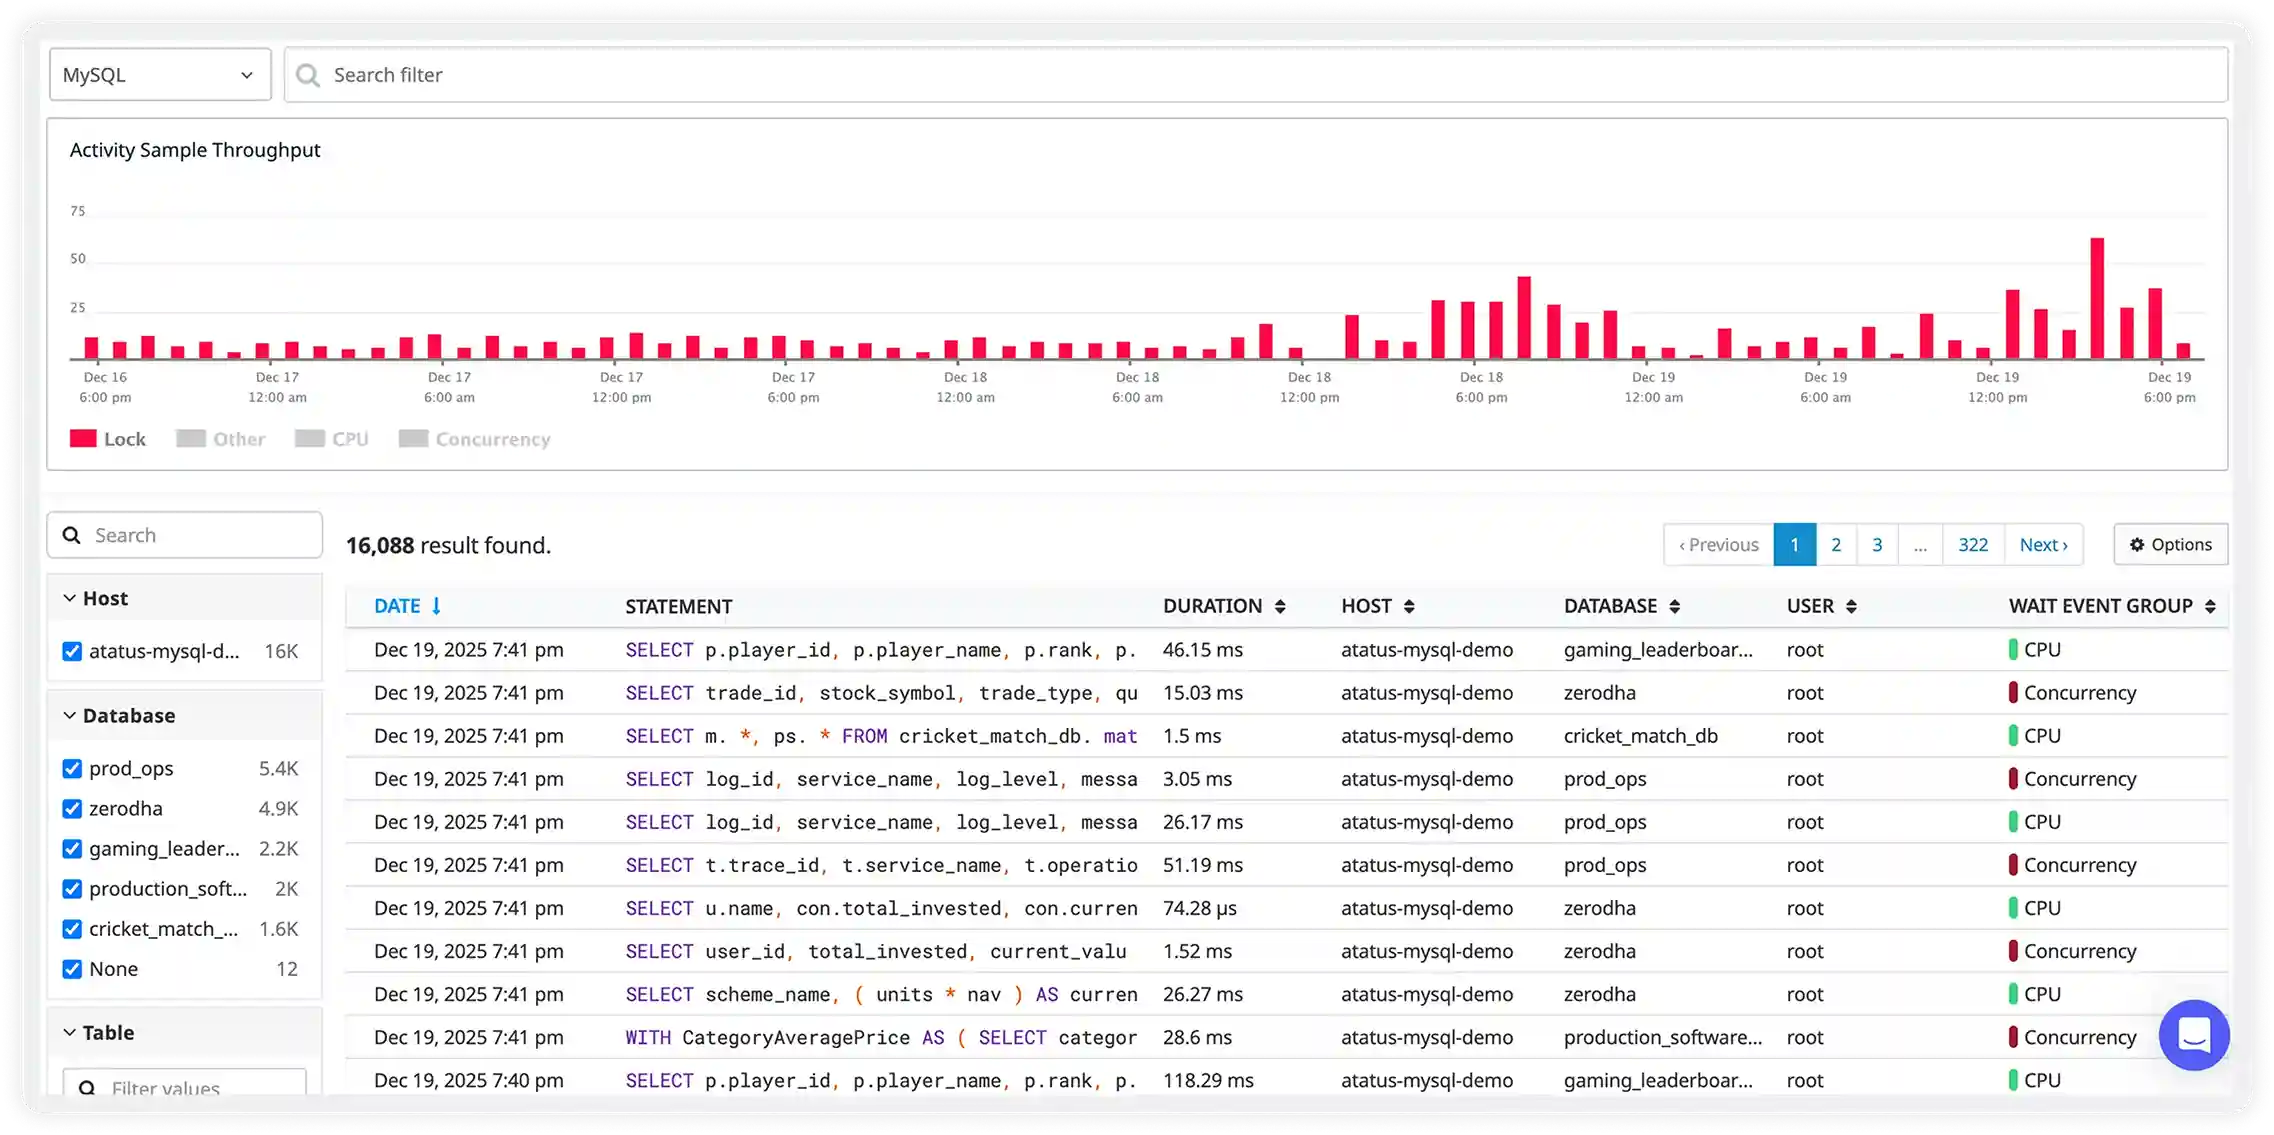
Understand Performance Through Query Samples
Inspect representative query samples enriched with execution time, database, host, user, and wait-event context. Focus analysis on the queries that drive latency and cost, without sifting through unnecessary data.
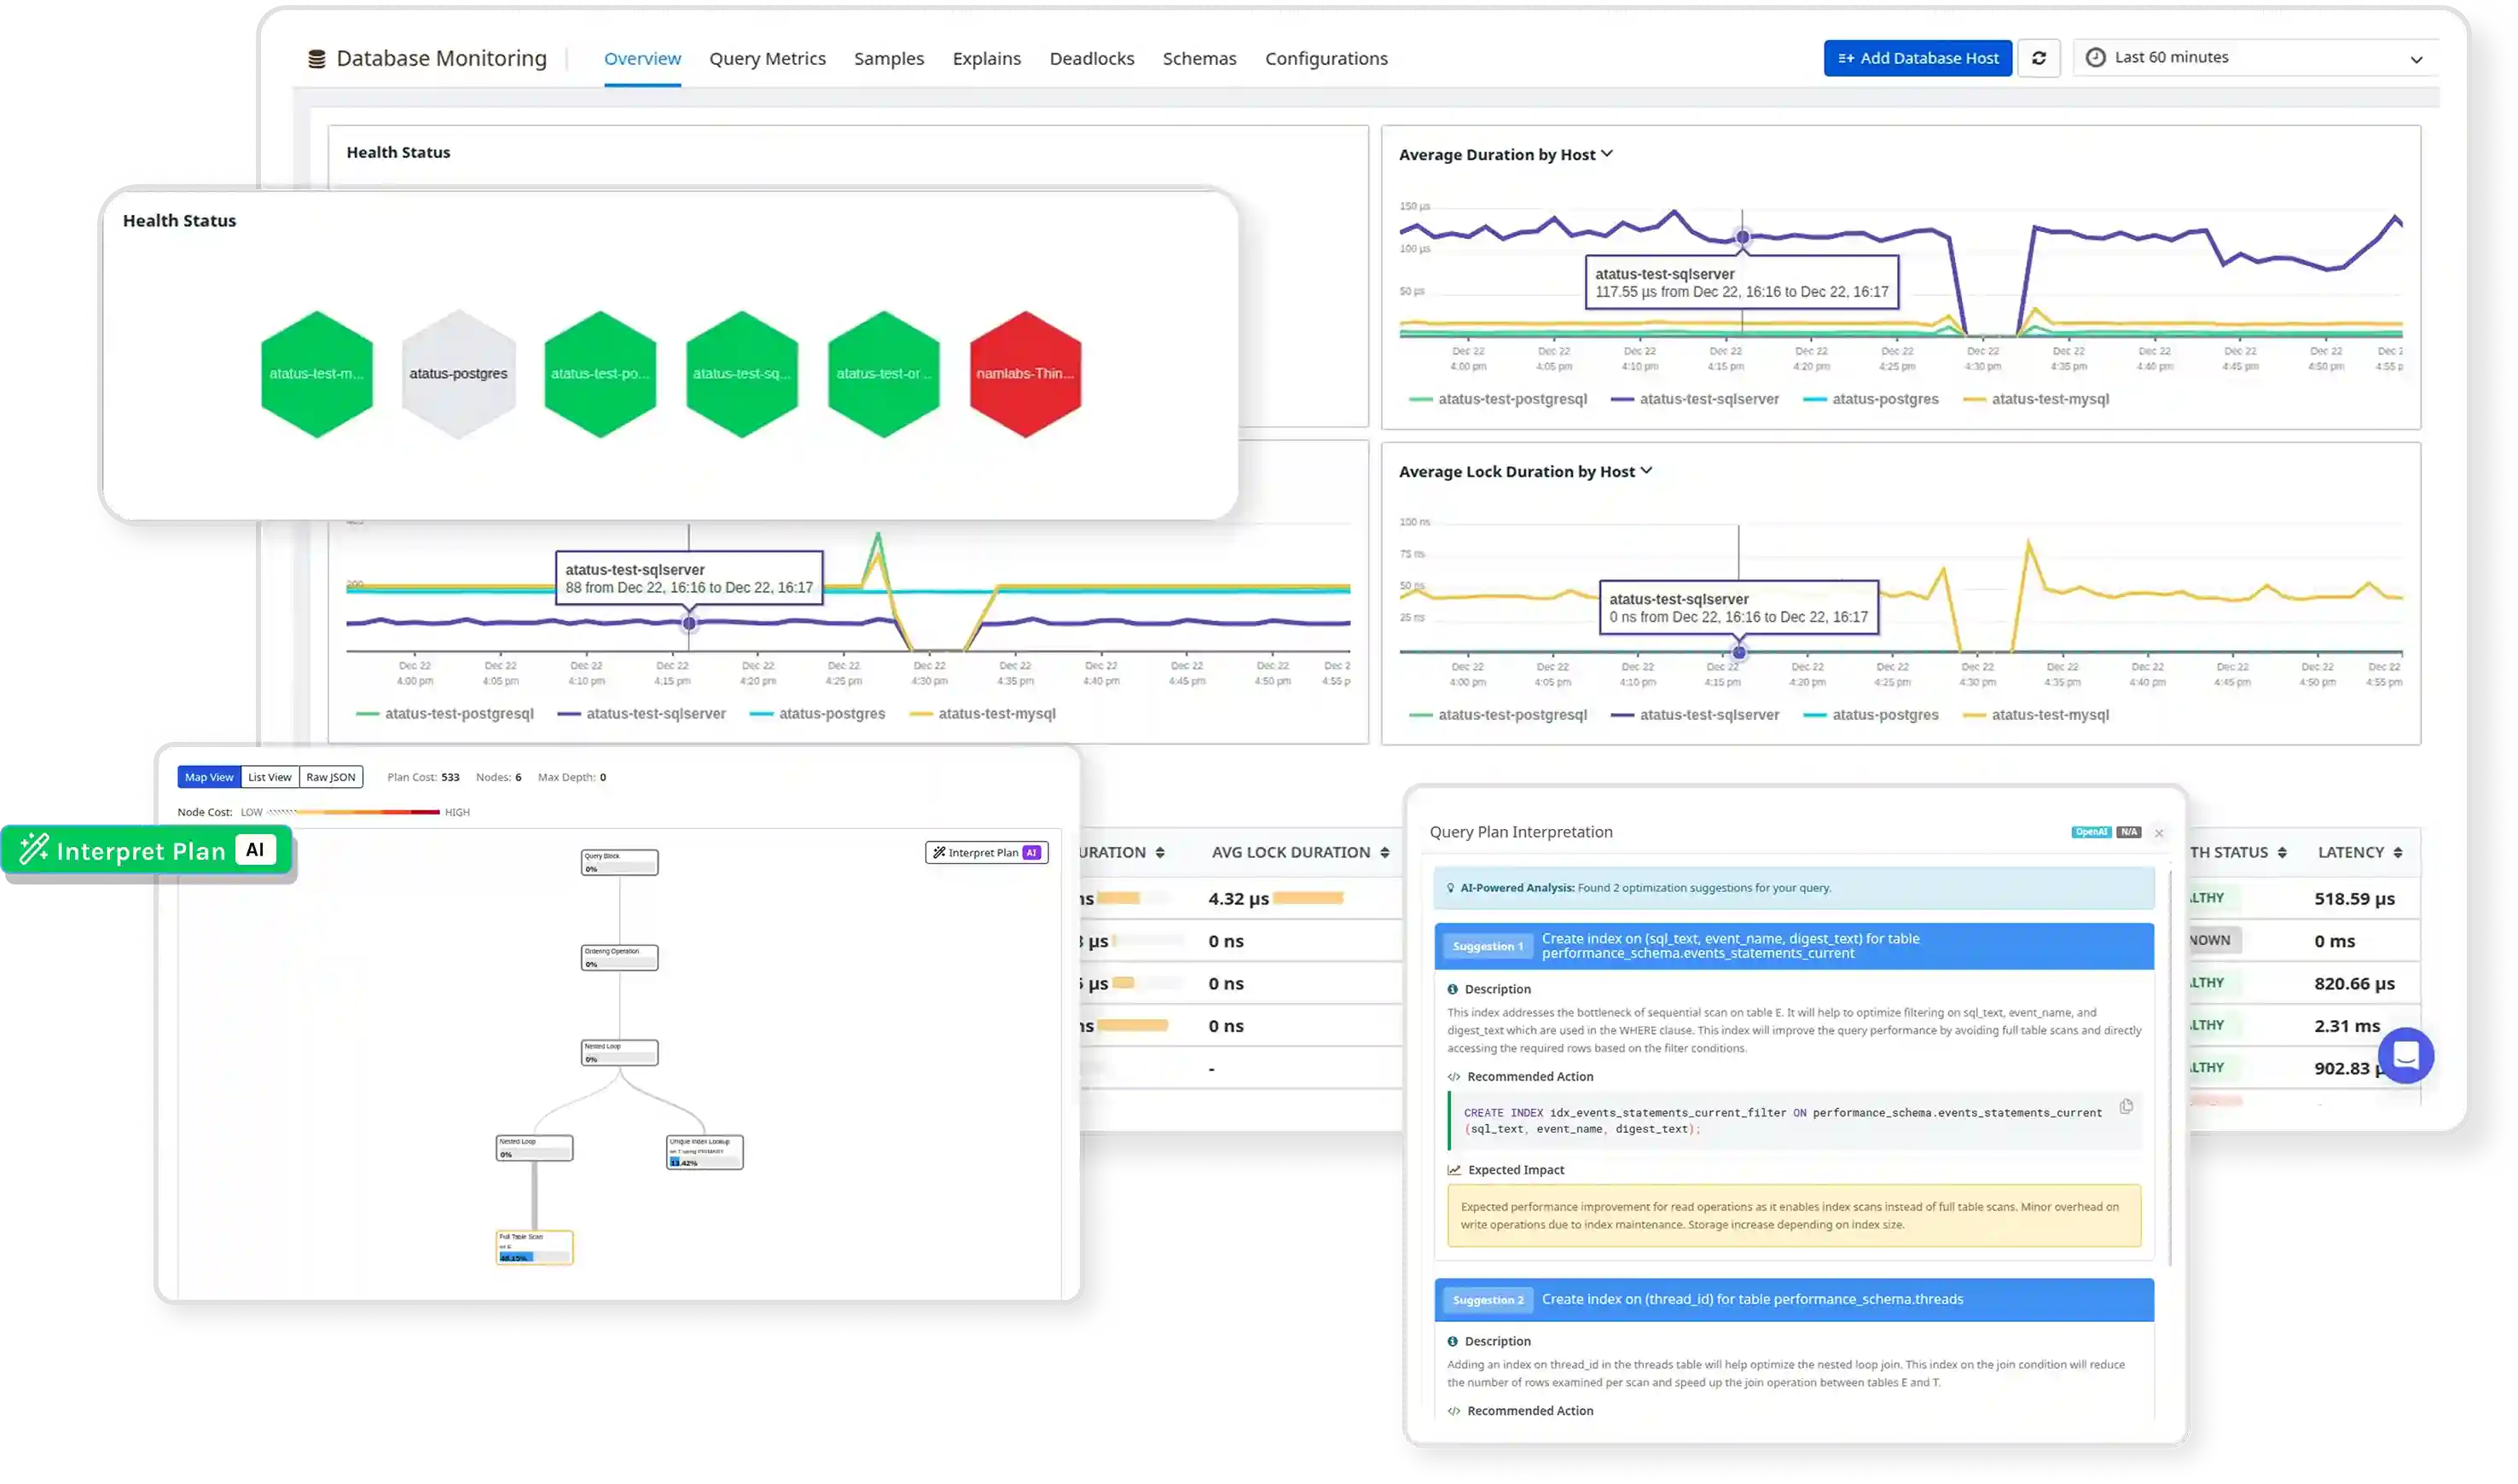
Optimize Query Execution with AI Explain Plans
Analyze query execution plans with AI-assisted interpretation to surface costly joins, scans, and execution paths. Identify inefficient operations early and understand how query behavior impacts primary and replica workloads before performance degrades in production.
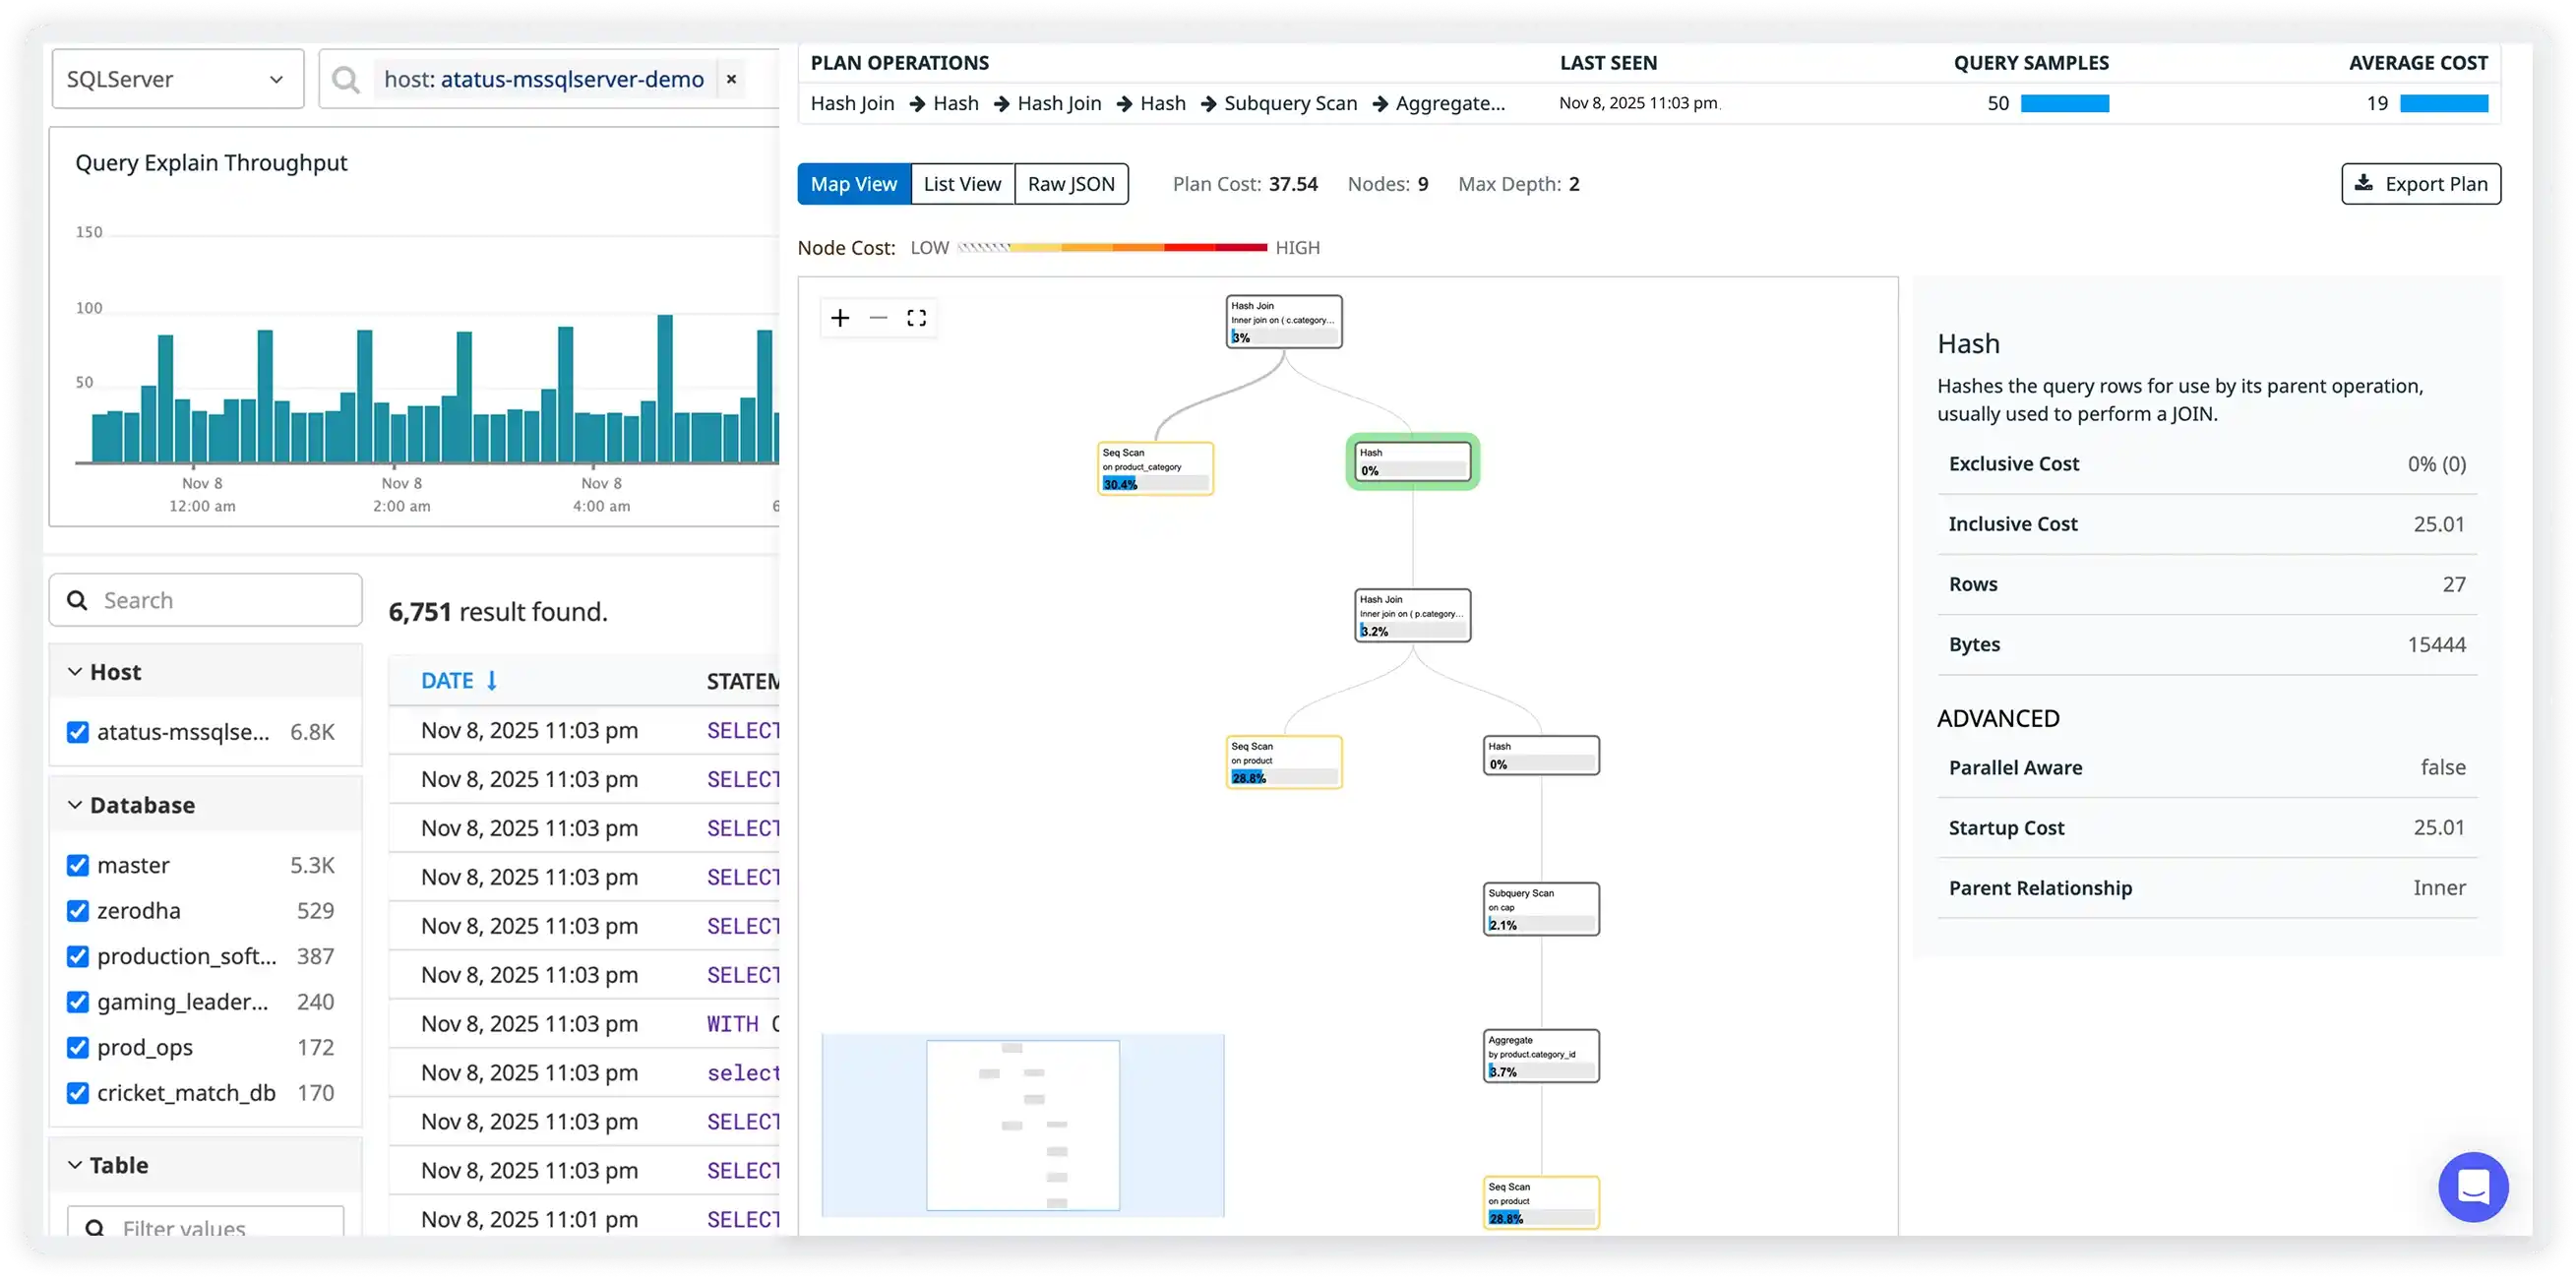
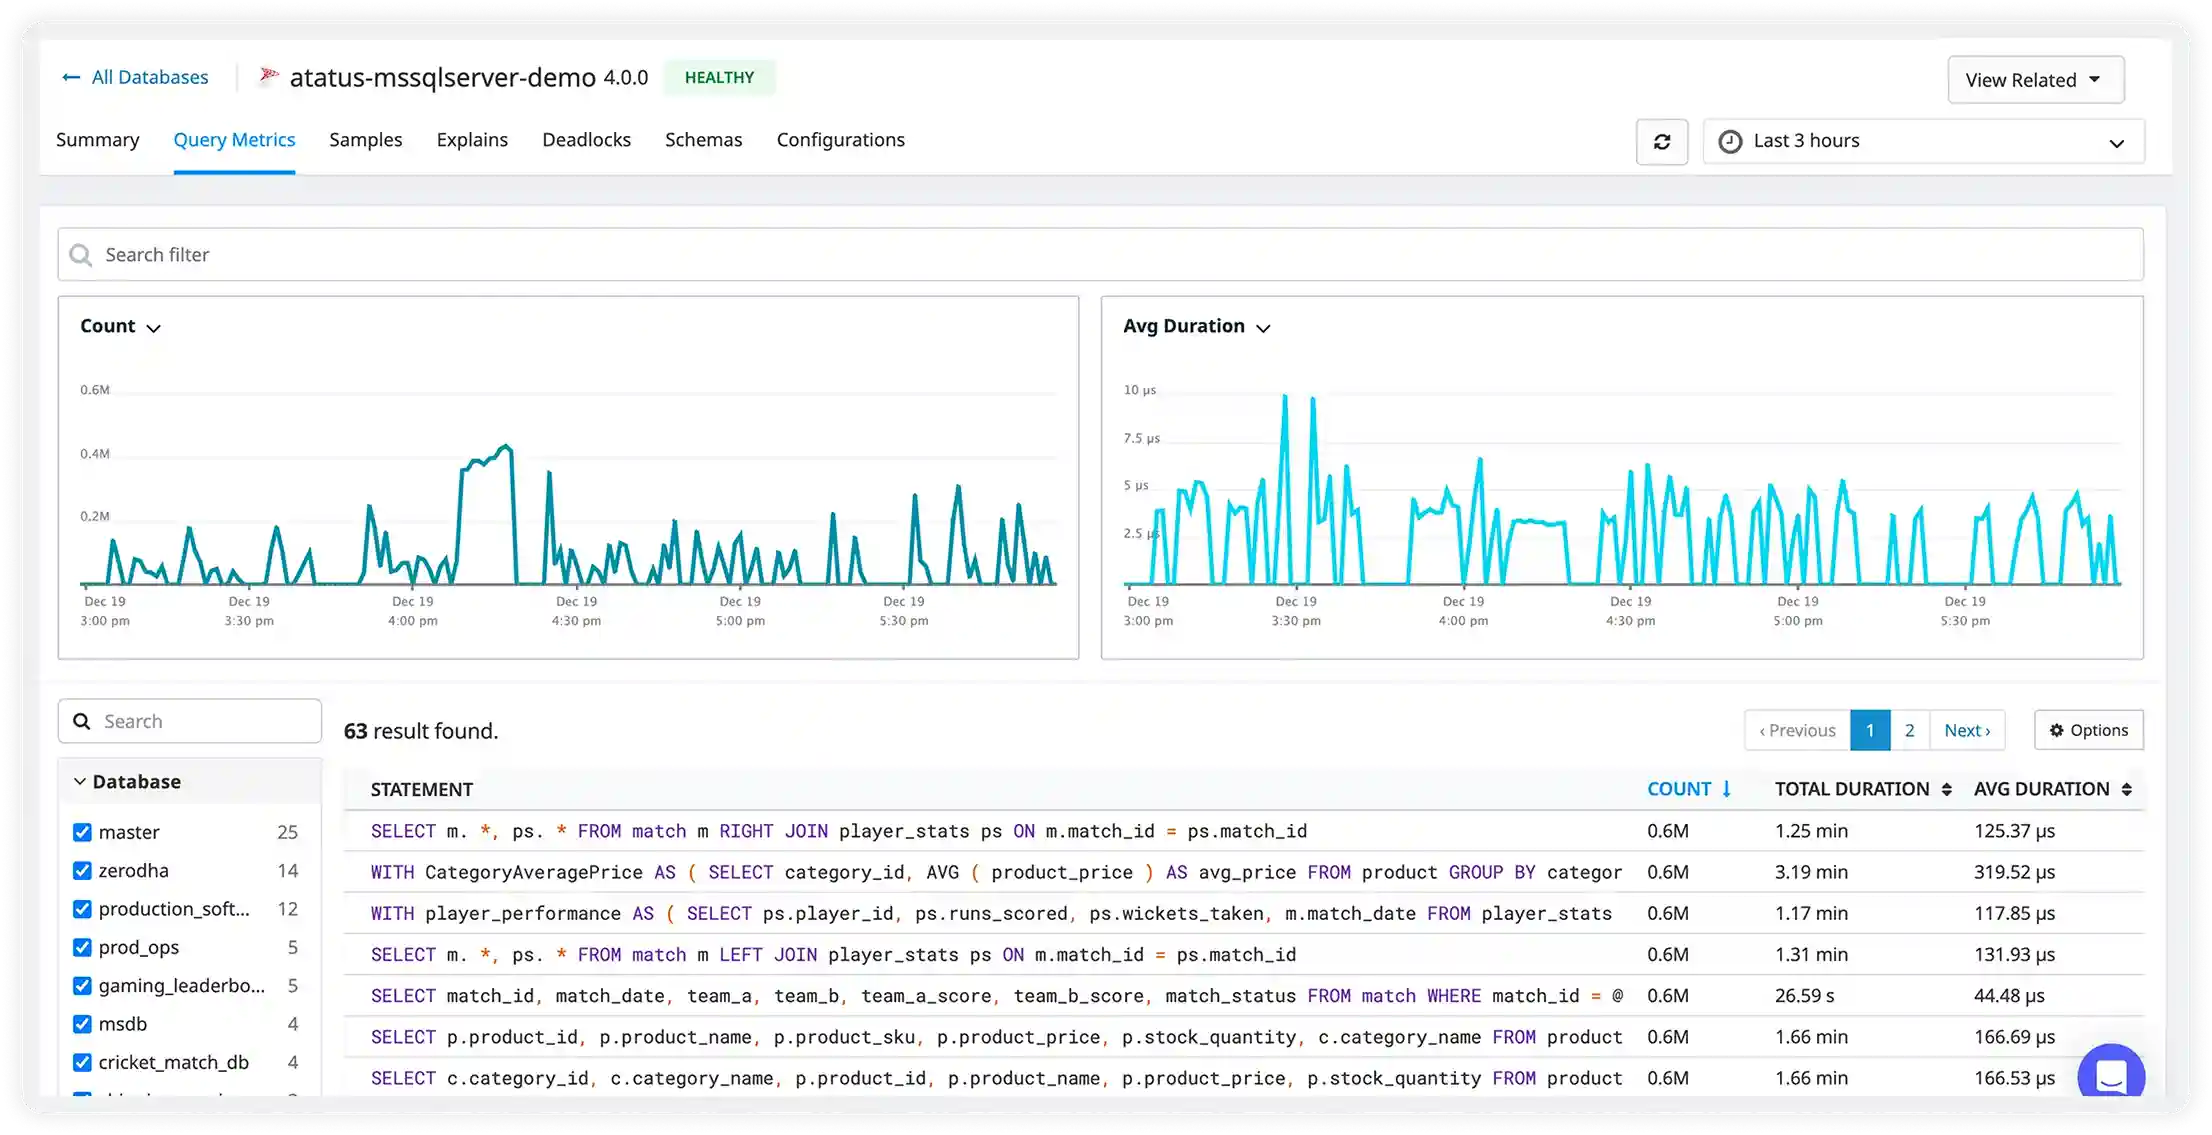
Track Query Regressions Before They Escalate
Monitor query volume and execution duration trends over time to understand workload behavior. Identify spikes, regressions, and performance anomalies across databases and time ranges before they impact applications.
Diagnose and Optimize Deadlocks with AI Guidance
Interactive deadlock maps reveal lock dependencies and contention chains, while AI-assisted insights help teams understand impact and apply optimization to prevent repeat deadlocks.
Analyze Lock Waits and Concurrency Bottlenecks
Differentiate CPU-bound queries from lock and concurrency waits to understand throughput limits. Identify blocking activity, assess contention impact, and prioritize fixes that restore performance and user experience.
Start Monitoring in Under 5 Minutes
Three simple steps to complete observability. No credit card required.
Connect Your Database
Install the Atatus agent and configure database monitoring for your environment. Supports MySQL, PostgreSQL, SQL Server, Oracle, MongoDB, Redis, and cloud-managed databases, with automatic discovery of active instances.
Auto-Capture Query Metrics
Atatus automatically tracks slow queries, execution times, resource usage, and explain plans without manual instrumentation.
Optimize & Scale Performance
View real-time dashboards, analyze query patterns, and get optimization recommendations to reduce latency and costs.
Milestones that spark performance excellence
Reflections from clients who've achieved unmatched excellence through innovative strategies.
Read customer stories


