Gain visibility into MySQL workload behavior and operational stability
Track MySQL query activity, transaction behavior, error events, performance signals, and replication health in real time.
Proactively Detect and Fix MySQL Performance Bottlenecks
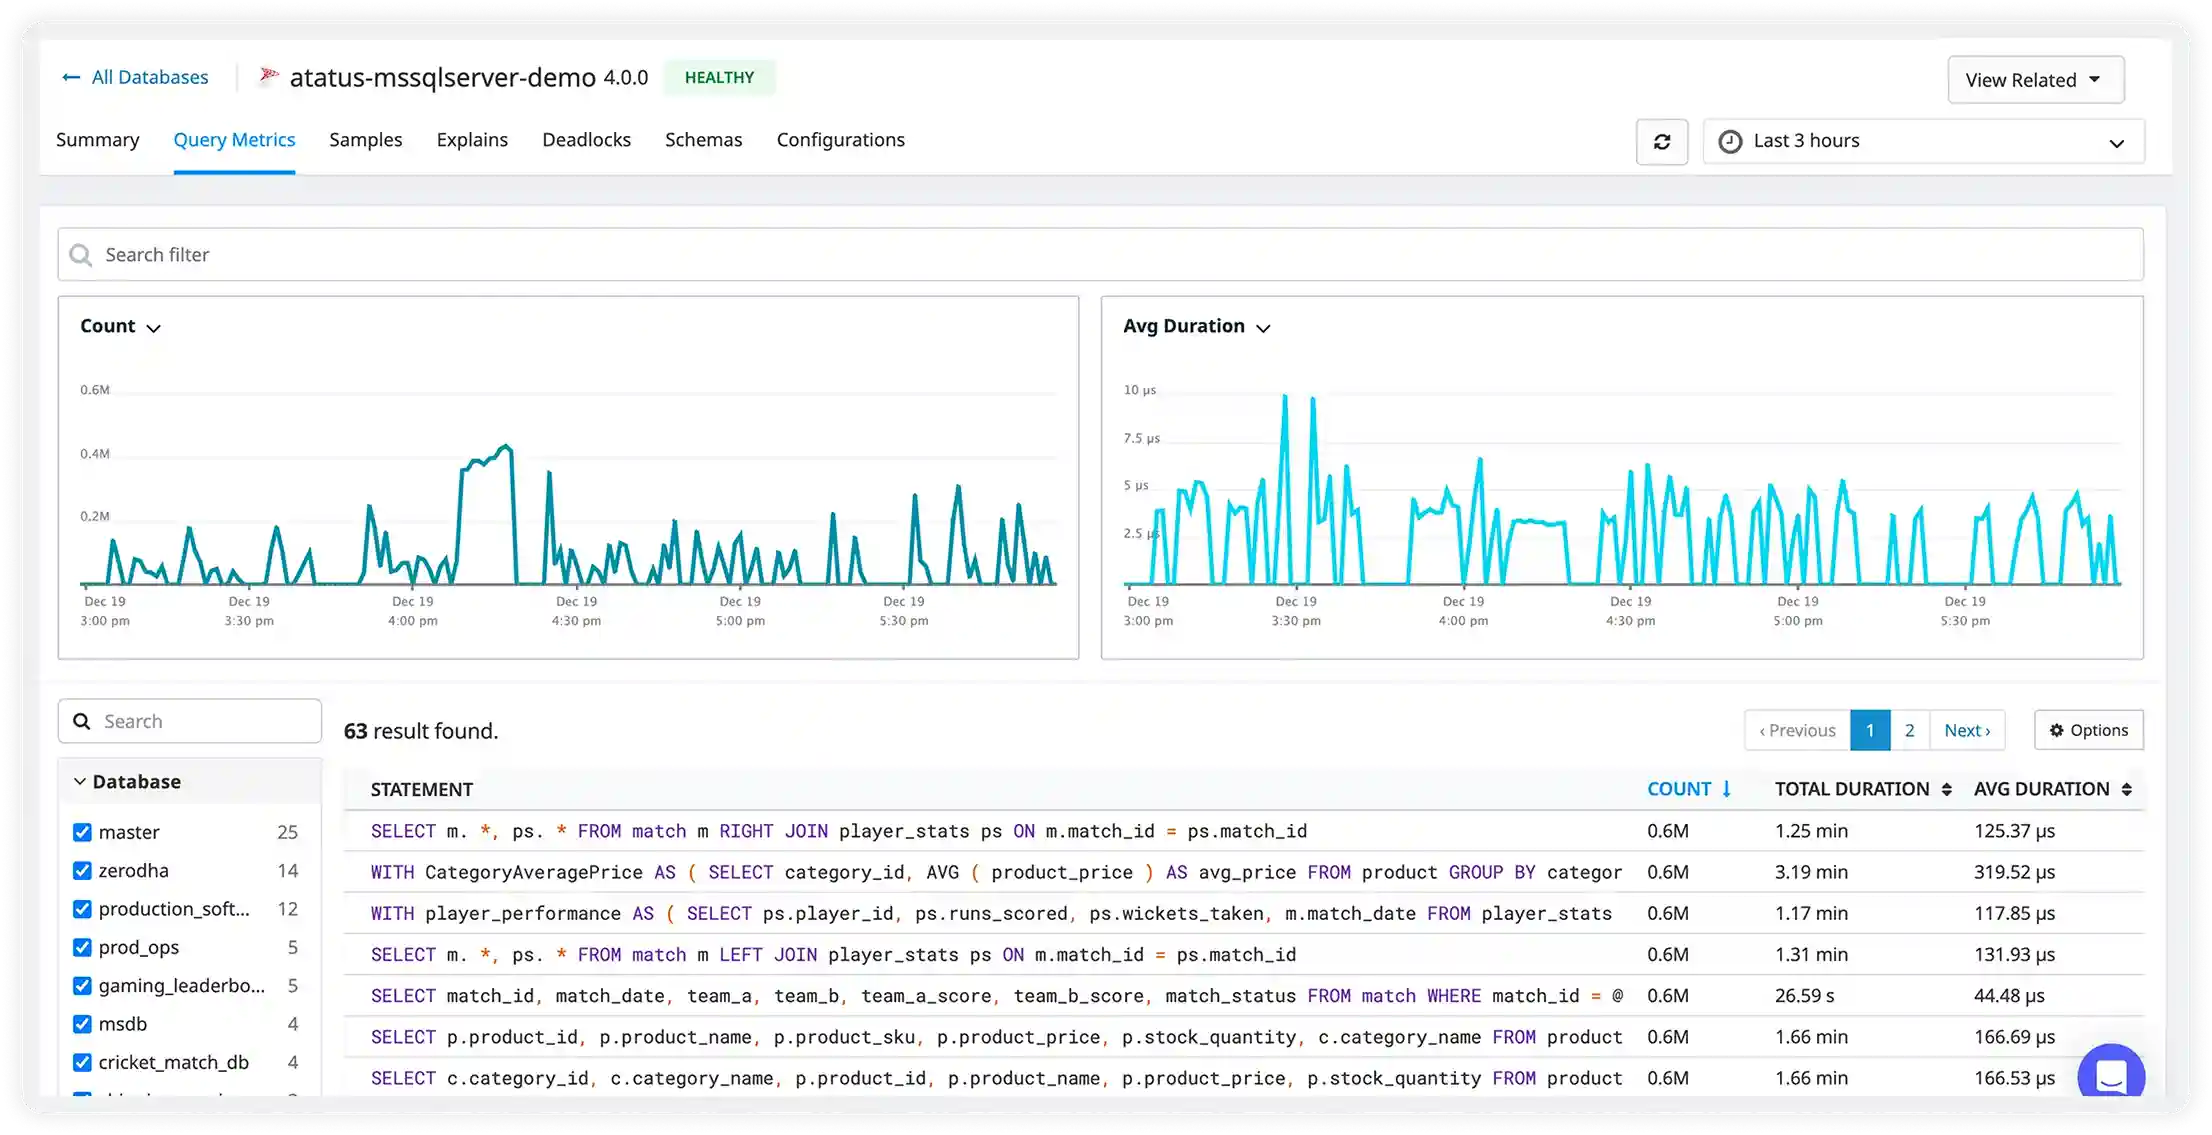
Query Execution Analysis
Analyzes MySQL query execution time, optimizer decisions, index selection, and full table scans to detect inefficient SQL patterns affecting transactional workloads.
Connection Pool Saturation
Monitors active threads, max connection limits, and aborted connections to identify concurrency pressure and connection management issues.
InnoDB Lock Monitoring
Tracks row-level locks, deadlocks, and transaction wait states within InnoDB to pinpoint contention caused by concurrent writes.
Replication Lag Tracking
Measures binary log application delay between primary and replicas to identify replication bottlenecks and data freshness risks.
Buffer Pool Efficiency
Evaluates InnoDB buffer pool hit ratio, memory pressure, and page eviction behavior impacting read latency.
Disk IO Performance
Correlates MySQL read/write latency with underlying storage throughput, fsync operations, and checkpoint behavior.
Error Log Analysis
Surfaces MySQL error logs related to startup failures, crash recovery, table corruption, and replication issues.
Resource Utilization Trends
Tracks CPU, memory, and disk usage attributed to MySQL processes to support capacity planning and workload forecasting.
Pinpoint and Eliminate MySQL Performance Bottlenecks in Real Time
Slow queries, lock contention, replication lag, and resource pressure clearly surfaced.
Query Performance Metrics
- Track query throughput and execution latency in real time to understand how your database performs under live workloads and instantly detect sudden traffic surges or slow-running operations.
- Monitor workload spikes alongside resource consumption patterns to quickly identify abnormal usage before it impacts application performance or availability
- Surface the most resource-intensive queries contributing to high CPU usage, lock contention, and I/O pressure so teams can prioritize optimization where it matters most.
- Analyze query performance trends across peak and off-peak periods to uncover load-related slowdowns and validate tuning or scaling improvements over time.
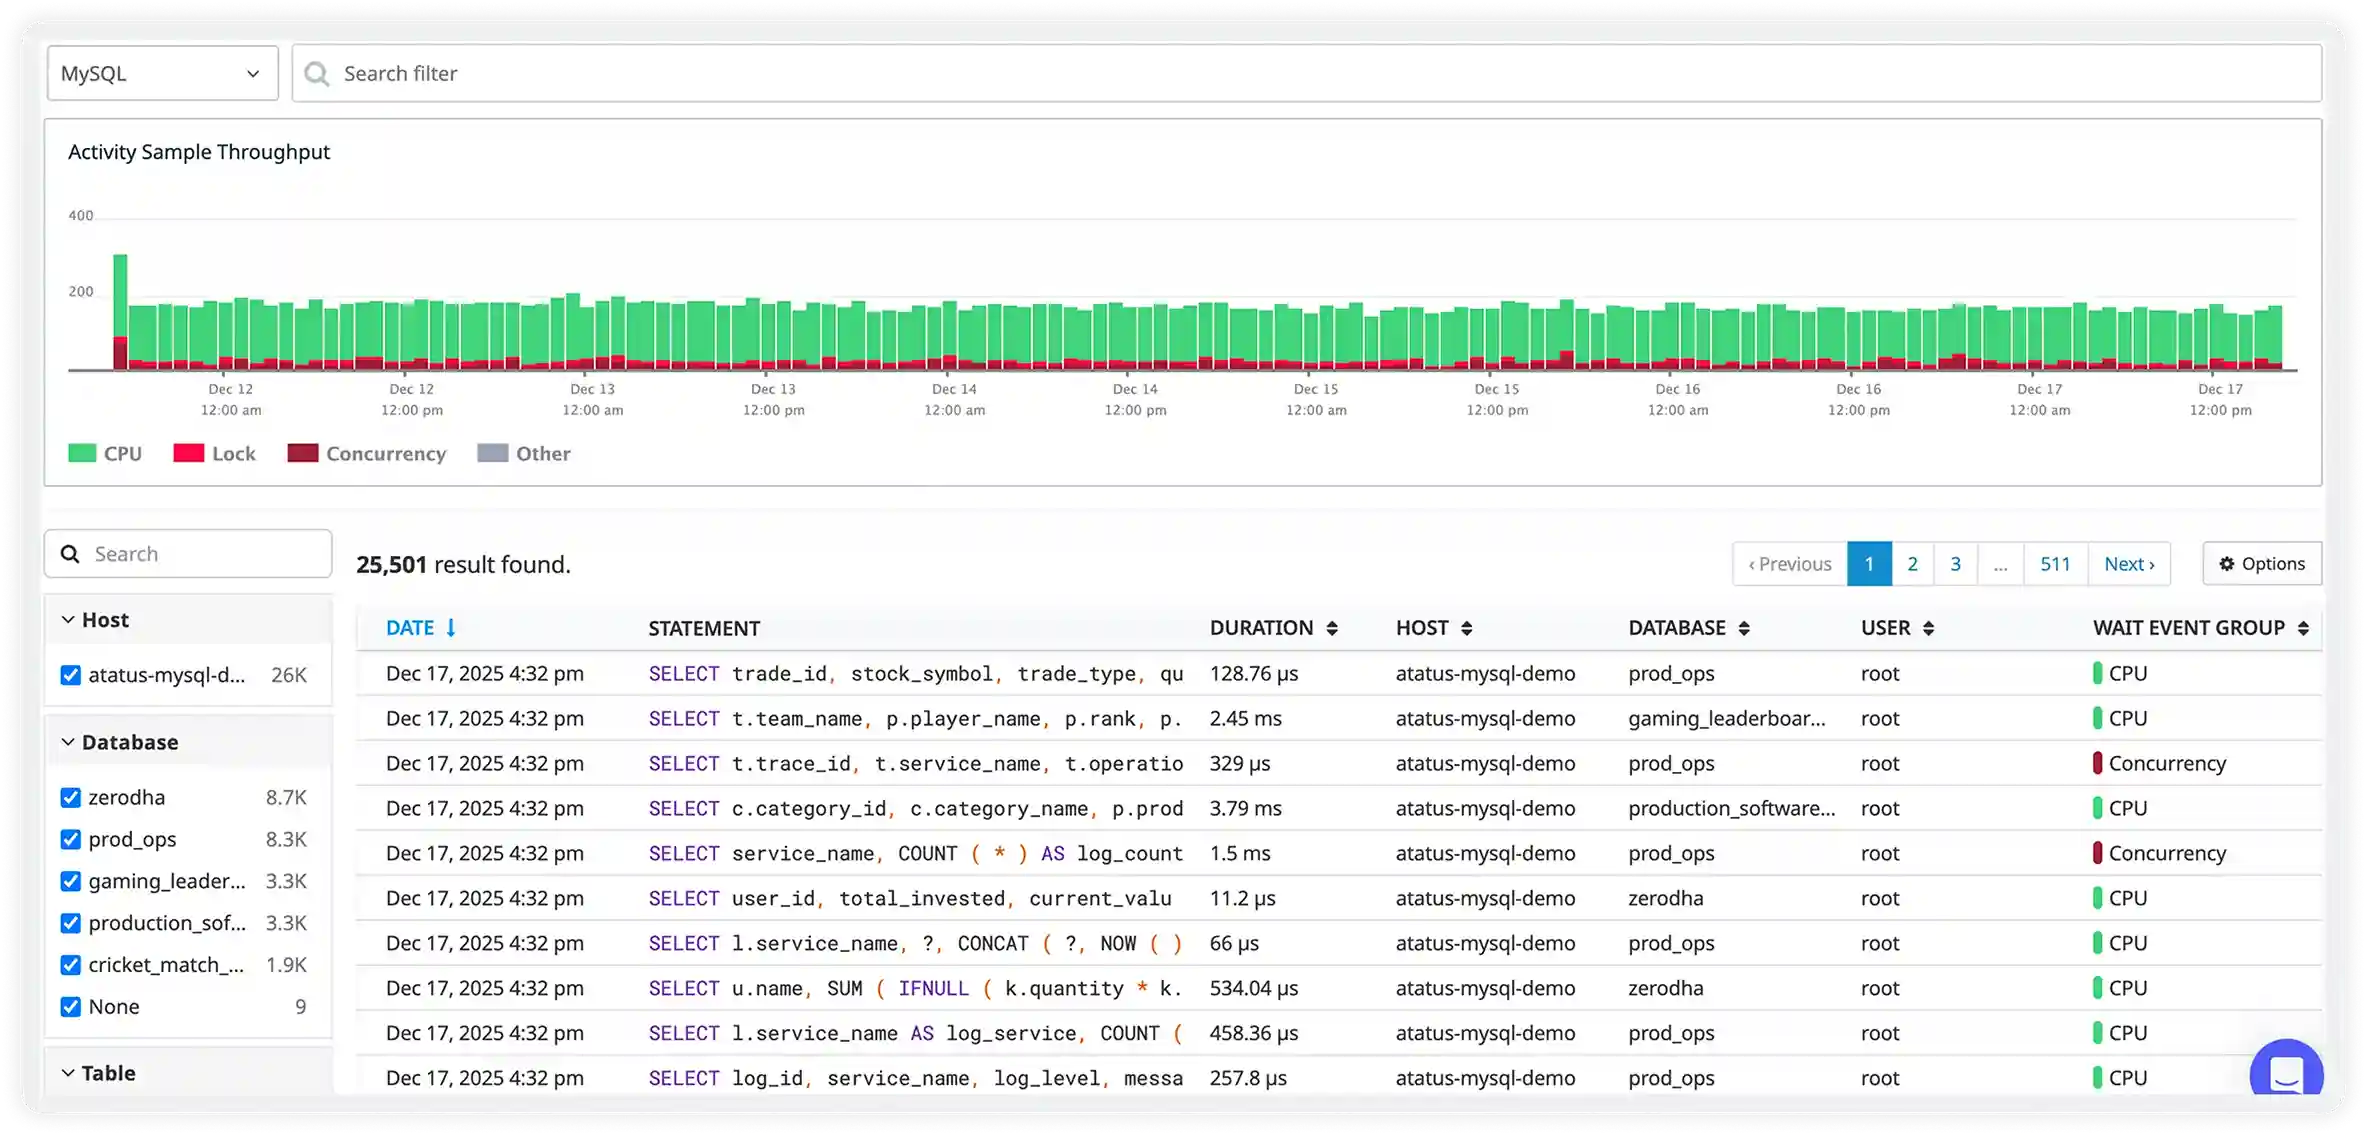
Live Query Samples & Slow Queries
- Capture every executed MySQL query in real time along with execution duration, database name, and user context to get full visibility into what's running in production.
- Automatically highlight slow-running and resource-heavy SQL statements so performance issues can be spotted and addressed without manual investigation.
- Filter queries by schema, table, host, or user to quickly narrow down the exact source of bottlenecks and problematic workloads.
- Analyze real production query patterns over time to understand usage behavior, optimize hot paths, and prevent recurring performance problems.
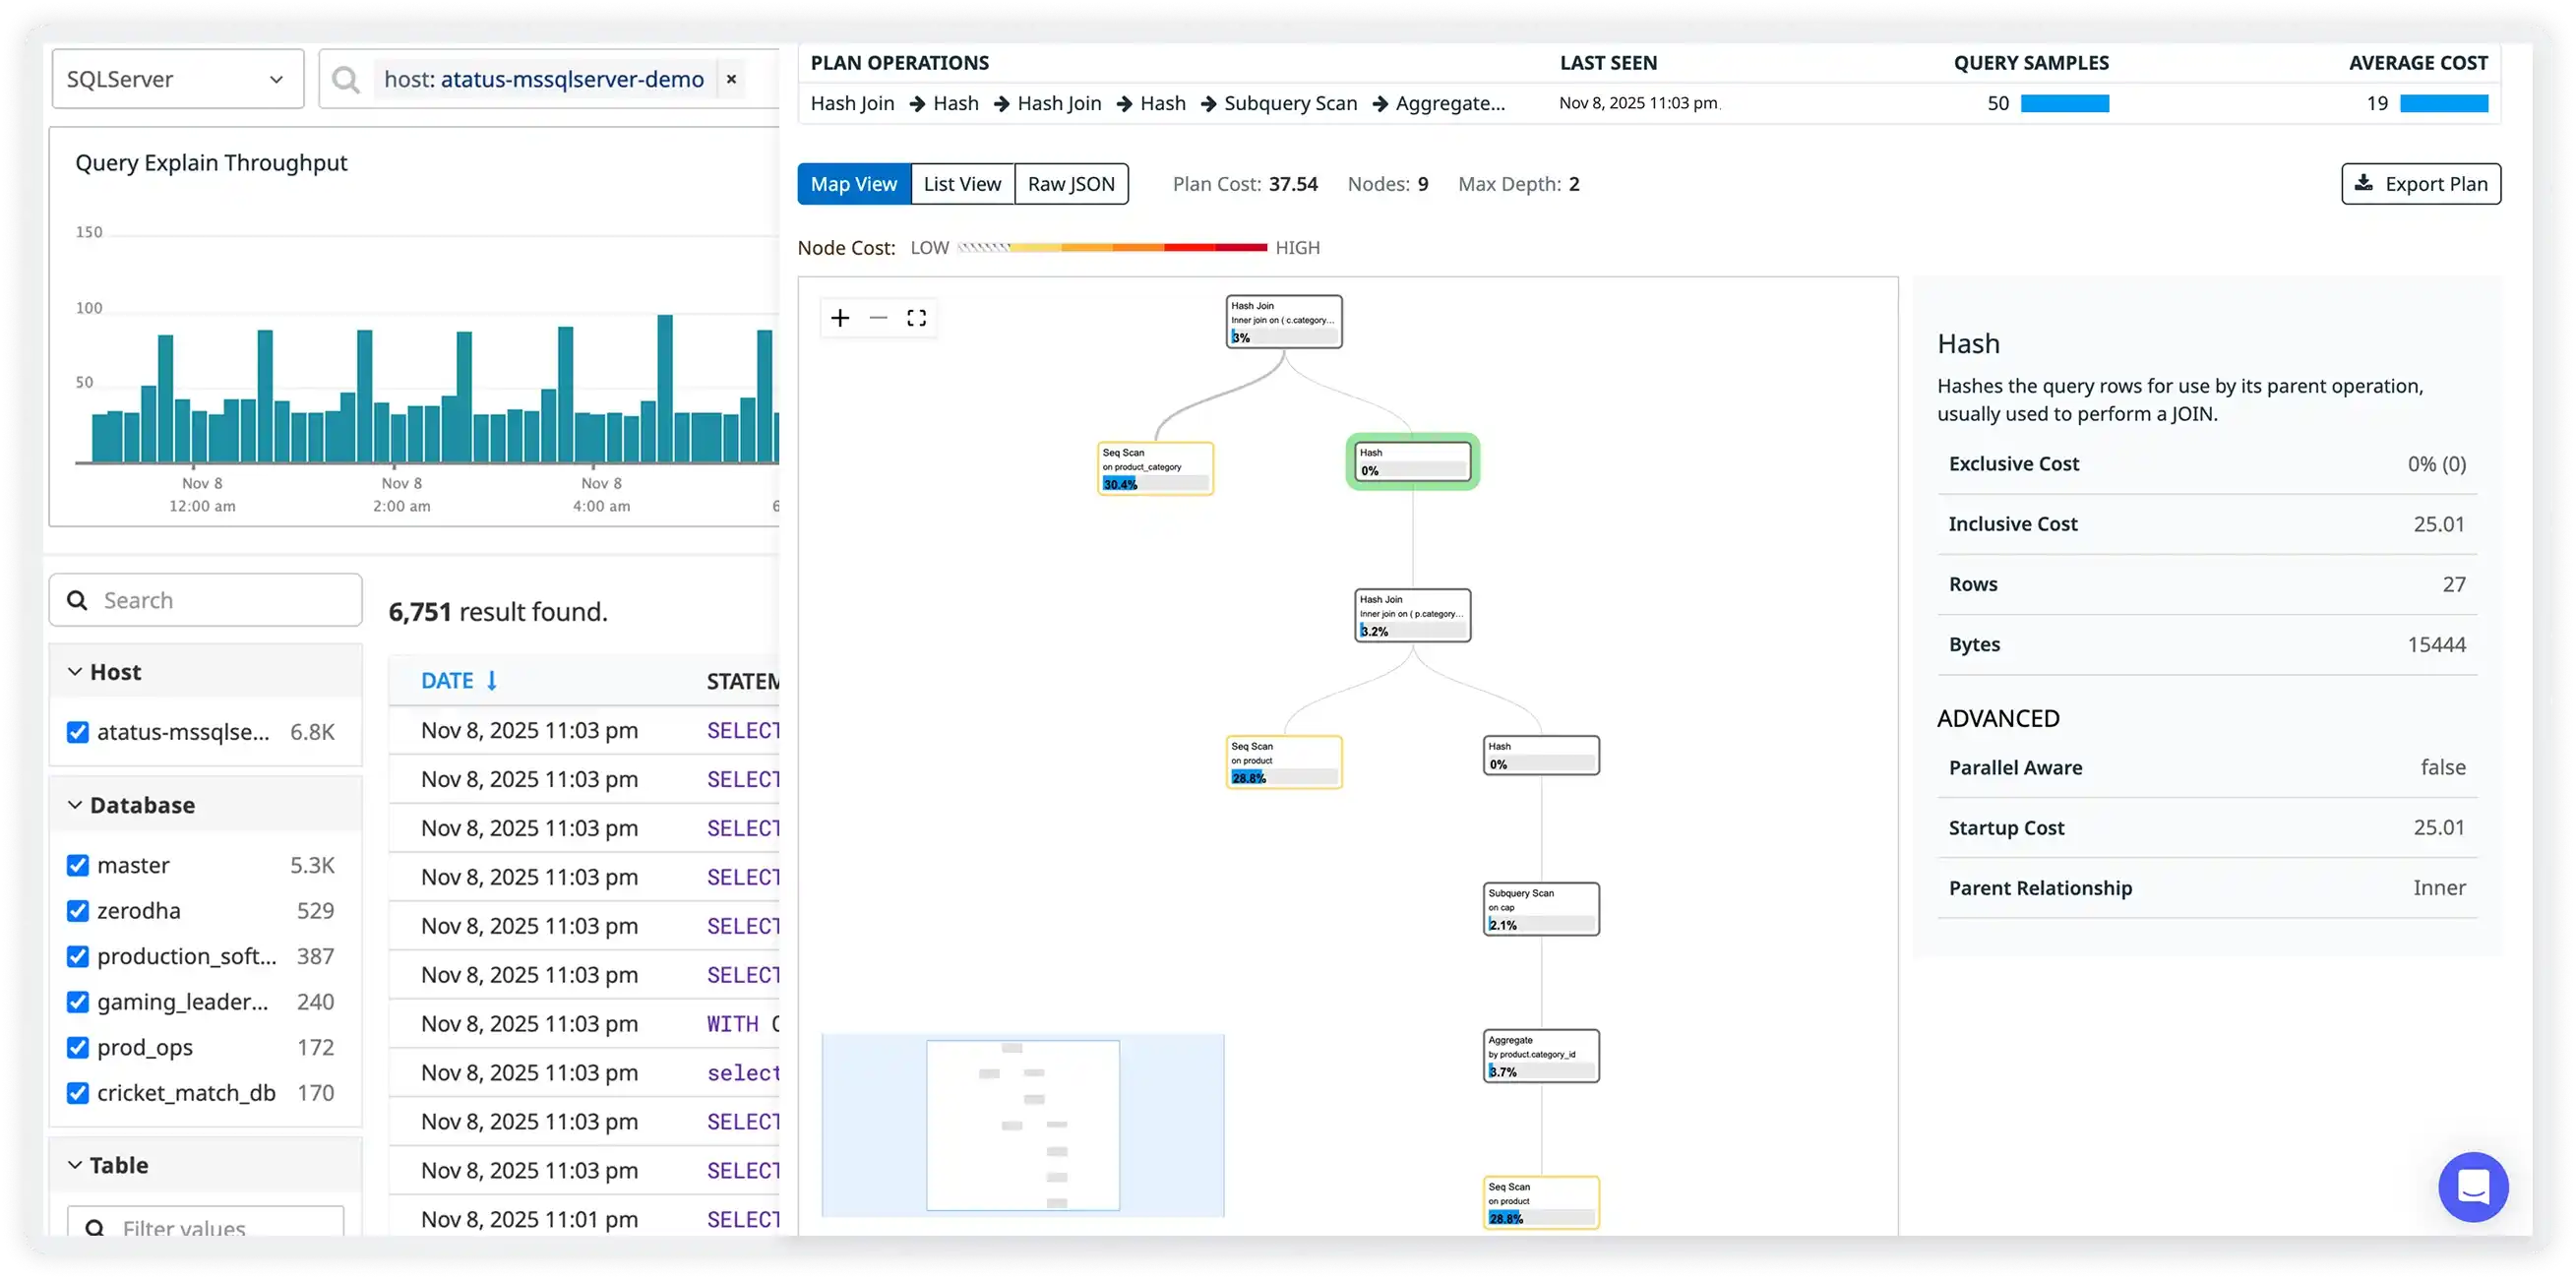
Query Explain & Optimization Insights
- Visualize MySQL execution plans clearly to understand how joins, table scans, and index lookups are performed during query execution.
- Automatically detect full table scans and inefficient execution paths that lead to slow performance and unnecessary resource consumption.
- Break down query cost by each operation step to quickly identify where time and resources are being spent the most.
- Optimize SQL queries based on real runtime behavior rather than assumptions, ensuring tuning efforts deliver measurable performance improvements.
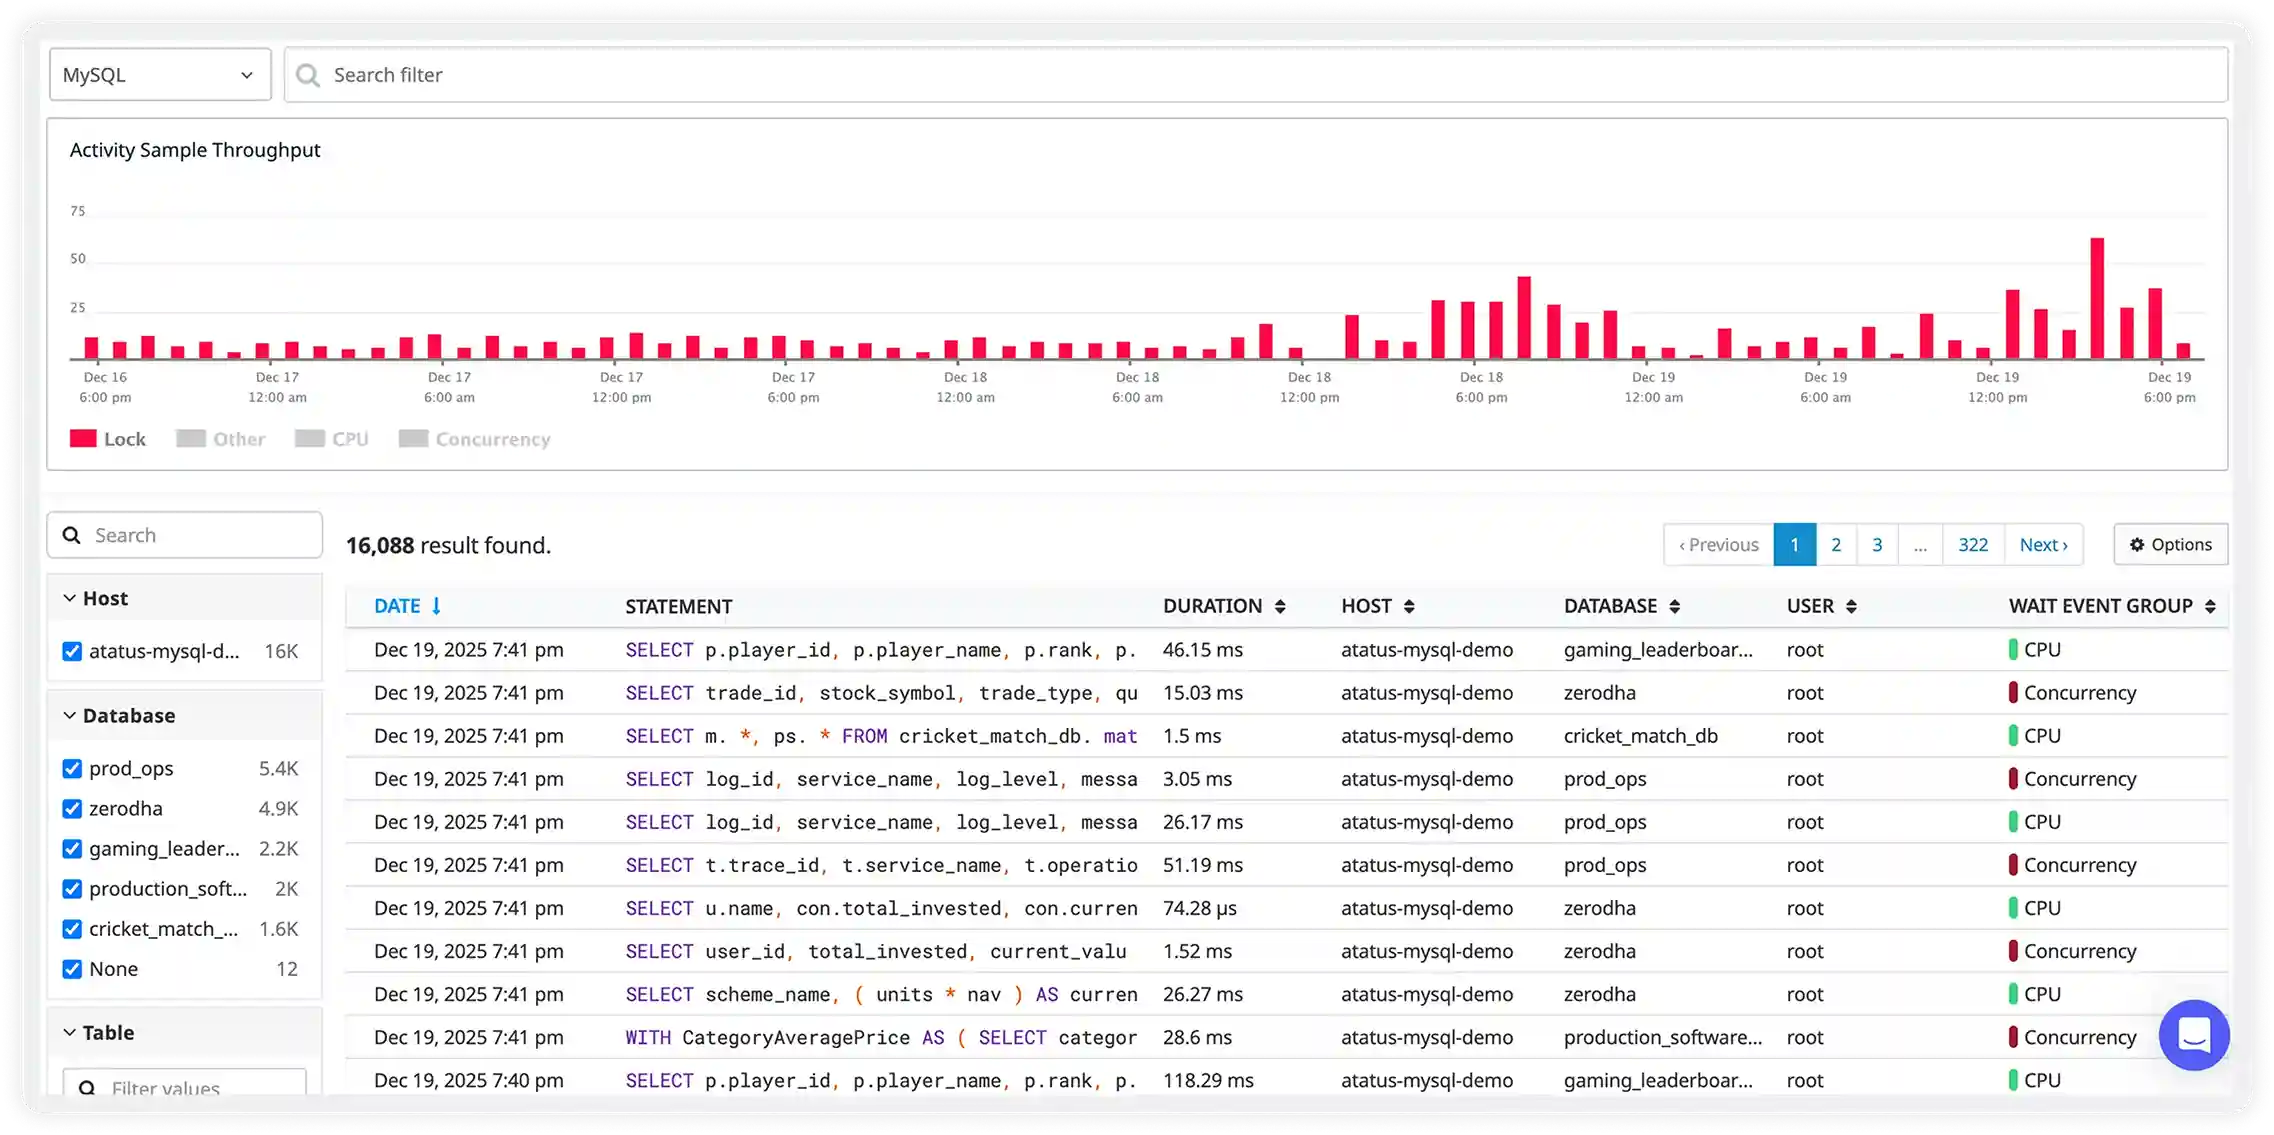
Locking, Deadlocks & Concurrency Control
- Monitor row-level locks, table locks, and transaction wait times in real time to understand how concurrency impacts overall database performance.
- Visualize blocking chains to trace which transactions are holding locks and which ones are waiting, making root cause analysis faster and simpler.
- Reduce contention by optimizing lock-heavy queries, shortening transaction durations, and improving access patterns for smoother parallel processing.
Why choose Atatus for MySQL database monitoring?
Production-grade MySQL insights
Purpose-built metrics reflect real MySQL behavior in live environments, not generic server-level data.
Faster query optimization
Quickly surface slow queries, inefficient indexes, and heavy scans with full execution context for tuning.
Lock contention visibility
Monitor transaction locks, deadlocks, and row-level waits to remove write-heavy performance bottlenecks.
Reliable replication monitoring
Track replica lag, binlog delays, and replication errors to maintain high availability.
Full system correlation
Connect MySQL activity with CPU, memory, and disk usage to isolate root causes faster.
Zero-impact monitoring
Collect deep performance metrics without query changes or production performance risk.
Unified Observability for Every Engineering Team
Atatus adapts to how engineering teams work across development, operations, and reliability.
Developers
Trace requests, debug errors, and identify performance issues at the code level with clear context.
DevOps
Track deployments, monitor infrastructure impact, and understand how releases affect application stability.
Release Engineer
Measure service health, latency, and error rates to maintain reliability and reduce production risk.