Operational Logs and Concurrency Analysis
From slow queries and lock contention to replication health and resource utilization, everything you need to optimize PostgreSQL performance.
PostgreSQL Database Monitoring
Query Plan Analysis
Analyzes execution plans, index scans, and sequential scans to detect inefficient SQL execution paths.
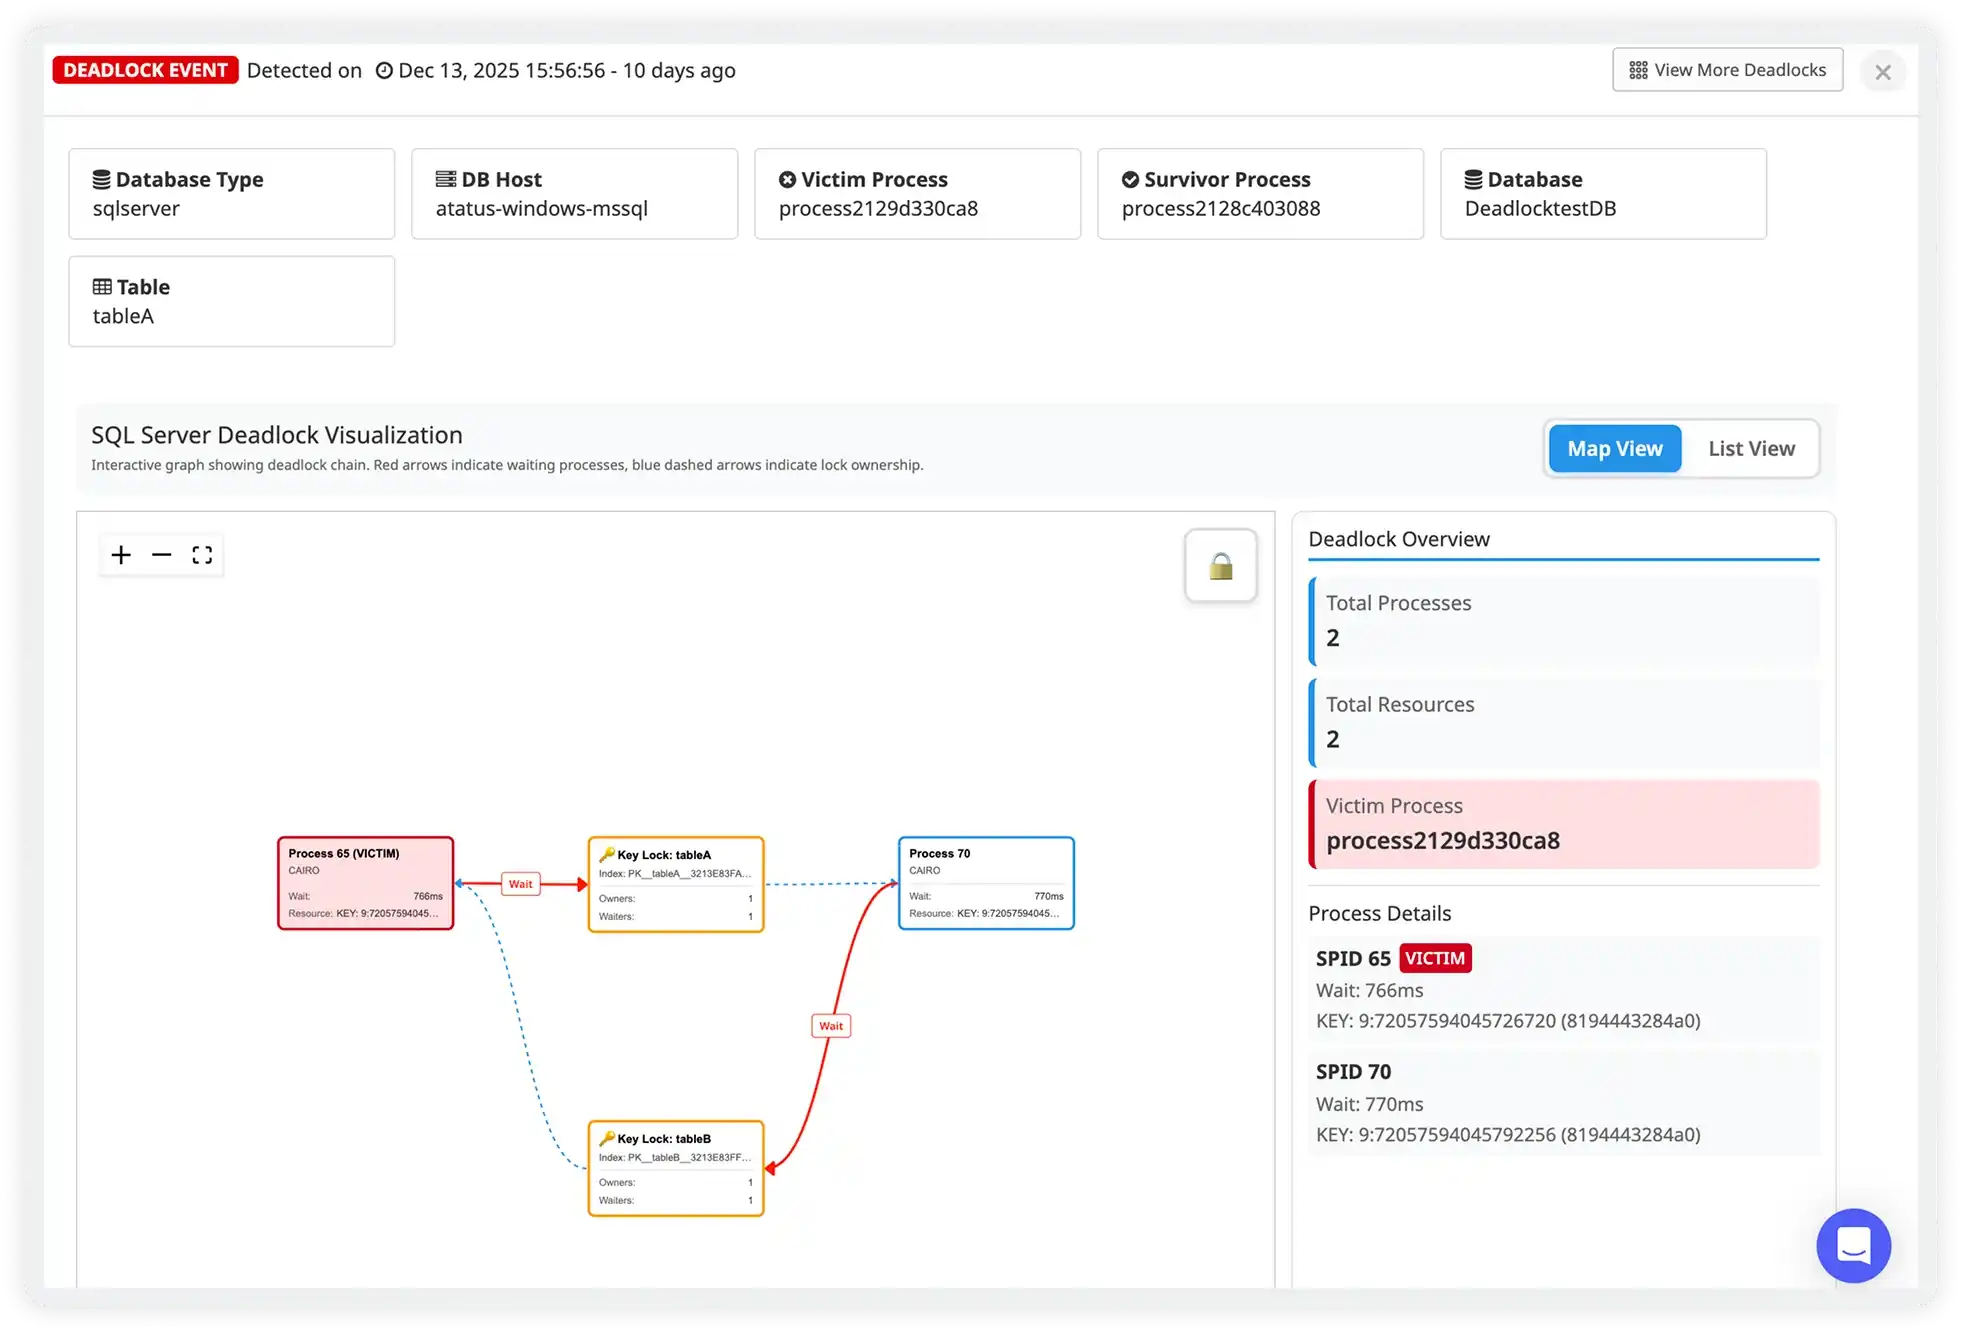
Lock and Wait Events
Tracks row, table, and advisory locks that cause transaction blocking and latency spikes.
Connection Saturation
Monitors active sessions, idle transactions, and max connection limits.
Autovacuum Activity
Observes vacuum frequency, table bloat growth, and dead tuple accumulation.
WAL and Replication Lag
Measures WAL generation rate and replica replay delay affecting data consistency.
Cache Hit Efficiency
Tracks shared buffer cache effectiveness and disk read dependency.
Error Log Monitoring
Captures PostgreSQL errors related to crashes, checkpoints, and replication.
Resource Usage Trends
Analyzes CPU, memory, and disk IO consumption under transactional workloads.
Deep Visibility Into PostgreSQL Workloads and Query Execution Behavior
Understand performance across execution plans, transactions, memory, and I/O.
Workload Trends & Query Health
- Track query latency percentiles, throughput, and peak load in real time to understand database performance under live production traffic.
- Identify performance drops during traffic surges, reporting jobs, or heavy batch workloads before they impact users.
- Monitor read and write pressure across schemas and databases to detect imbalance and scaling constraints.
- Measure the impact of tuning actions such as index creation, configuration changes, and query rewrites over time.
Active Queries & Long-Running Sessions
- View currently running SQL statements with execution duration, user context, and application source for full workload visibility.
- Instantly spot runaway queries consuming excessive CPU, memory, and I/O resources.
- Filter active sessions by state, application name, user, or runtime to isolate performance issues quickly.
- Understand real concurrency behavior under production load to prevent blocking and resource saturation.
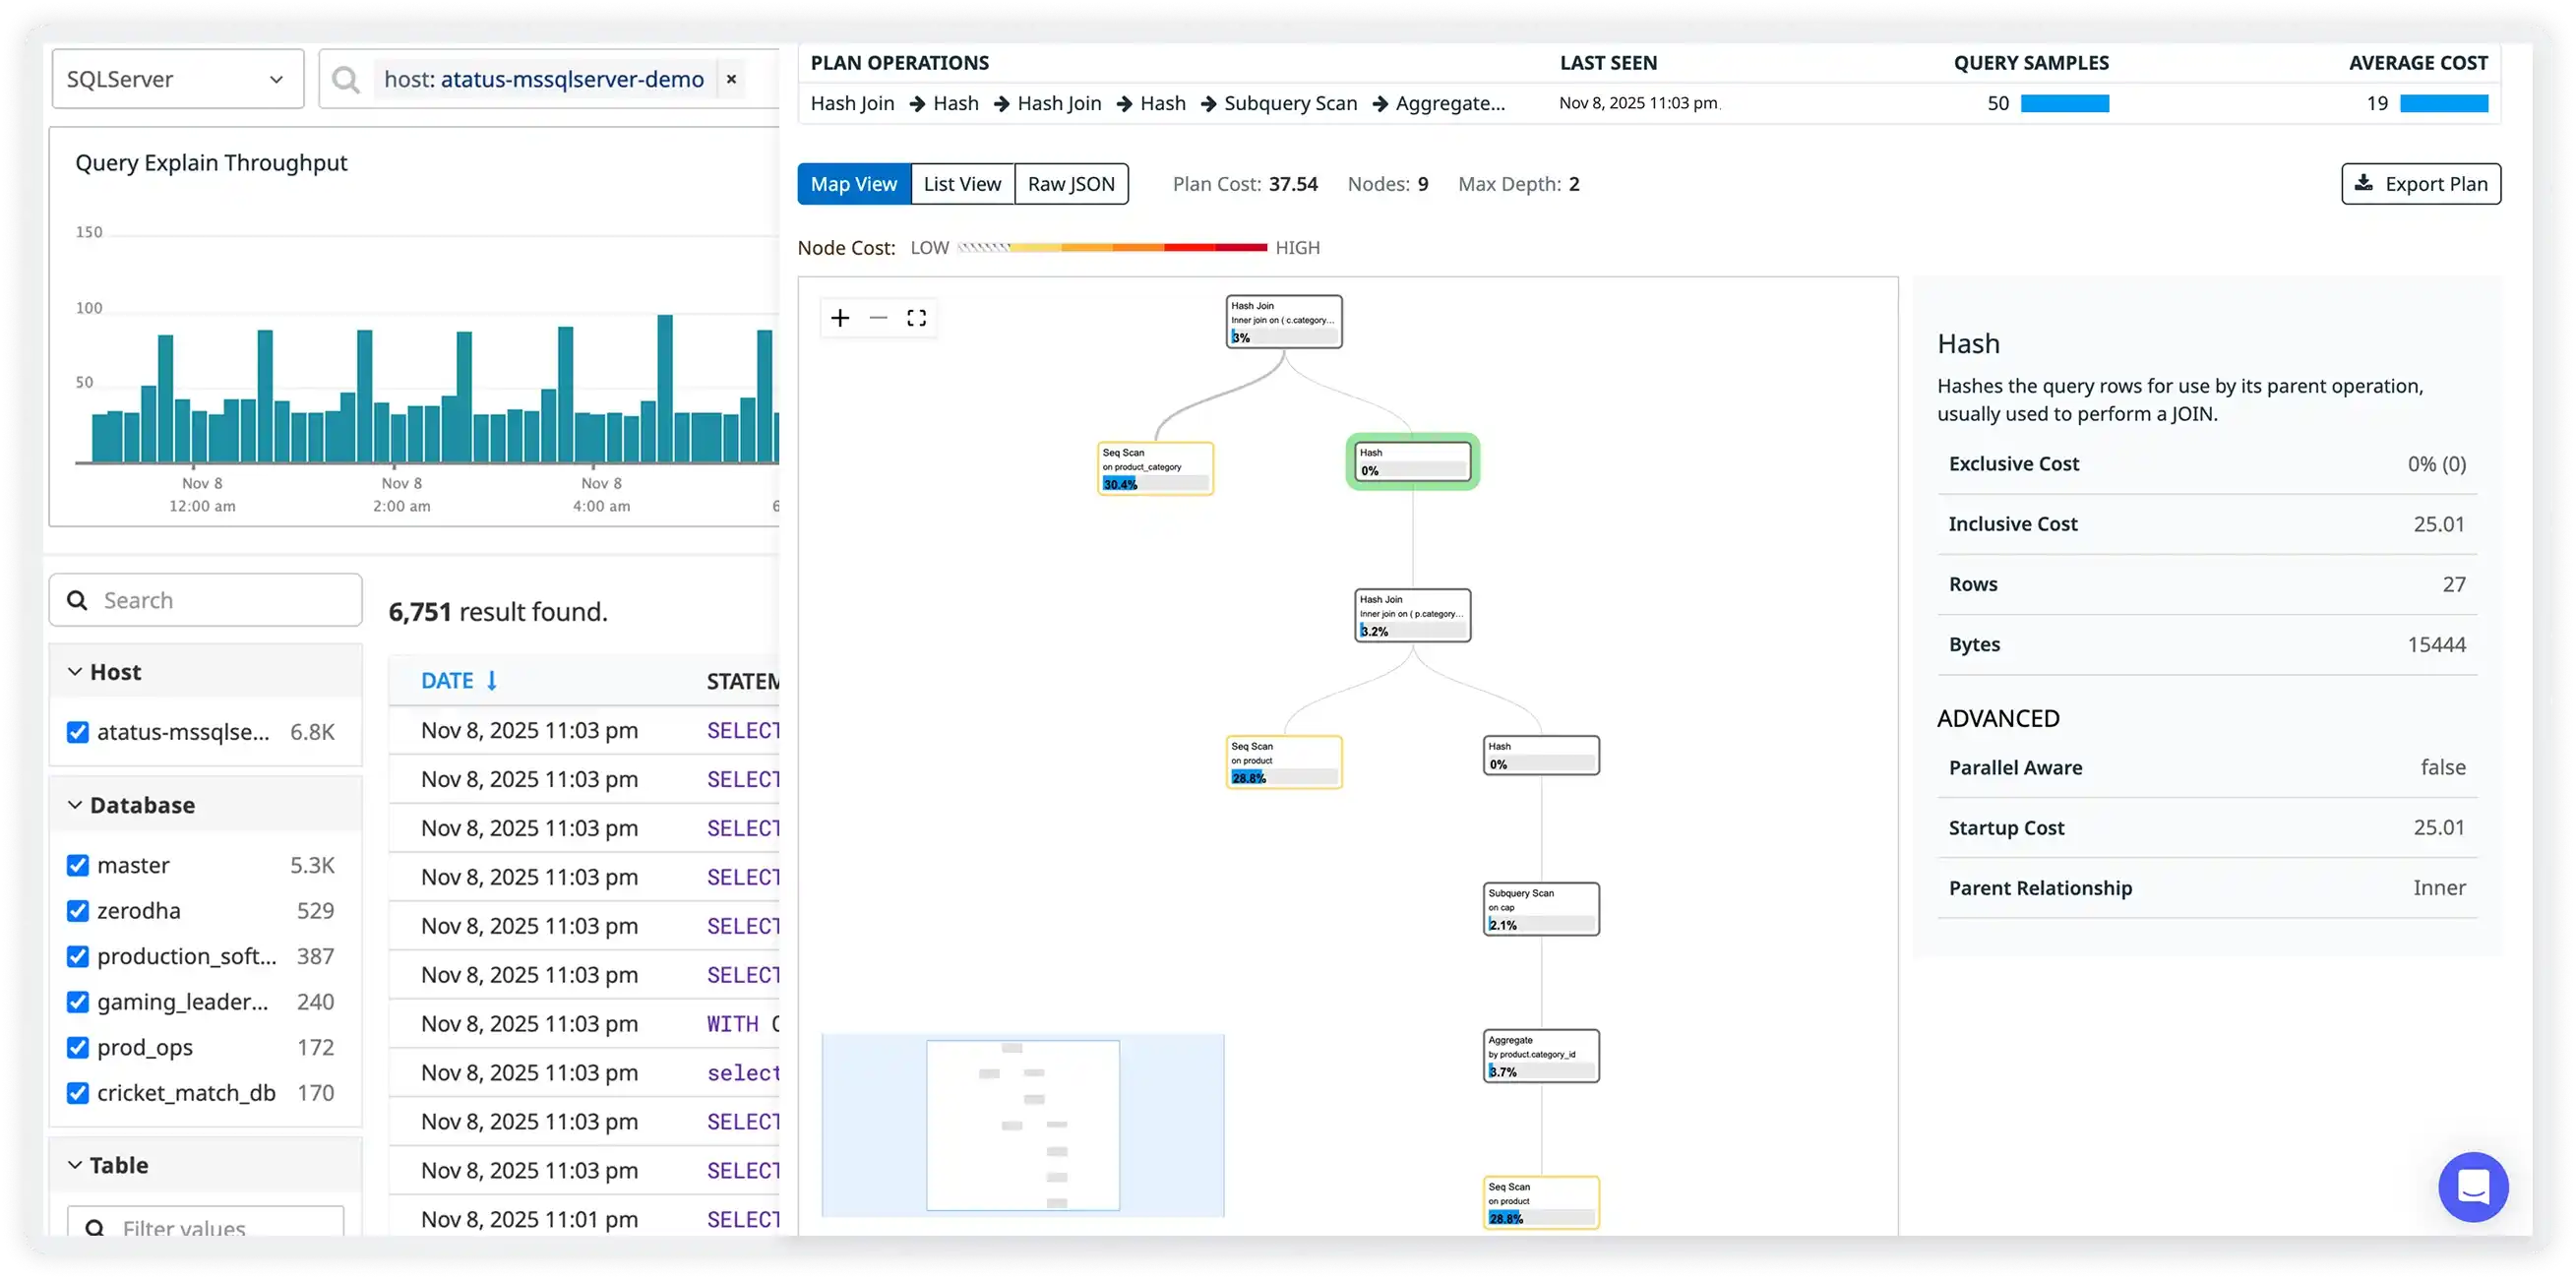
Execution Plans & Index Effectiveness
- Visualize PostgreSQL execution plans to clearly understand joins, scans, and index access paths used by each query.
- Automatically detect sequential scans slowing down large table queries and driving high I/O consumption.
- Compare estimated versus actual execution cost to uncover planner inaccuracies and optimization opportunities.
- Optimize performance using real execution behavior rather than theoretical plans alone.
Transaction Throughput & Resource Pressure
- Track transaction commit and rollback rates to evaluate workload stability and application behavior.
- Monitor buffer cache hit ratios and disk read pressure to understand memory efficiency and storage load.
- Identify I/O bottlenecks that slow down write-heavy and analytics workloads.
- Maintain consistent database performance during peak concurrency and high transaction volume periods.
Why choose Atatus for PostgreSQL database monitoring?
PostgreSQL execution insights
Analyze query plans, index usage, and sequential scans to spot inefficient execution paths.
Lock contention visibility
Monitor row, table, and advisory locks to identify blocking transactions quickly.
Autovacuum performance tracking
Track vacuum cycles, dead tuples, and table bloat to keep queries fast.
Replication health insights
Monitor WAL generation rates and replica replay lag for synchronization stability.
Connection behavior monitoring
Track idle sessions, long-running queries, and connection limits to prevent overload.
Full resource correlation
Link database activity with CPU, memory, and disk usage for faster root cause analysis.
Unified Observability for Every Engineering Team
Atatus adapts to how engineering teams work across development, operations, and reliability.
Developers
Trace requests, debug errors, and identify performance issues at the code level with clear context.
DevOps
Track deployments, monitor infrastructure impact, and understand how releases affect application stability.
Release Engineer
Measure service health, latency, and error rates to maintain reliability and reduce production risk.