Optimize Redis Performance While Preventing Memory & Replication Issues
Take control of your Redis environment, optimize performance, and ensure the reliability of your critical applications
Redis Database Monitoring
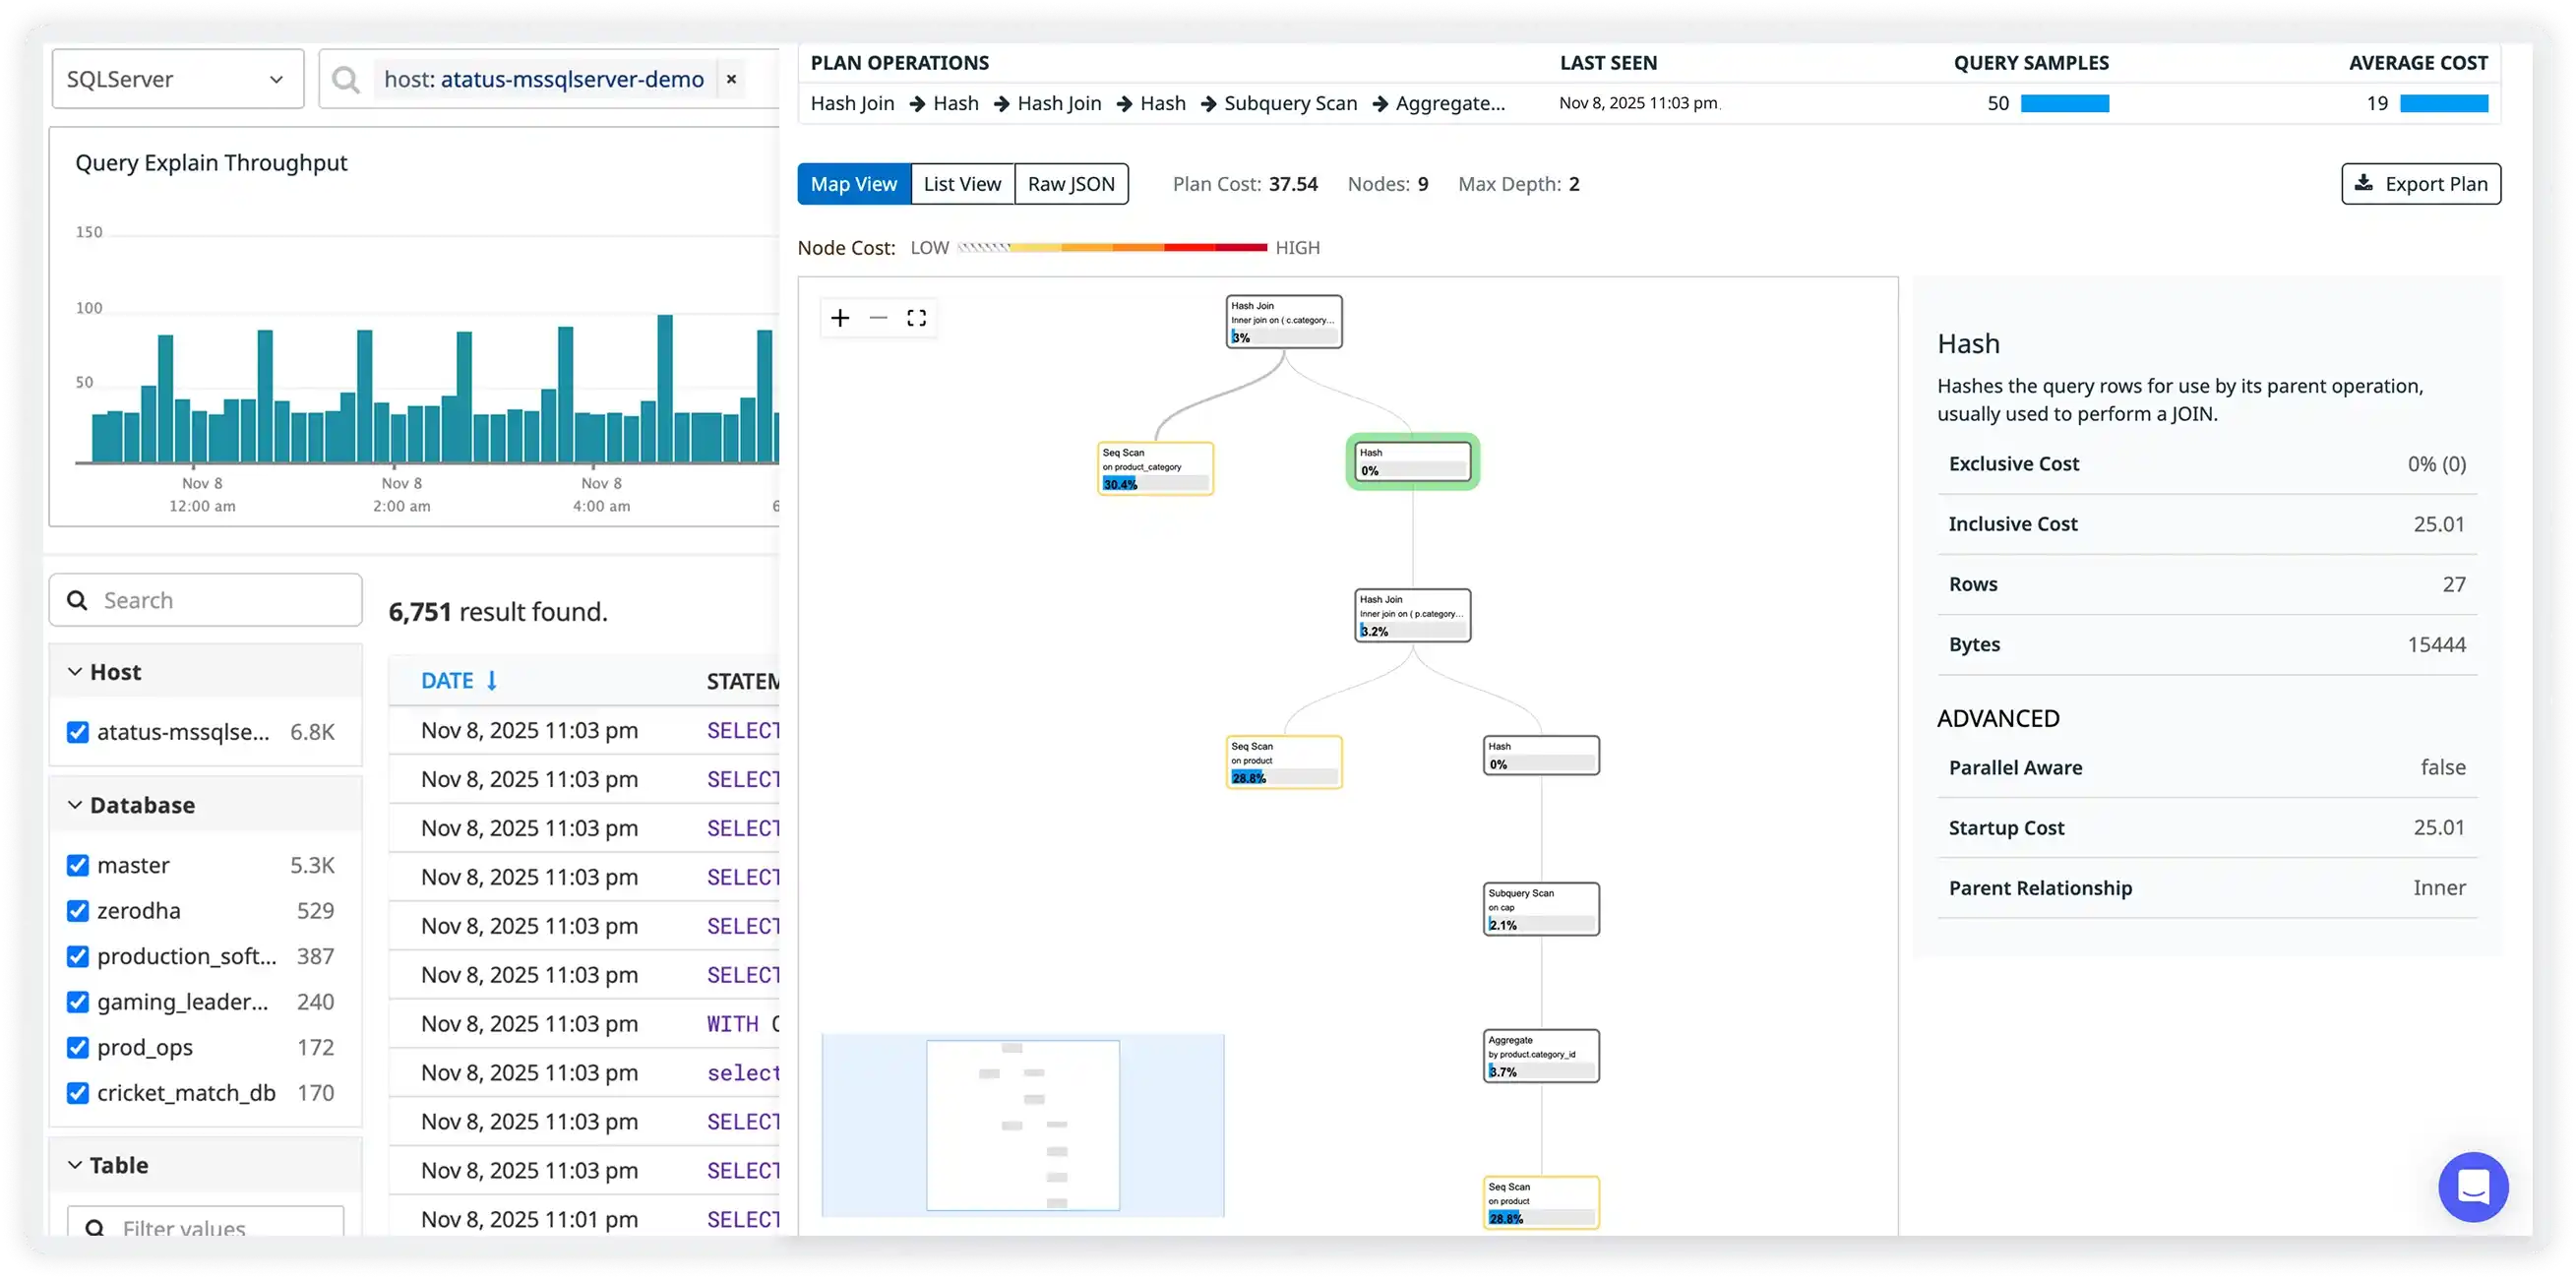
Command Execution Latency
Measures execution latency of Redis commands to detect blocking operations and long-running scripts.
Memory Fragmentation
Tracks memory usage patterns and fragmentation ratios affecting Redis performance under high load.
Eviction and Expiry Rates
Monitors key eviction frequency and TTL expiry behavior driven by Redis maxmemory policies.
Replication Synchronization
Observes master-replica synchronization status and partial resync behavior.
Persistence Operations
Tracks RDB snapshot duration and AOF rewrite activity impacting write throughput.
Client Connection Load
Monitors connected clients, blocked clients, and output buffer usage.
Error Log Visibility
Surfaces Redis logs related to persistence failures, memory exhaustion, and replication issues.
CPU Usage Patterns
Tracks Redis CPU utilization under single-threaded, high-throughput workloads.
High-Speed Redis Command Monitoring and Memory Optimization
Track throughput, latency, key growth, and replication behavior at scale.
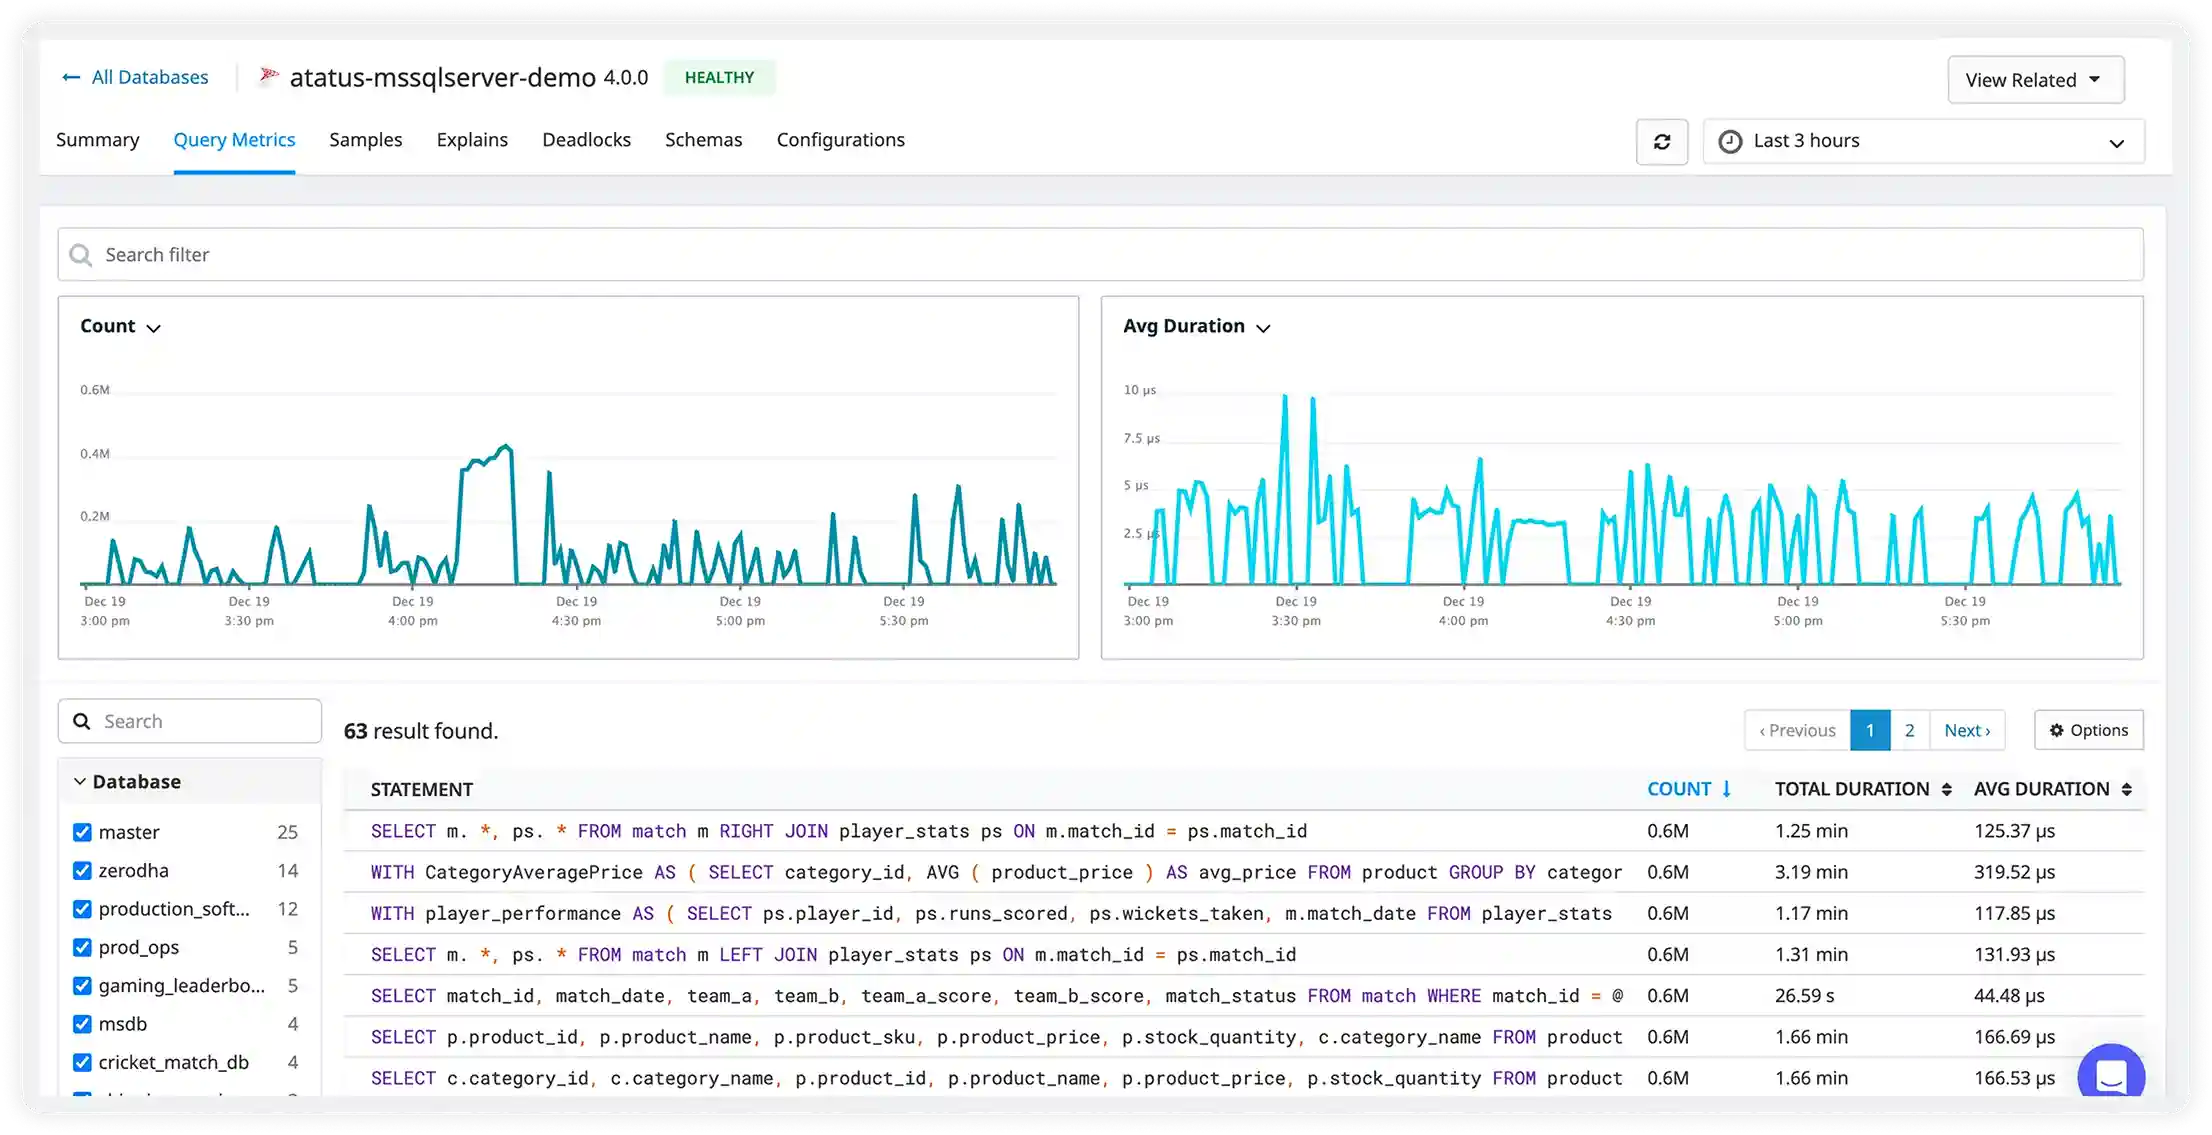
Command Performance & Throughput
- Track Redis command execution rates and latency in real time to understand how workloads perform under live production traffic.
- Identify slow or resource-heavy operations that degrade real-time application responsiveness and user experience.
- Monitor read versus write traffic balance continuously to detect workload shifts and scaling pressure.
- Detect sudden traffic bursts or abnormal request patterns that may impact node stability and throughput.
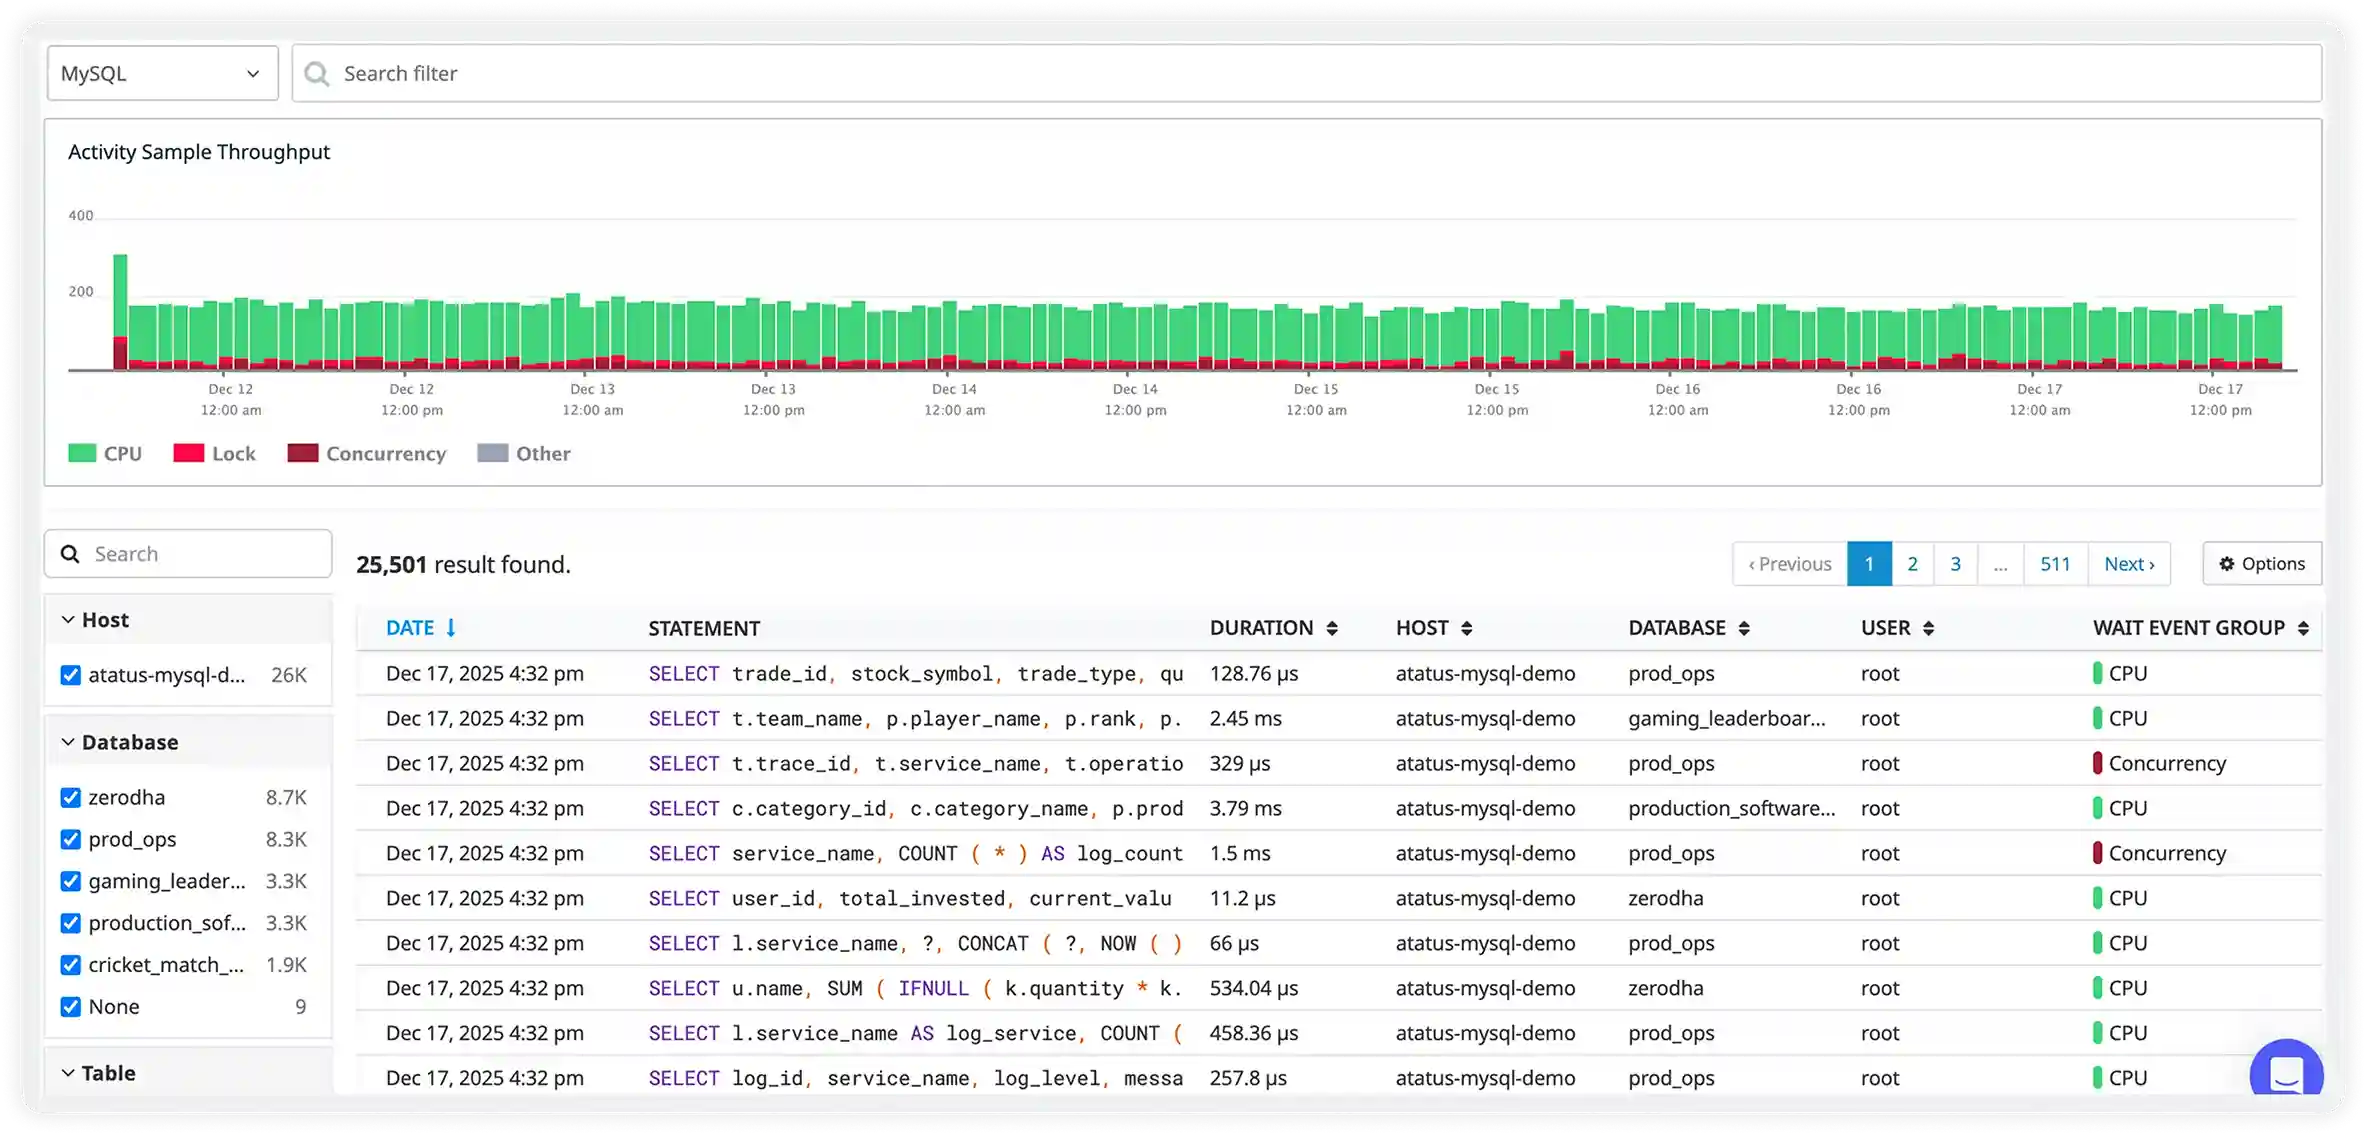
Live Command Stream
- Capture executed Redis commands in real time along with client context and execution timing for complete production visibility.
- Instantly surface long-running, blocked, or stalled commands that create latency and processing backlogs.
- Filter command activity by type, database, or client source to quickly isolate performance issues.
- Understand real production command behavior across instances to optimize workload patterns and capacity planning.
Memory & Data Structure Utilization
- Monitor memory usage across keys, hashes, lists, sets, and sorted sets to understand how Redis data structures consume resources.
- Track key growth trends over time to prevent unbounded memory consumption and eviction pressure.
- Identify large objects or inefficient structures that impact performance and memory efficiency.
- Optimize storage strategies and data modeling for faster operations and improved cache utilization.
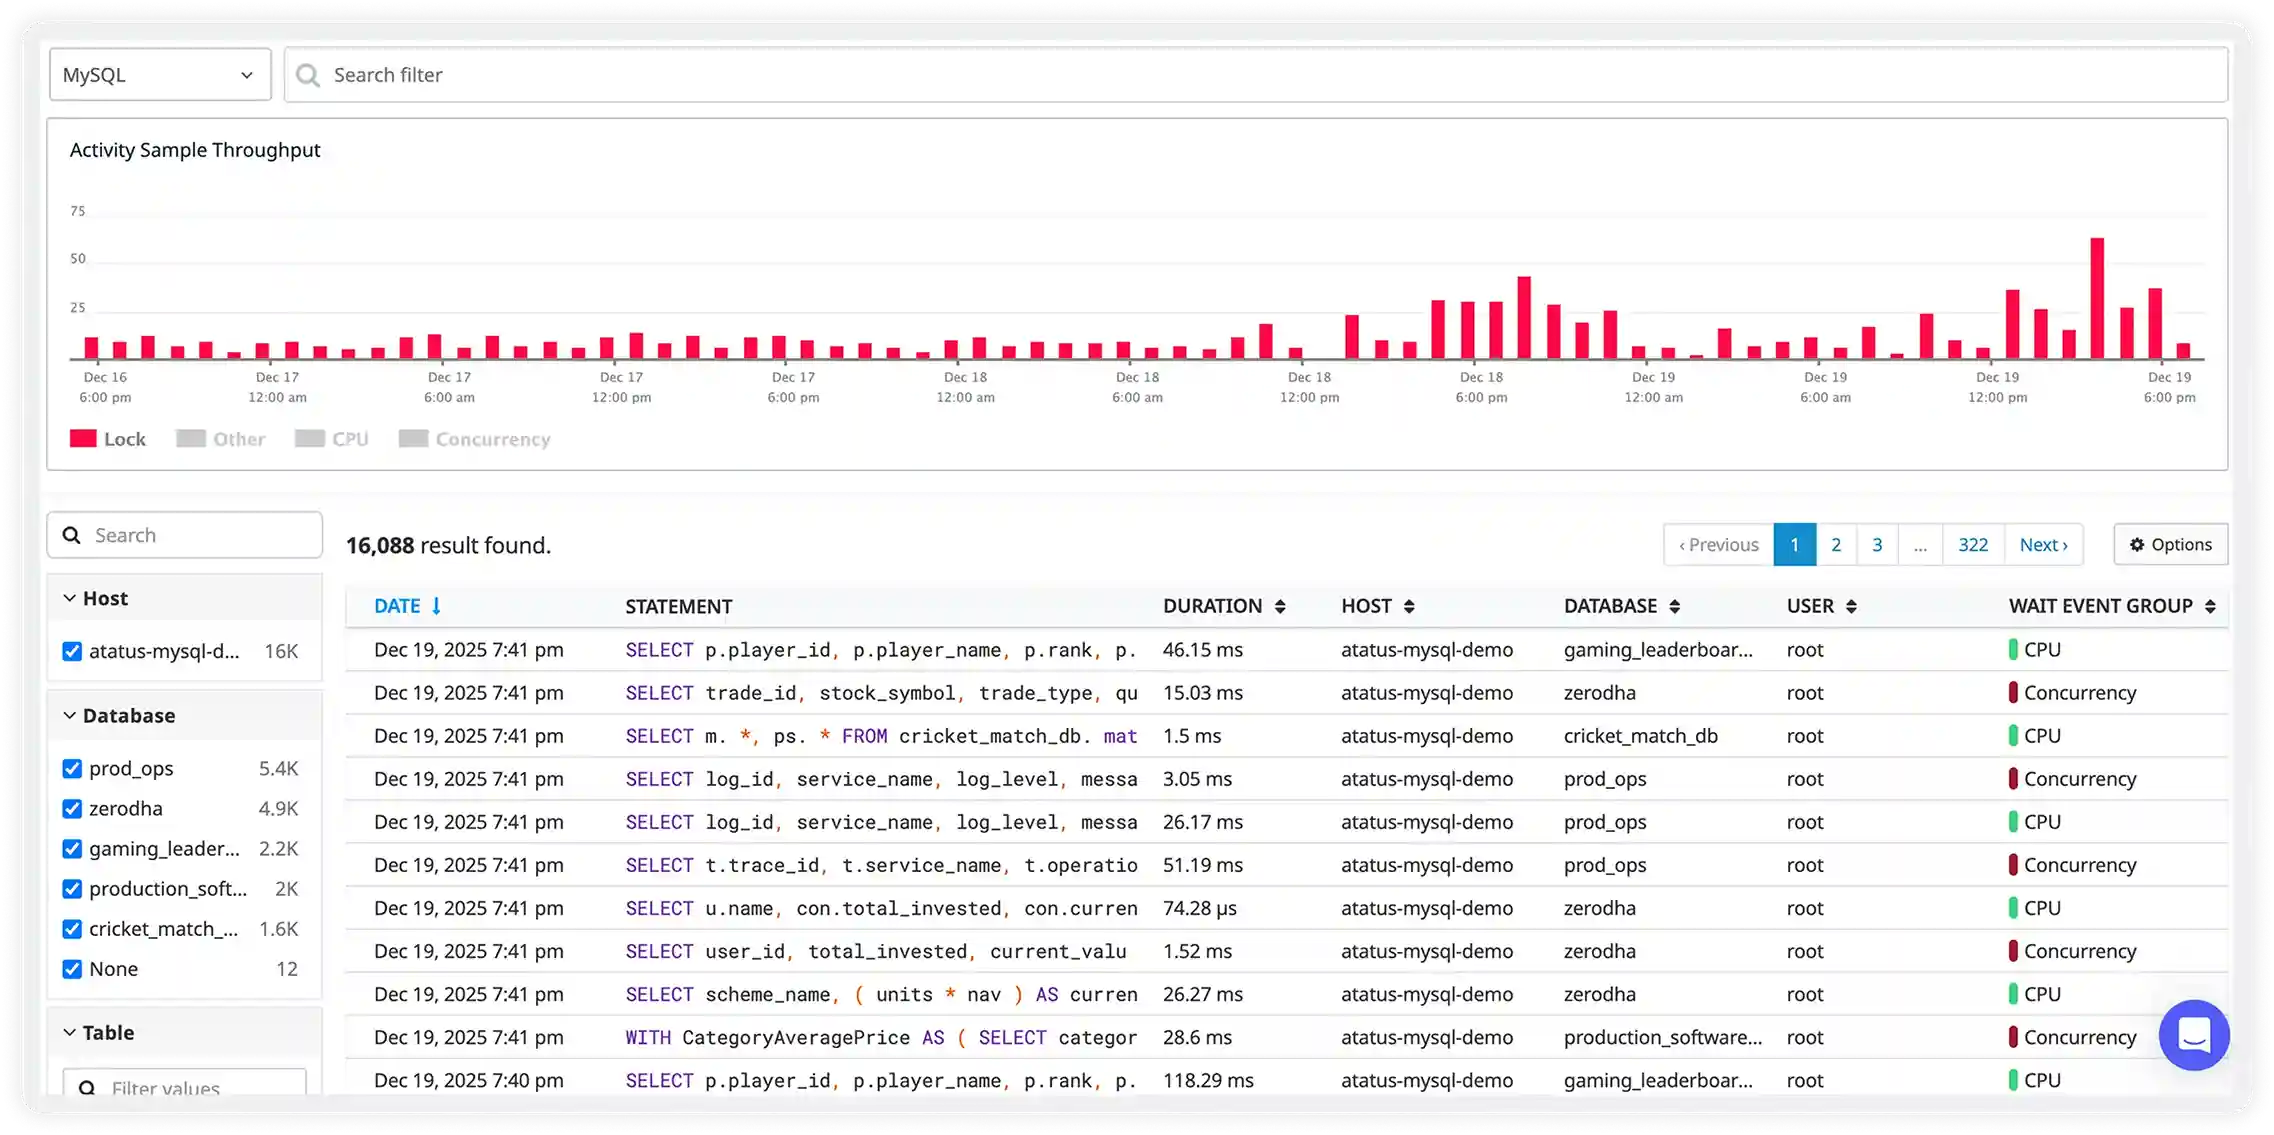
Replication, Connections & Concurrency Flow
- Track replication synchronization health and lag between primary and replica nodes to ensure data consistency.
- Monitor active client connections, blocked clients, and connection churn under high concurrency.
- Identify throughput slowdowns during peak load and heavy traffic periods.
- Maintain high availability and stable performance during failovers and sudden traffic spikes.
Why choose Atatus for Redis database monitoring?
Redis-specific insights
Track command latency, memory allocation behavior, evictions, and persistence operations for accurate visibility.
Single-thread performance clarity
Monitor CPU usage and event loop saturation to uncover command-level bottlenecks.
Replication health visibility
Observe master-replica sync progress and replication offset drift to maintain consistency.
Memory pressure detection
Track fragmentation ratios, RSS growth, and eviction frequency to prevent cache instability.
Persistence impact tracking
Correlate RDB snapshots and AOF rewrites with IO spikes and performance drops.
Client behavior monitoring
Analyze connected and blocked clients to understand traffic patterns and access issues.
Unified Observability for Every Engineering Team
Atatus adapts to how engineering teams work across development, operations, and reliability.
Developers
Trace requests, debug errors, and identify performance issues at the code level with clear context.
DevOps
Track deployments, monitor infrastructure impact, and understand how releases affect application stability.
Release Engineer
Measure service health, latency, and error rates to maintain reliability and reduce production risk.