Eliminate SQLite Slowdowns Caused by Locking and Disk Pressure
Detect and resolve sluggish SQLite queries in your requests, along with transaction traces, to gather actionable insights for optimized functionality.
SQLite Database Monitoring
Statement Execution Time
Tracks execution latency of SQL statements within embedded SQLite environments.
File Lock Contention
Monitors database file locking conflicts affecting concurrent read and write access.
Write Amplification
Analyzes journal and WAL file writes impacting disk IO performance.
Database File Growth
Tracks file size growth caused by insert-heavy or append-only workloads.
Error Detection
Surfaces SQLite errors related to corruption and filesystem issues.
Transaction Frequency
Monitors commit frequency affecting durability and synchronization overhead.
Page Cache Usage
Analyzes page cache efficiency impacting read performance.
IO Latency Patterns
Tracks read and write latency originating from filesystem interactions.
Lightweight SQLite Query and I/O Performance Diagnostics
Catch slow local operations, locking issues, and storage pressure as apps scale.
Query Performance & Latency Trends
- Track SQLite query execution time across every application workflow to clearly understand how local database performance behaves during user actions, background processes, and offline operations.
- Identify slow-running operations that impact screen load times, data sync speed, reporting features, and overall application responsiveness.
- Monitor sudden workload spikes caused by background jobs, large data imports, sync cycles, or cache refreshes that place unexpected stress on local storage.
- Validate performance continuously as local databases grow in size to ensure scaling does not introduce query slowdowns or degraded user experience.
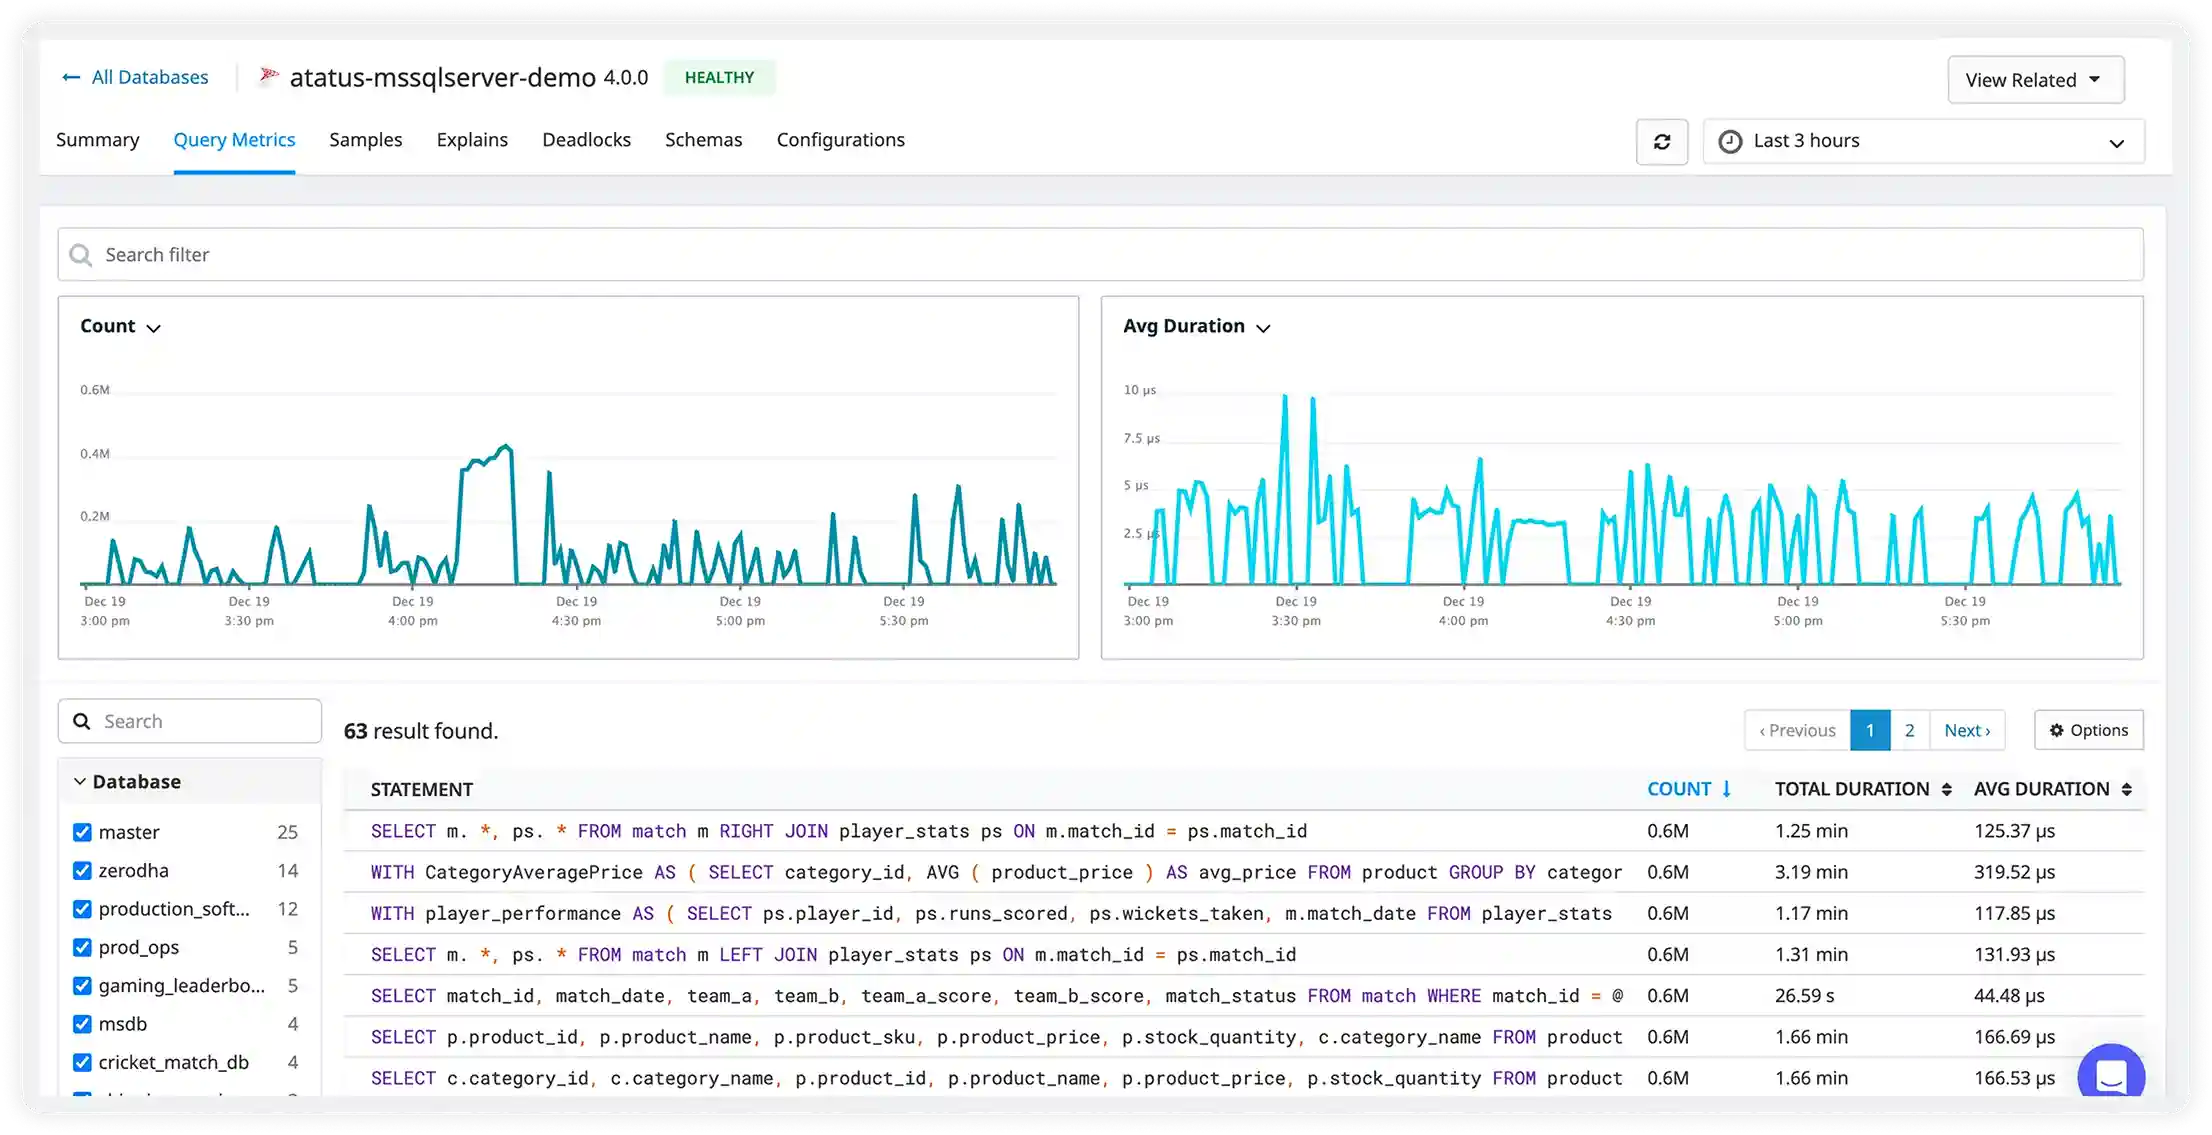
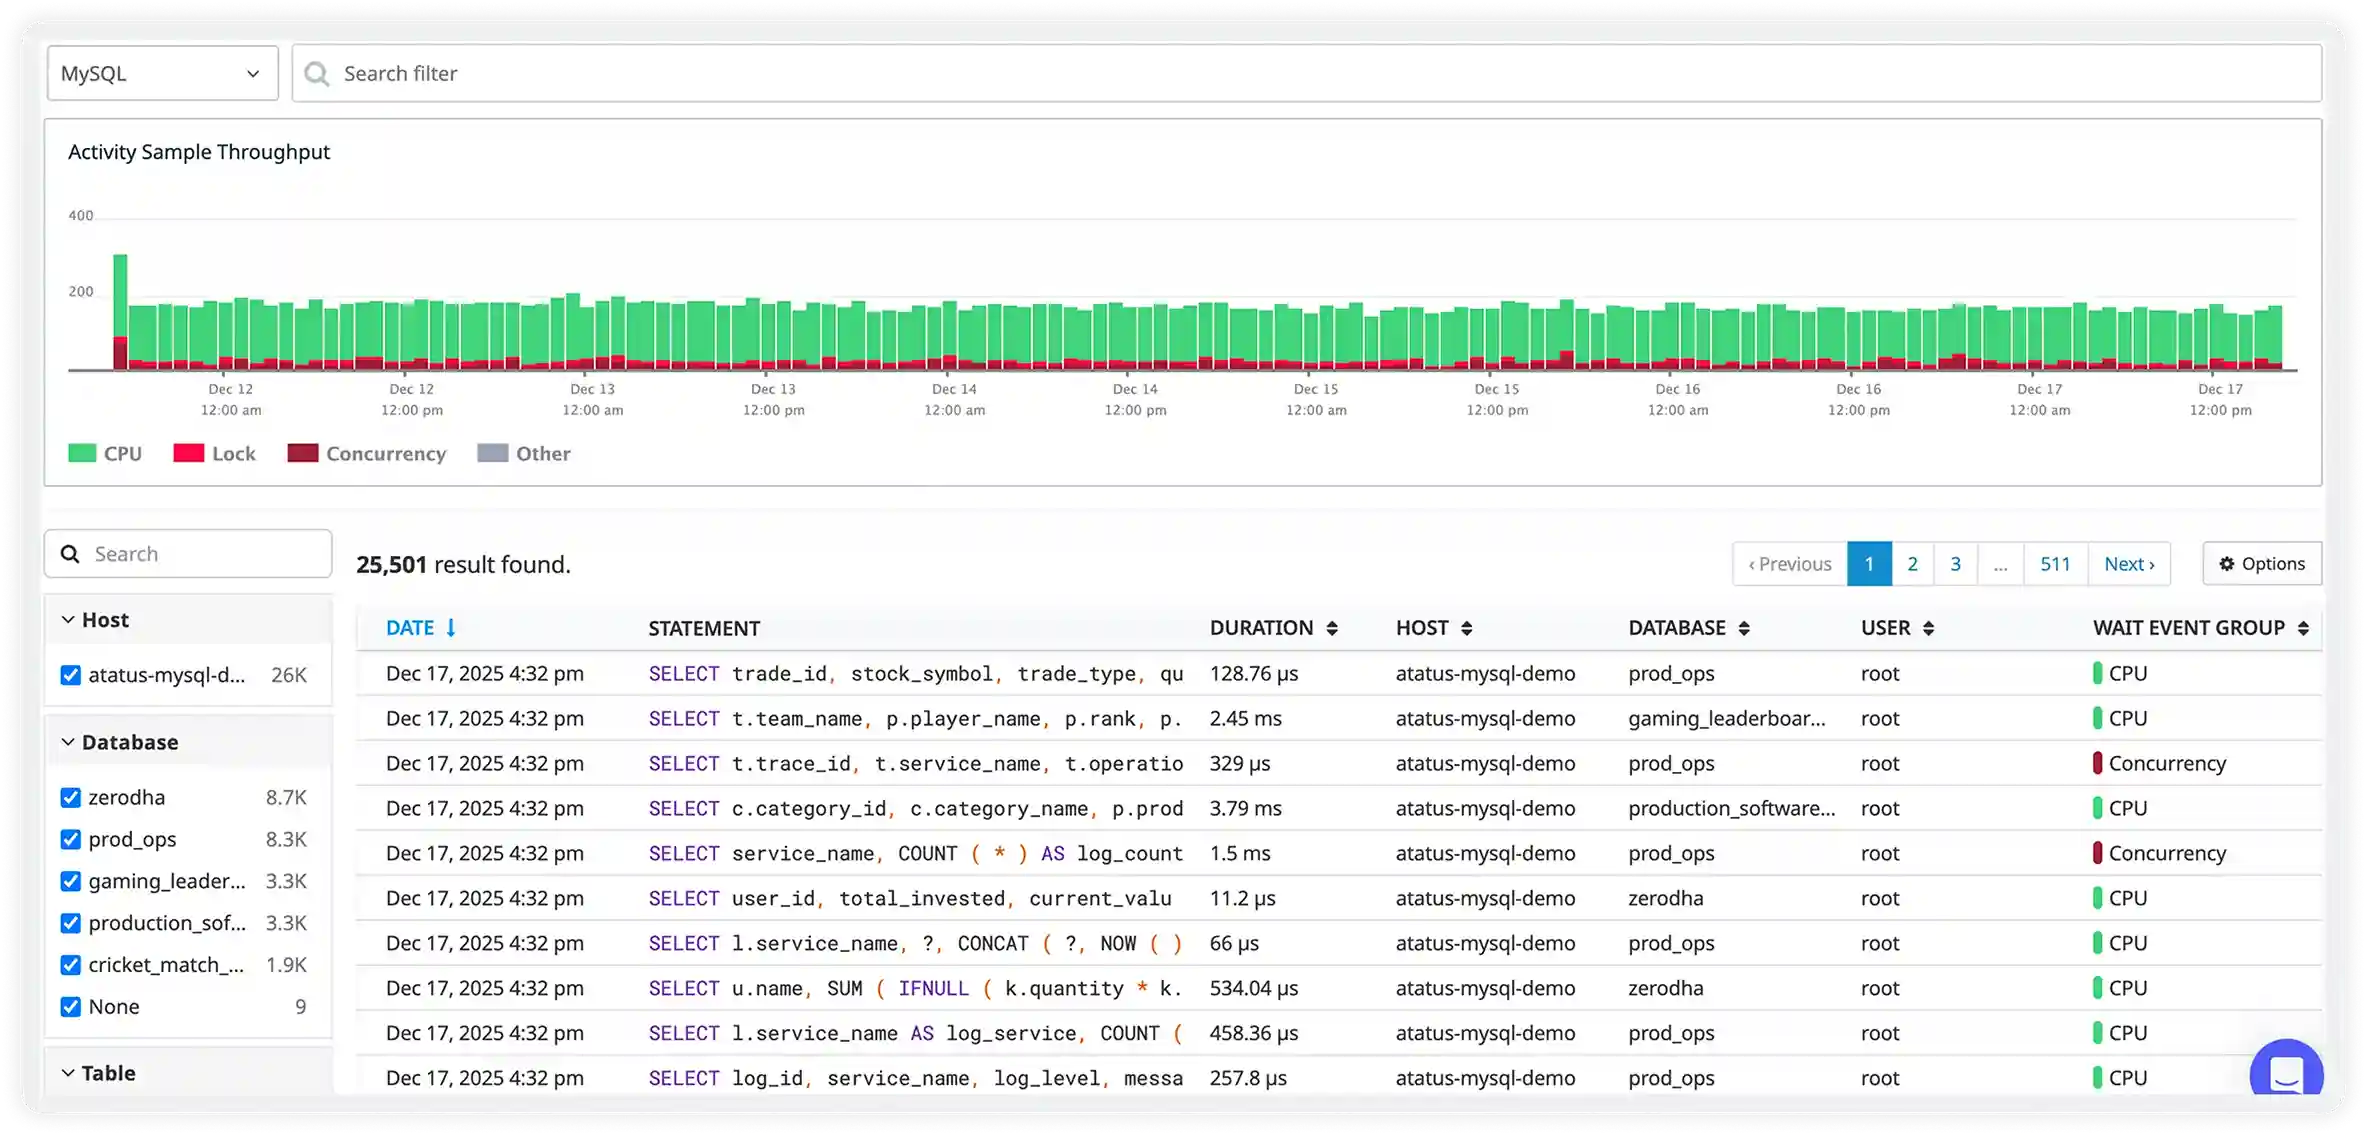
Live SQL Activity & Costly Statements
- Capture every executed SQL query in real time with execution duration, calling module, and feature context to gain deep visibility into how applications interact with SQLite.
- Instantly surface expensive read-heavy reports, write-heavy updates, and batch operations that consume CPU and disk resources.
- Filter queries by frequency, execution time, component, or query type to rapidly isolate inefficient patterns and performance hotspots.
- Understand real production usage trends across application features to optimize critical workflows and prevent recurring slowdowns.
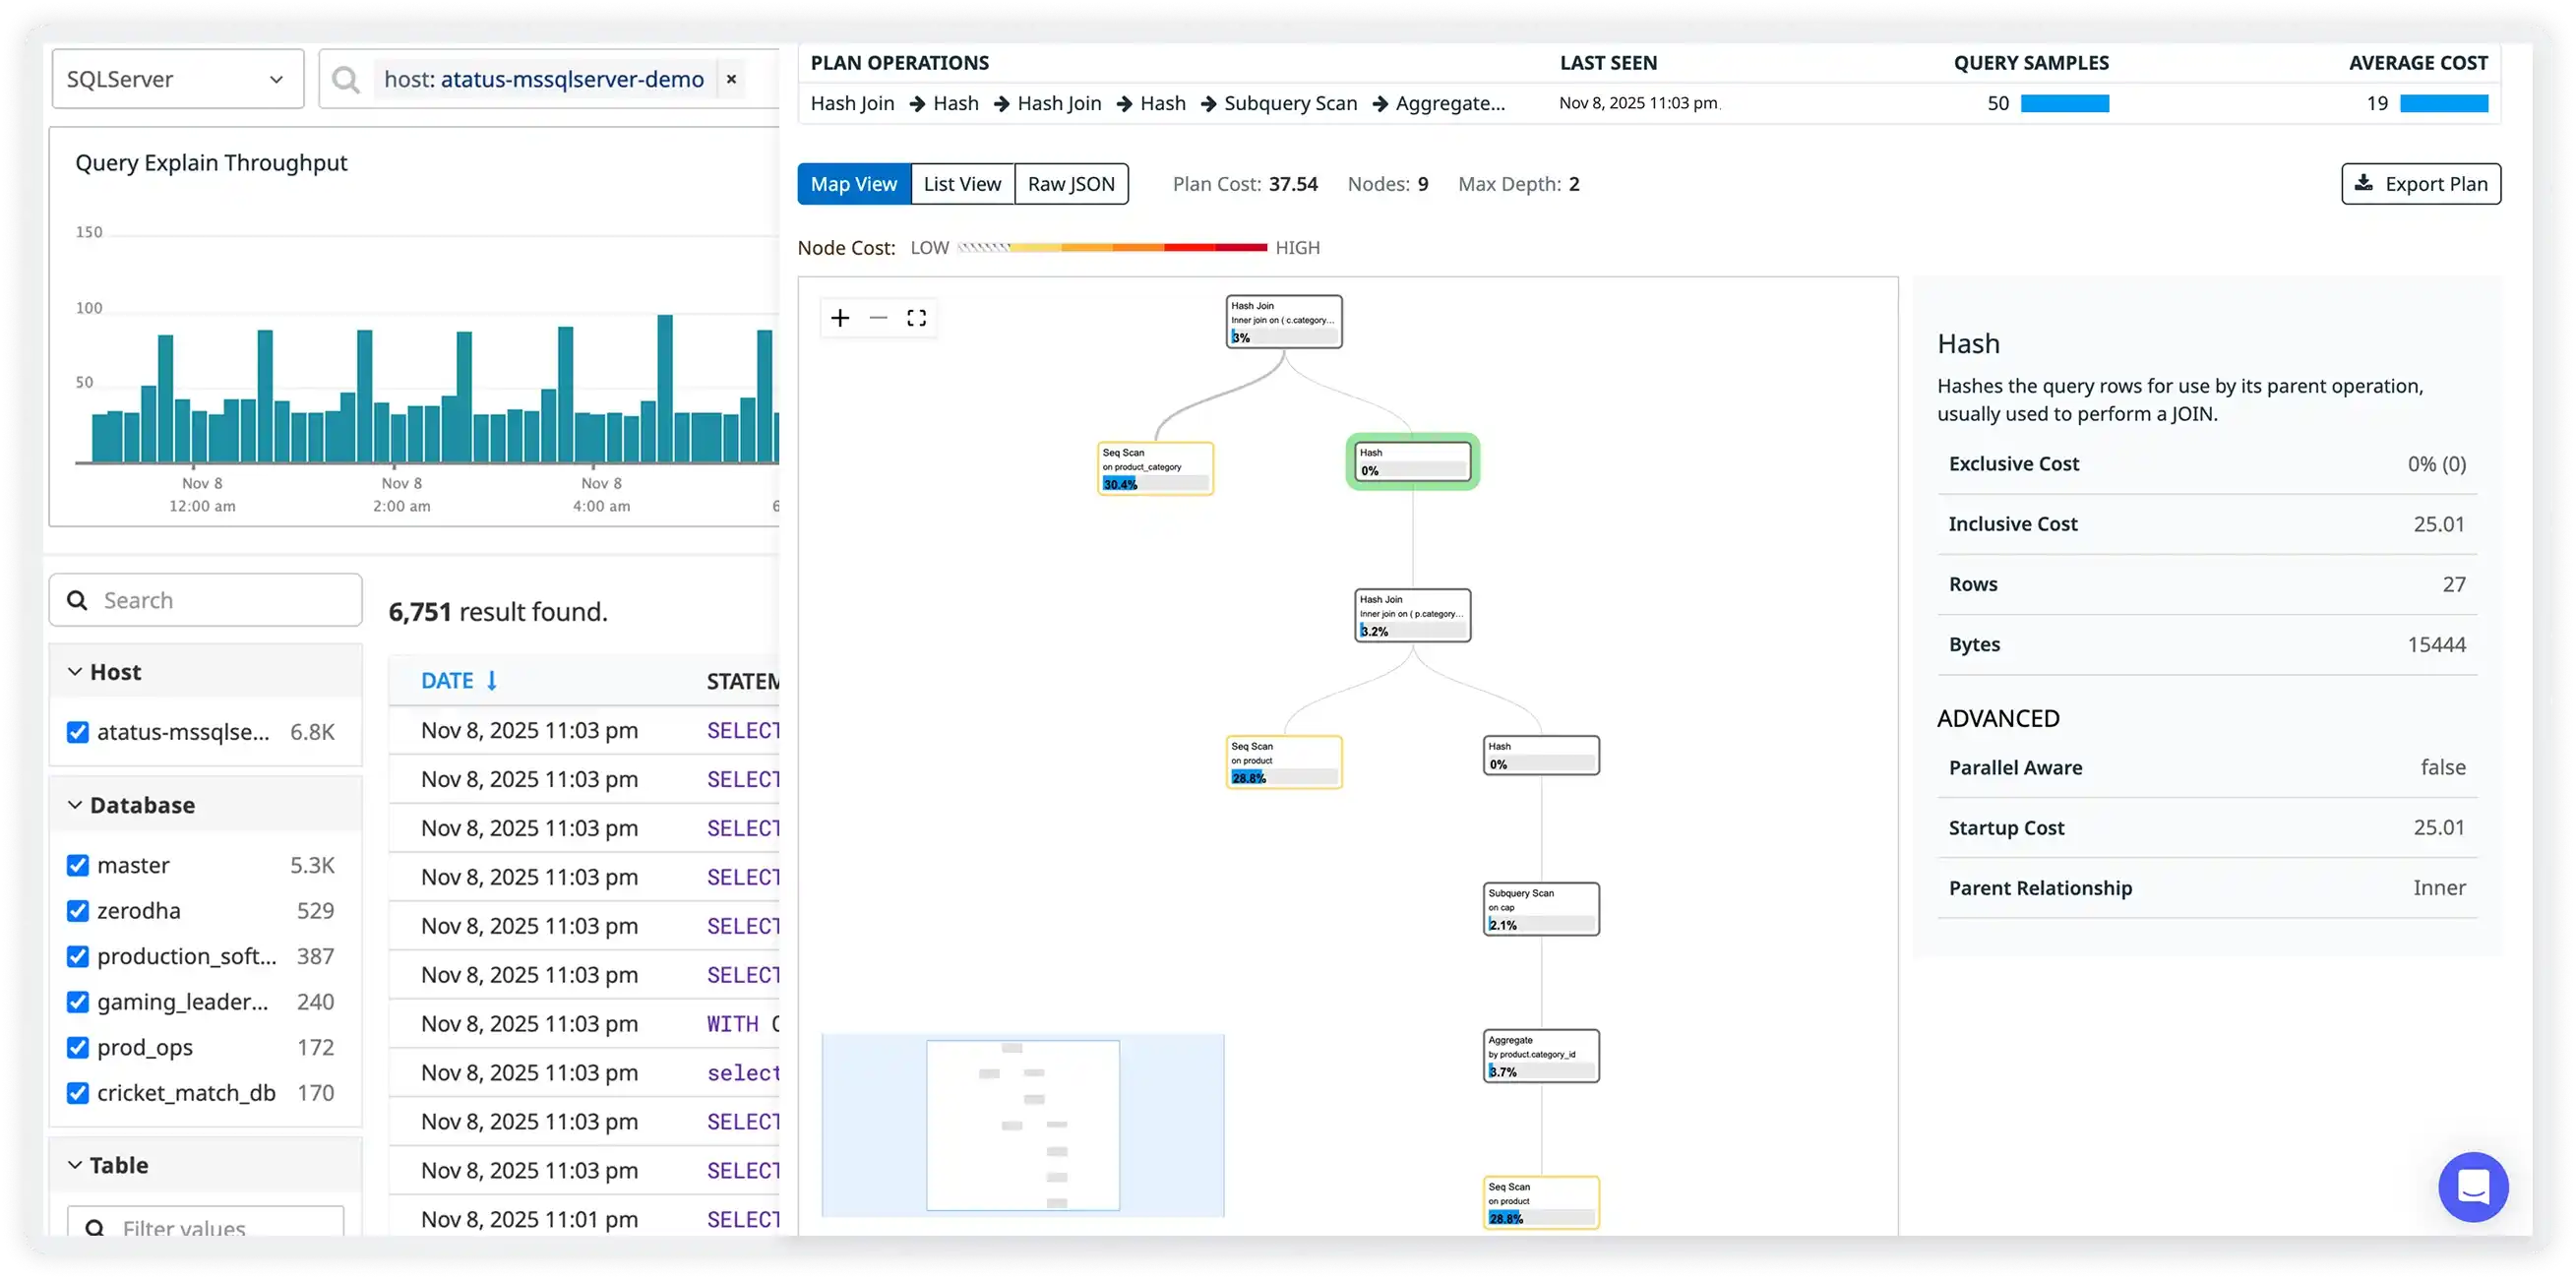
Query Plan & Index Behavior
- Visualize SQLite execution paths in detail to clearly see how queries move through scans, filters, and index lookups during execution.
- Automatically detect full table scans that slow large datasets and create excessive disk access under growing workloads.
- Validate whether existing indexes are actually being used for high-frequency queries and performance-sensitive operations.
- Optimize query structure, indexing strategy, and access patterns to ensure fast and predictable local data retrieval.
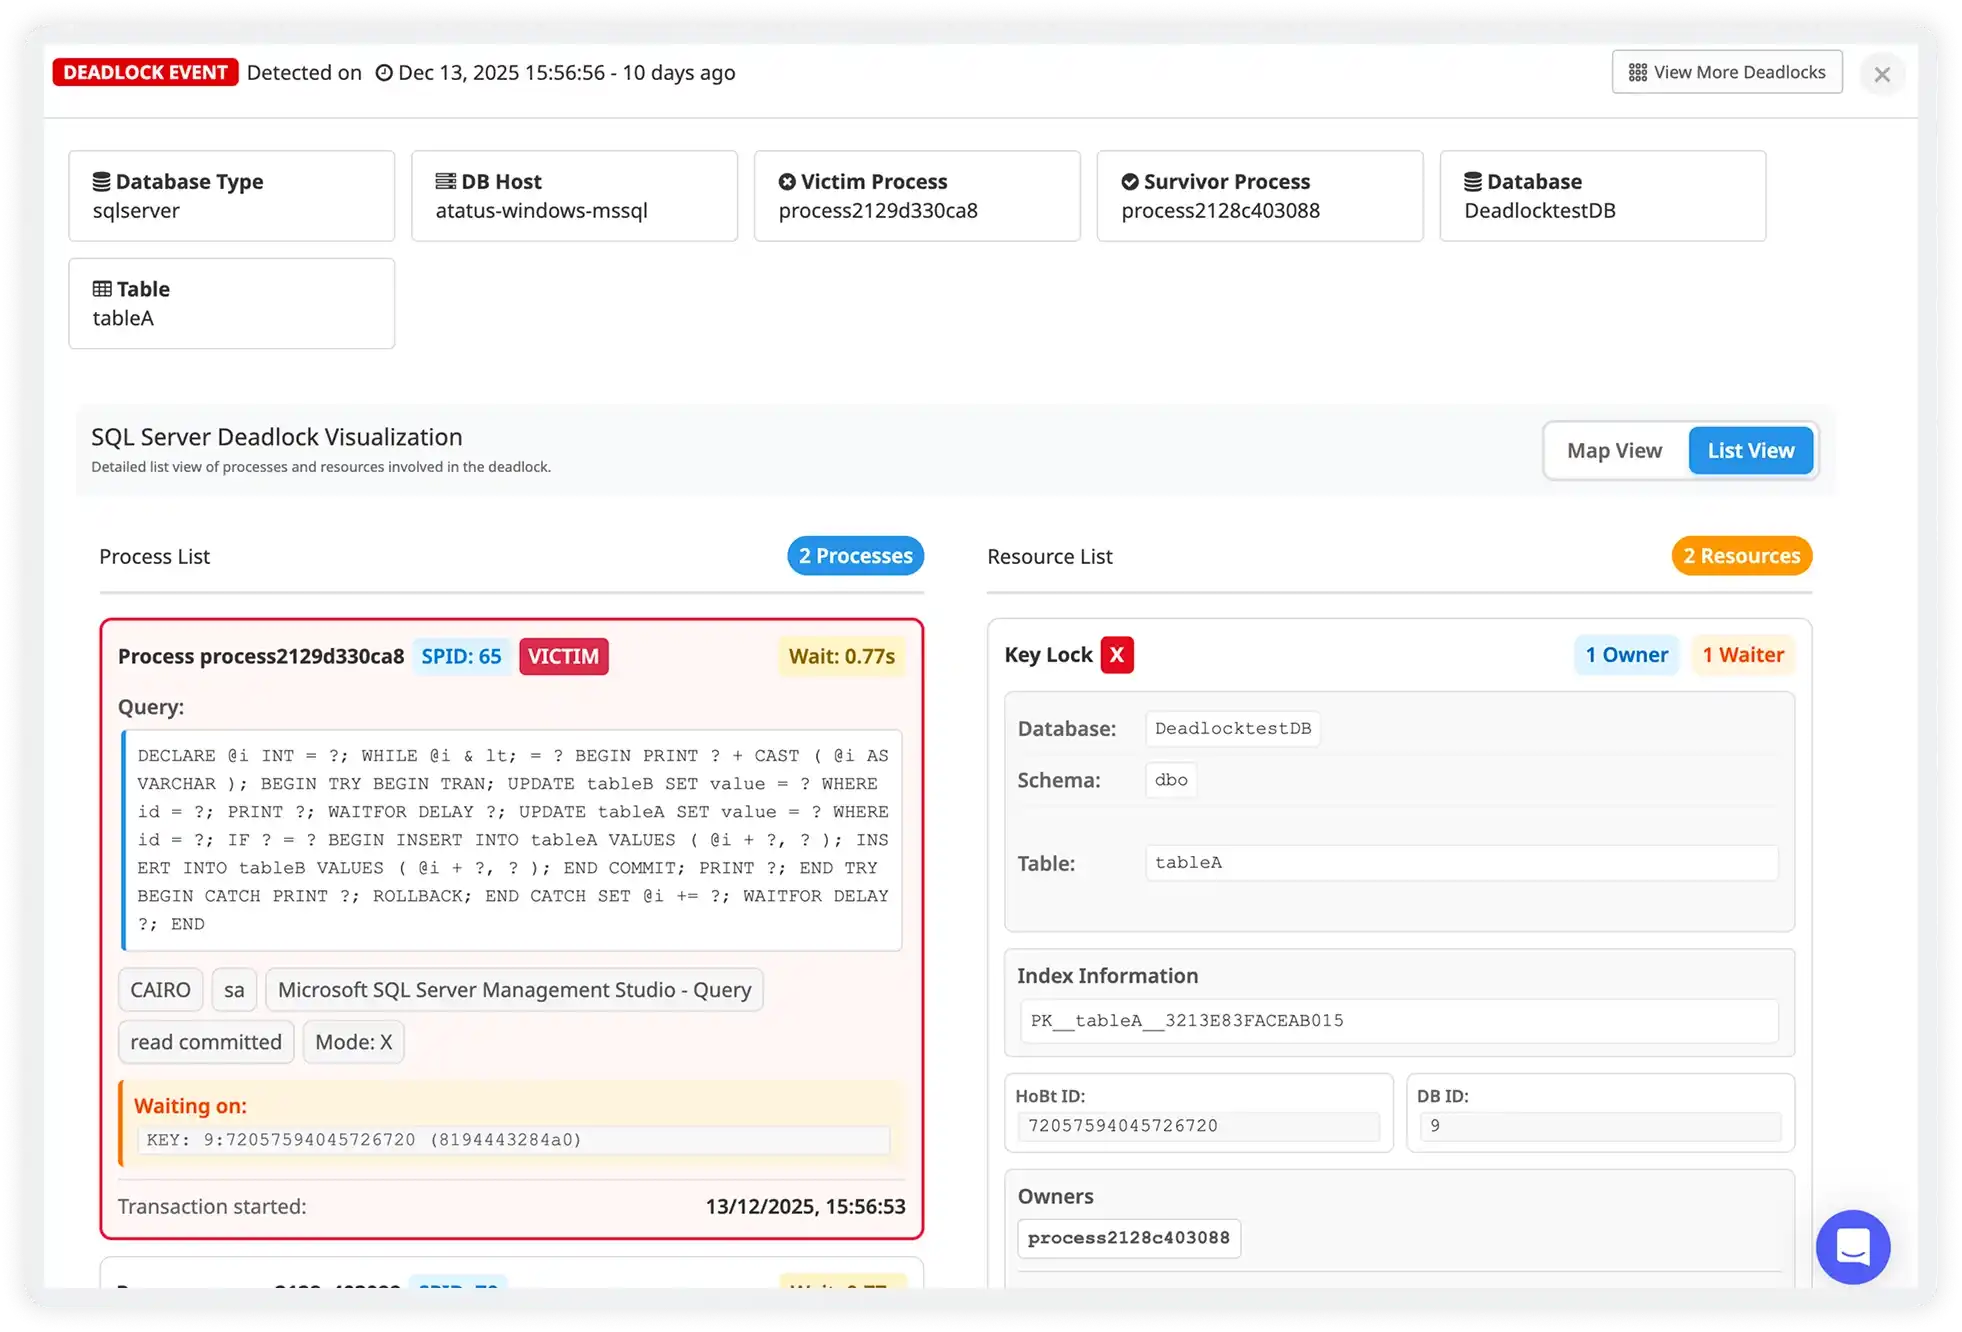
I/O Pressure & File-Level Locking
- Monitor disk read and write activity continuously to understand how storage I/O impacts query speed and application responsiveness.
- Track file-level write locks that block parallel operations and cause visible slowdowns during concurrent access.
- Identify heavy I/O windows during backups, synchronization tasks, exports, or bulk data updates that strain local storage.
- Maintain consistent application performance by reducing lock contention, smoothing disk workloads, and optimizing access frequency.
Why choose Atatus for SQLite database monitoring?
Embedded database observability
Atatus brings production-grade visibility into SQLite inside applications where traditional tools fall short.
File-based locking insights
Atatus exposes database file lock contention to prevent concurrency slowdowns.
Write amplification awareness
Atatus tracks journal and WAL activity to reduce disk IO overhead and improve performance.
Transaction behavior monitoring
Atatus analyzes commit patterns and transaction duration to balance durability and speed.
Corruption and error detection
Atatus captures SQLite filesystem errors early to protect data integrity.
Disk interaction visibility
Atatus correlates filesystem latency with SQLite operations to pinpoint performance bottlenecks faster.
Unified Observability for Every Engineering Team
Atatus adapts to how engineering teams work across development, operations, and reliability.
Developers
Trace requests, debug errors, and identify performance issues at the code level with clear context.
DevOps
Track deployments, monitor infrastructure impact, and understand how releases affect application stability.
Release Engineer
Measure service health, latency, and error rates to maintain reliability and reduce production risk.