Kubernetes Monitoring
Gain comprehensive insights into your Kubernetes cluster, highlighting strategies to optimize resource utilization across workloads, leading to improved management and efficiency of your Kubernetes setup.
Kubernetes Management Challenges
Without comprehensive Kubernetes monitoring, teams face these critical orchestration challenges:
Pod Crashes and Restarts
Kubernetes pods constantly crashing and restarting without clear visibility into why they're failing or what's causing OOMKills.
"As a Kubernetes admin, pods keep restarting in production, but I don't know if it's memory limits, liveness probes, or application bugs."
Resource Limits Causing Throttling
Applications performing poorly because of CPU throttling or memory limits, but no insights into actual resource usage patterns.
"As a platform engineer, our apps are slow because of CPU throttling, but I don't know the right resource limits to set."
Multi-Cluster Chaos
Managing multiple Kubernetes clusters across different environments and regions without unified monitoring is overwhelming.
"As a DevOps lead, we run 5 K8s clusters across dev, staging, and prod, and monitoring each separately is a nightmare."
Failed Deployments
Kubernetes deployments failing silently or rolling out problematic changes without proper monitoring and rollback capabilities.
"As a release manager, deployments sometimes fail halfway, leaving us in a broken state, and we find out too late."
No Cost Visibility
Kubernetes workloads consuming excessive cloud resources with no visibility into which namespaces, pods, or teams are driving costs.
"As a FinOps manager, our K8s costs are $50K/month, but we can't attribute costs to teams or optimize resource allocation."
Ingress and Service Mesh Complexity
Traffic routing issues, ingress controller problems, and service mesh misconfigurations causing intermittent failures that are difficult to diagnose.
"As a network engineer, requests randomly fail due to ingress rules or service mesh policies, but I have no visibility into the traffic flow to debug it."
Kubernetes Monitoring
Simplified
Enterprise-grade K8s observability without the complexity. Monitor clusters, optimize costs, and ensure reliability.
Complete Cluster Visibility
Monitor your entire Kubernetes infrastructure from nodes to pods and containers. Track resource utilization, health status, and performance metrics across all clusters.
Pod & Container Insights
Deep visibility into pod lifecycles, container restarts, and resource consumption. Quickly identify and resolve issues affecting your workloads.
Service Mesh Observability
Track service-to-service communication, network latency, and traffic patterns. Optimize microservices performance with distributed tracing across your cluster.
How Atatus Kubernetes Monitoring Simplifies Container Orchestration
Gain complete cluster visibility with measurable improvements in stability and resource efficiency
Prevent Pod Failures
Monitor pod health, restart reasons, OOMKills, and crash loops. Get alerted before failures impact users with smart anomaly detection.
Optimize Resource Limits
Data-driven recommendations for CPU and memory limits based on actual usage patterns. Eliminate throttling and over-provisioning.
Unified Multi-Cluster View
Monitor all Kubernetes clusters from one dashboard. Compare metrics, track deployments, and manage alerts centrally.
Safe Deployment Tracking
Monitor deployments in real-time, track rollout status, and get instant alerts on deployment failures. Rollback with confidence.
Kubernetes Cost Optimization
Track costs by namespace, team, and workload. Identify cost-intensive pods and optimize resource allocation to reduce cloud spend.
Complete Cluster Observability
Monitor nodes, pods, containers, services, ingress, and persistent volumes. Full visibility into every layer of your K8s stack.
Complete Visibility
Across Your Kubernetes Environment
Unified visibility into cluster health, workloads, logs, and traces to keep Kubernetes stable and efficient.
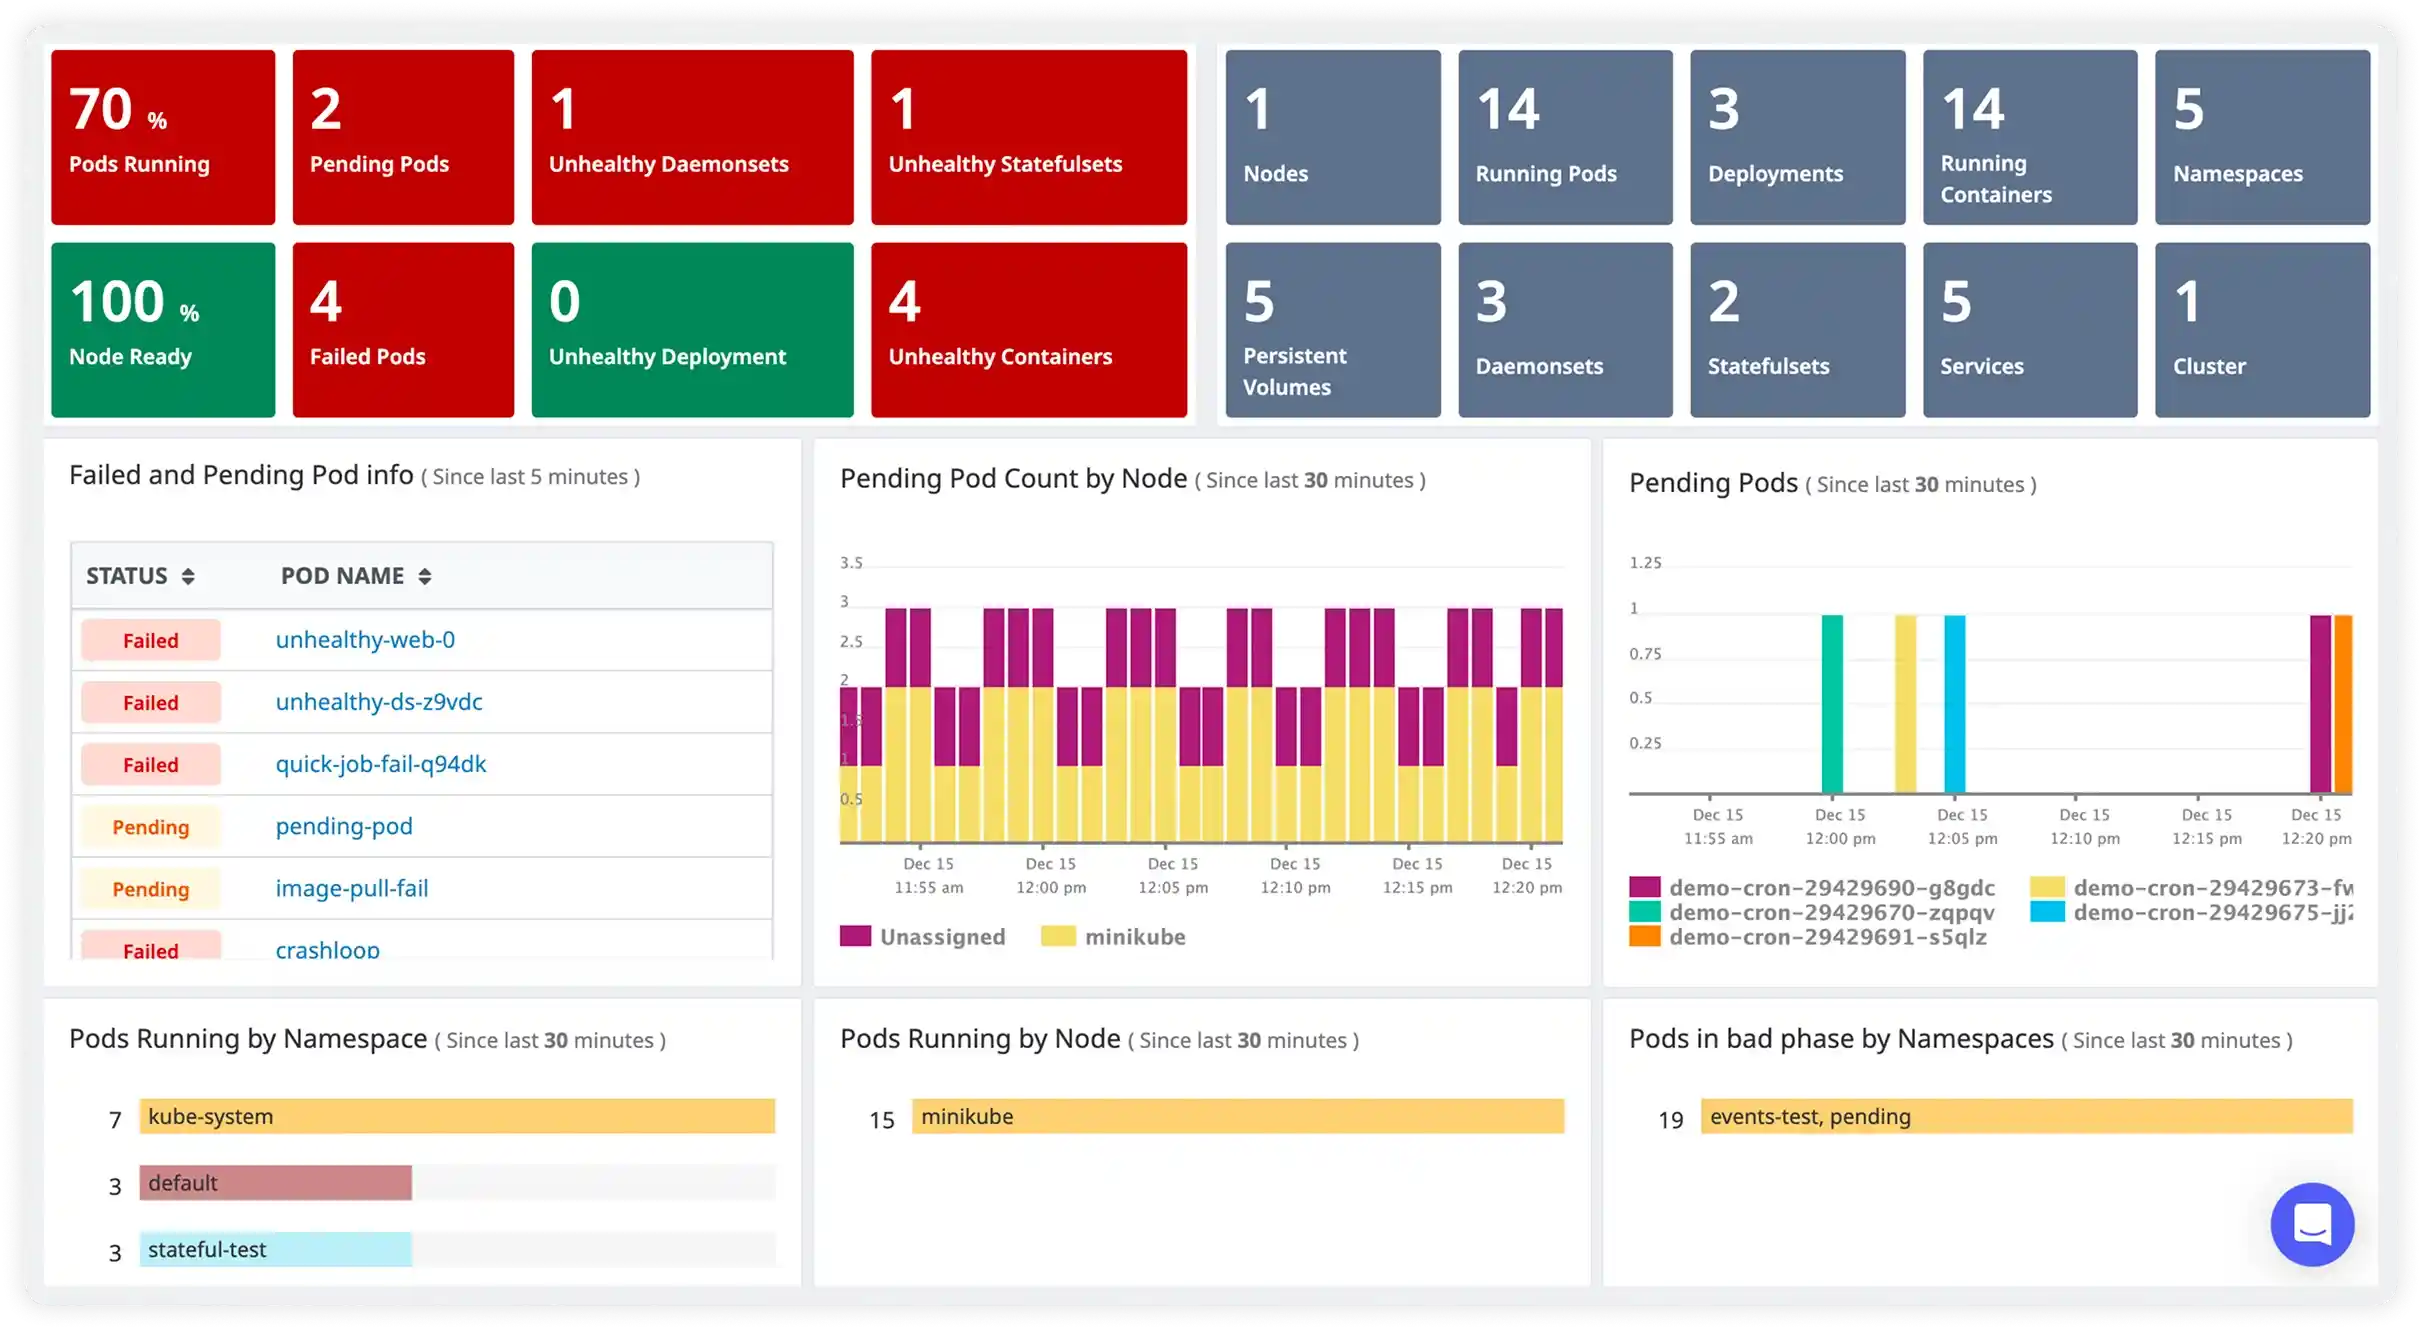
Cluster Health and Resource Utilization
- Monitor overall cluster health with real-time visibility into node and pod status
- Track CPU, memory, and resource usage across nodes to understand capacity trends
- Identify resource pressure early to avoid performance degradation
- Optimize resource allocation to keep clusters stable as workloads scale
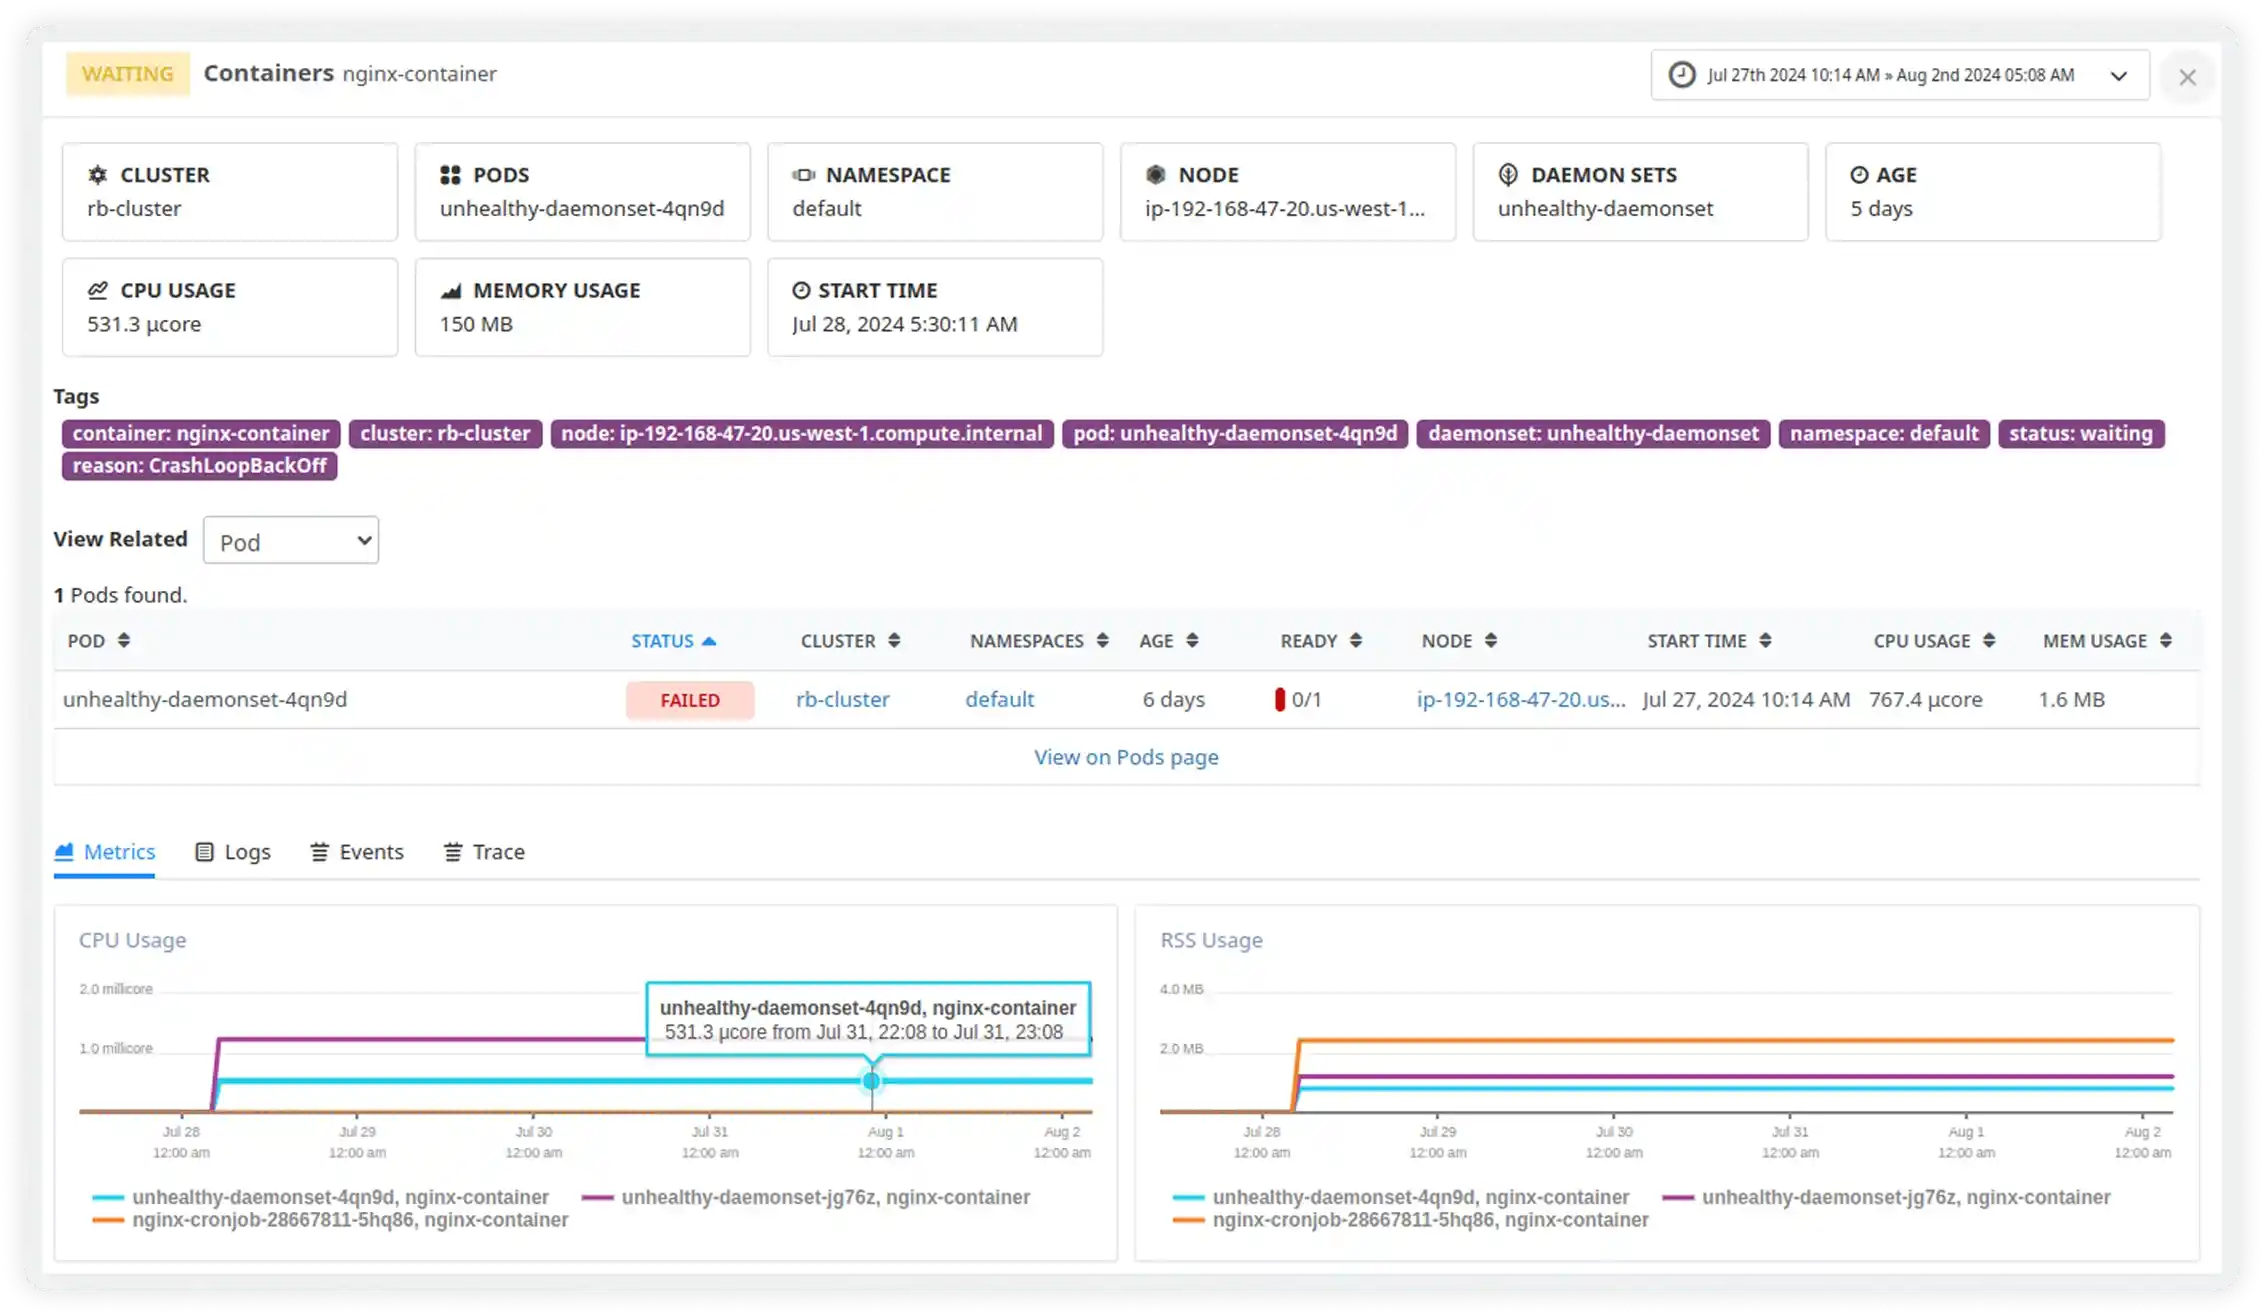
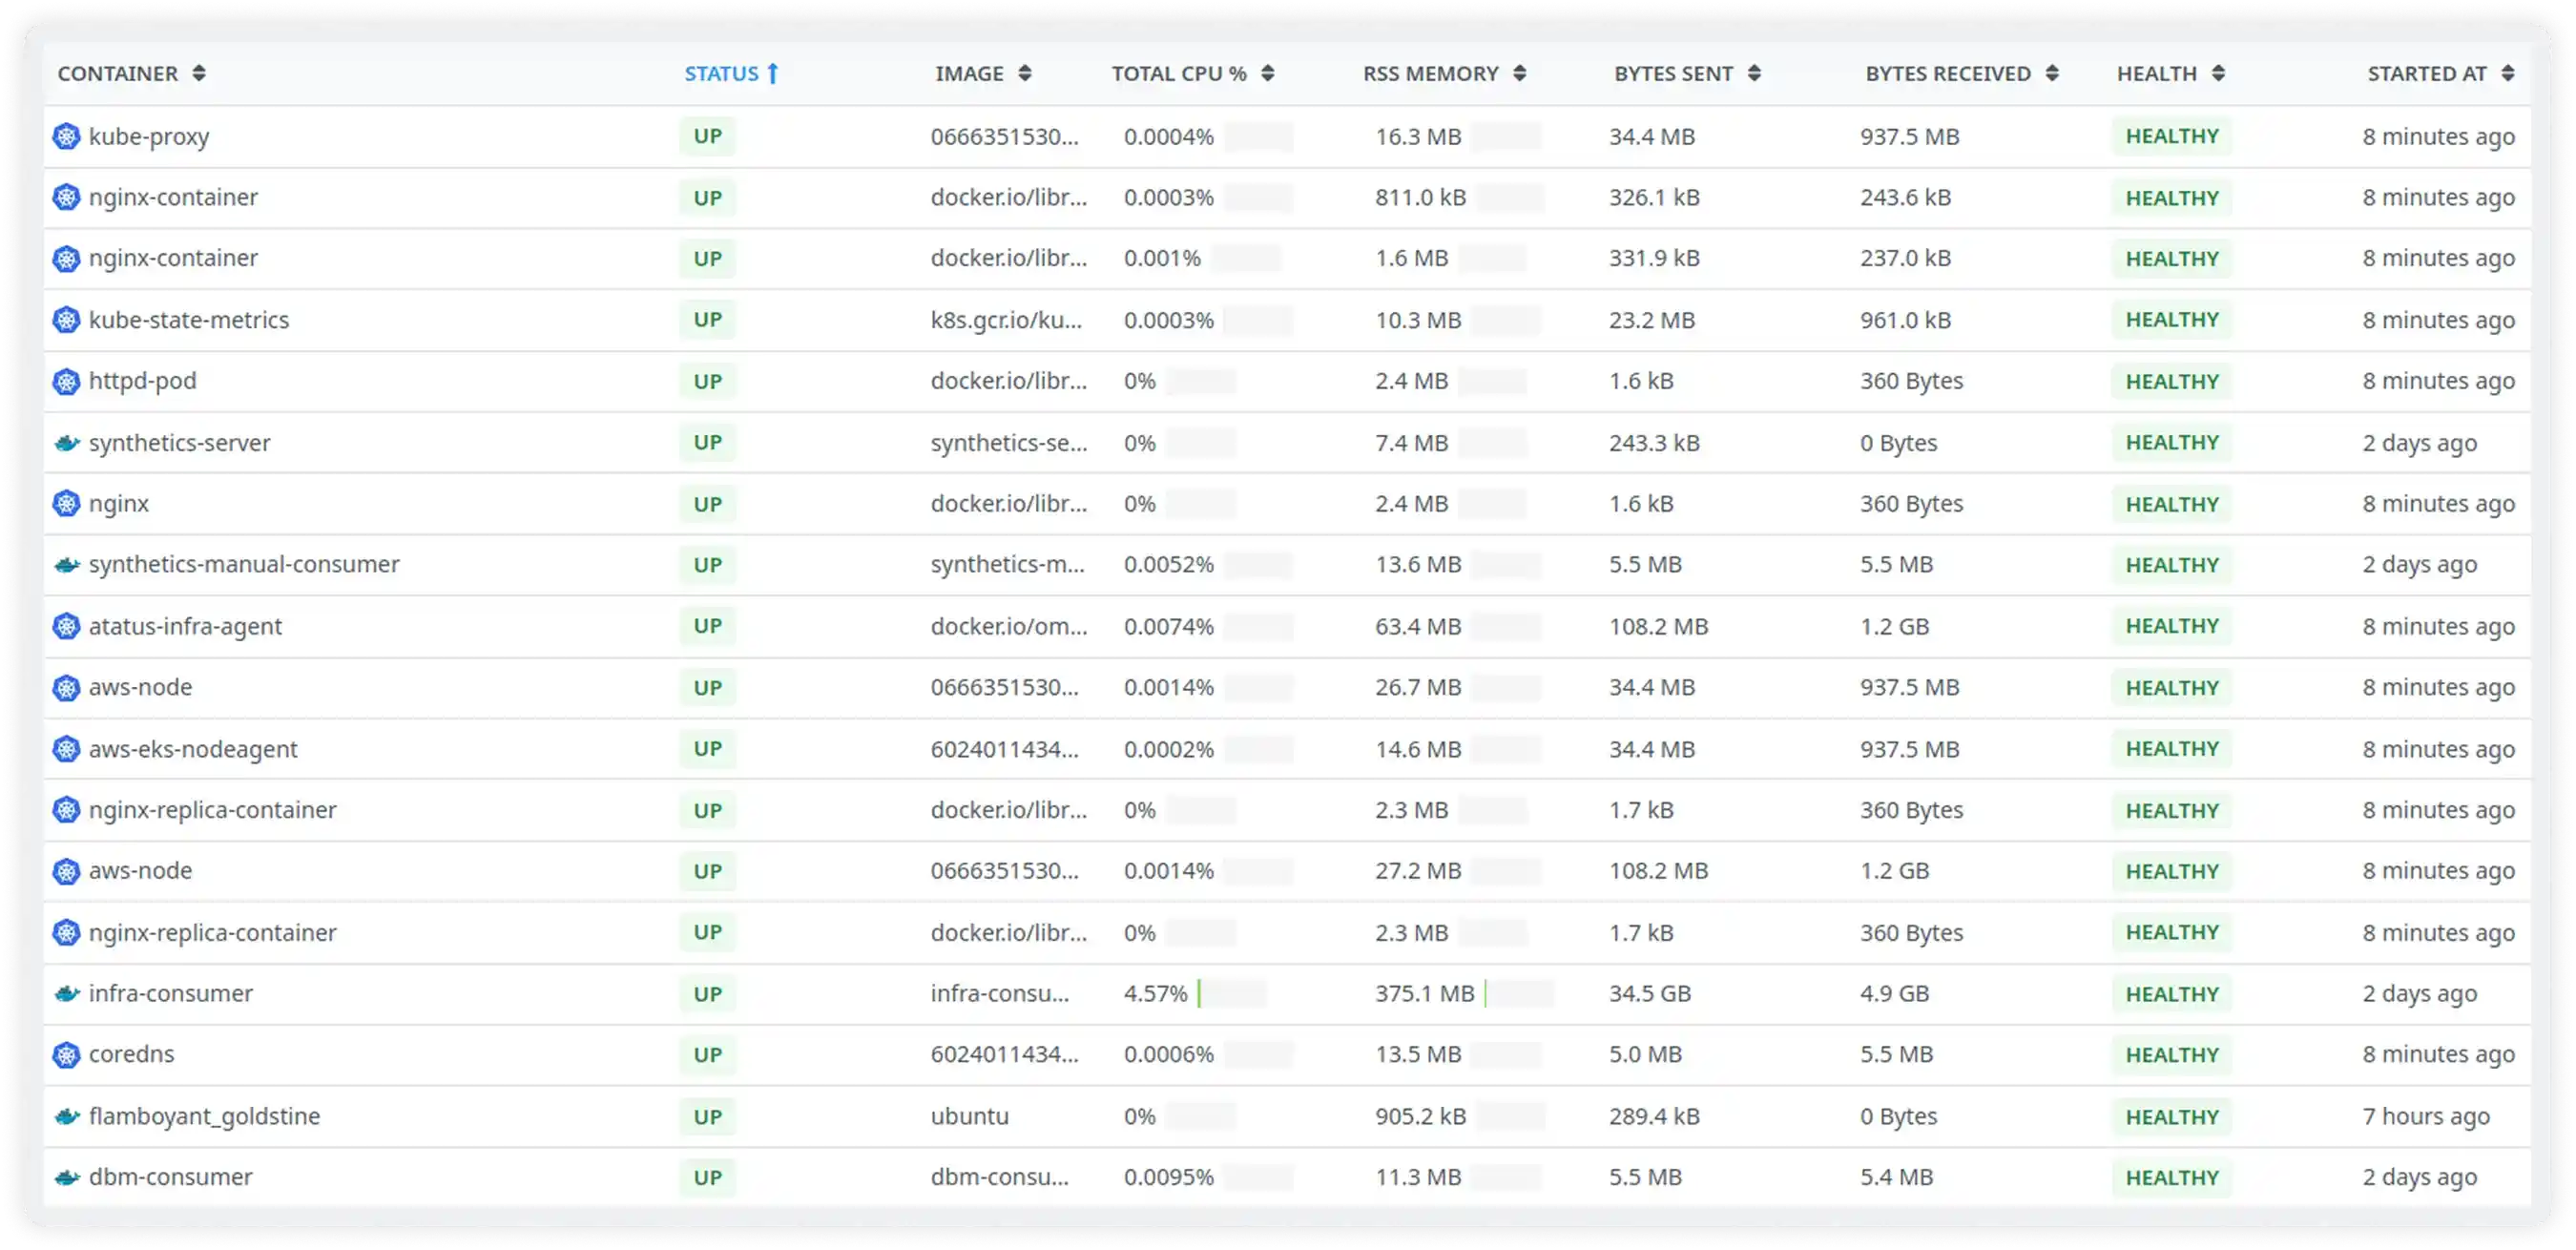
Pod, Container, and Workload Metrics
- Track pod and container readiness to ensure workloads run as expected
- Monitor restarts, failures, and lifecycle events to spot unstable components
- Analyze resource usage at the workload level to reduce inefficiencies
- Understand how individual components impact overall cluster performance
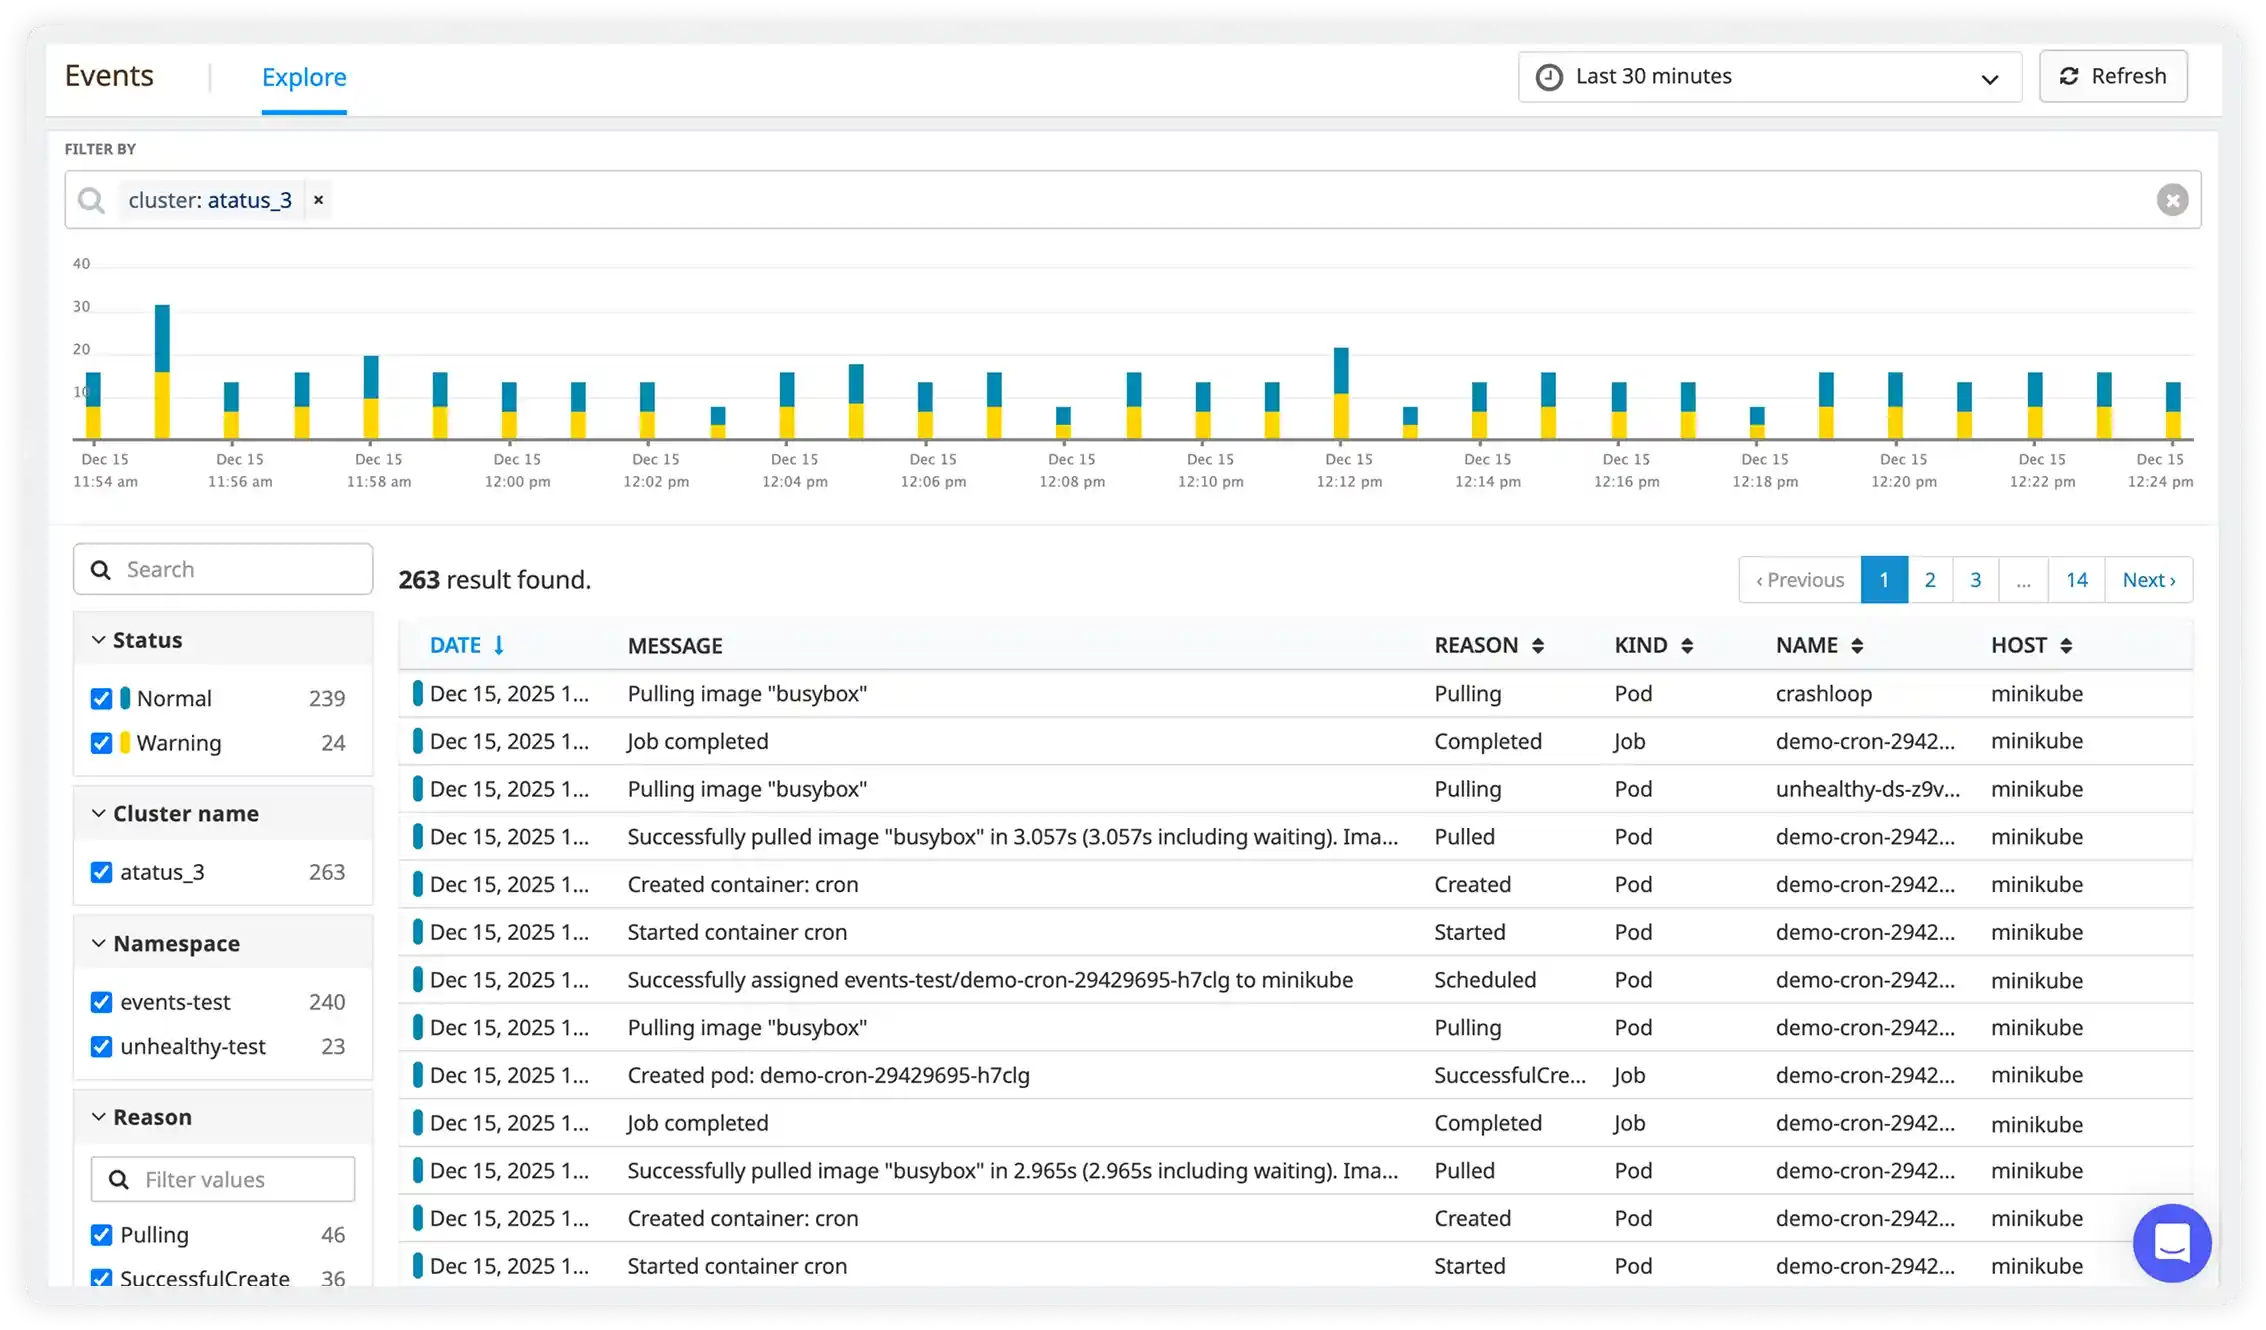
Logs, Events, and Tracing for Fast Troubleshooting
- Collect logs and Kubernetes events from nodes and containers in one place
- Correlate runtime events with traces for better issue context.
- Pinpoint failure patterns across services and workloads quickly.
- Reduce investigation time with connected logs, events, and trace data.
K8s Monitoring in Under 5 Minutes
Three simple steps to complete observability. No credit card required.
Deploy the Agent
Install Atatus K8s agent via Helm chart or YAML manifests. Auto-discovers all clusters, nodes, pods, and services within minutes.
Auto-Collect K8s Metrics
Automatically captures cluster health, pod metrics, container logs, and Kubernetes events without manual configuration.
Monitor & Optimize Clusters
Access real-time K8s dashboards. Optimize resource usage, troubleshoot pod issues, and reduce cloud costs with actionable insights.
Milestones that spark performance excellence
Reflections from clients who've achieved unmatched excellence through innovative strategies.
Read customer stories


