Log Management & Observability
Simplify your log monitoring to effortlessly track and analyze events, enabling quick troubleshooting and performance insights. Experience real-time visibility, instant search capabilities, and informed decision-making without the complexities or high costs.
Log Management Challenges
Without centralized log management, teams face these critical observability gaps:
Logs Scattered Across Systems
Application logs, server logs, and container logs stored in different places. Troubleshooting requires checking multiple systems.
"As a DevOps engineer, when debugging an issue, I have to check 5 different logging systems. It takes forever to correlate logs from different sources."
Slow Log Search
Searching through millions of log entries takes minutes or crashes the system. Can't find relevant logs quickly during critical incidents.
"As an SRE, during a production incident, I can't search logs fast enough to find the root cause before customers are impacted."
No Log Context
Logs don't correlate with traces or metrics, making it hard to understand the full context of what happened during an error.
"As a backend developer, I see errors in logs but have no idea which request or user was affected because logs aren't correlated with traces."
Log Storage Costs
Log storage costs skyrocketing due to retention of unnecessary logs. No way to intelligently manage log data or set retention policies.
"As a FinOps manager, we're spending $20K/month on log storage, but 80% of the logs are never accessed and could be deleted."
Missing Critical Logs
Important error logs and debugging information missing during critical troubleshooting because log collection isn't comprehensive.
"As a developer, the one log message I need to debug a production issue is always missing because our log collection is incomplete."
Log Format Inconsistencies
Different services logging in different formats (JSON, plain text, custom formats) making it nearly impossible to parse and analyze logs consistently.
"As a platform engineer, parsing logs from 20 different services requires writing custom parsers for each one because every team uses a different log format."
Turn Logs Into
Operational Intelligence
Go beyond storing and searching logs. Transform high volume log data into insights your engineering, SRE, and support teams can act on immediately.
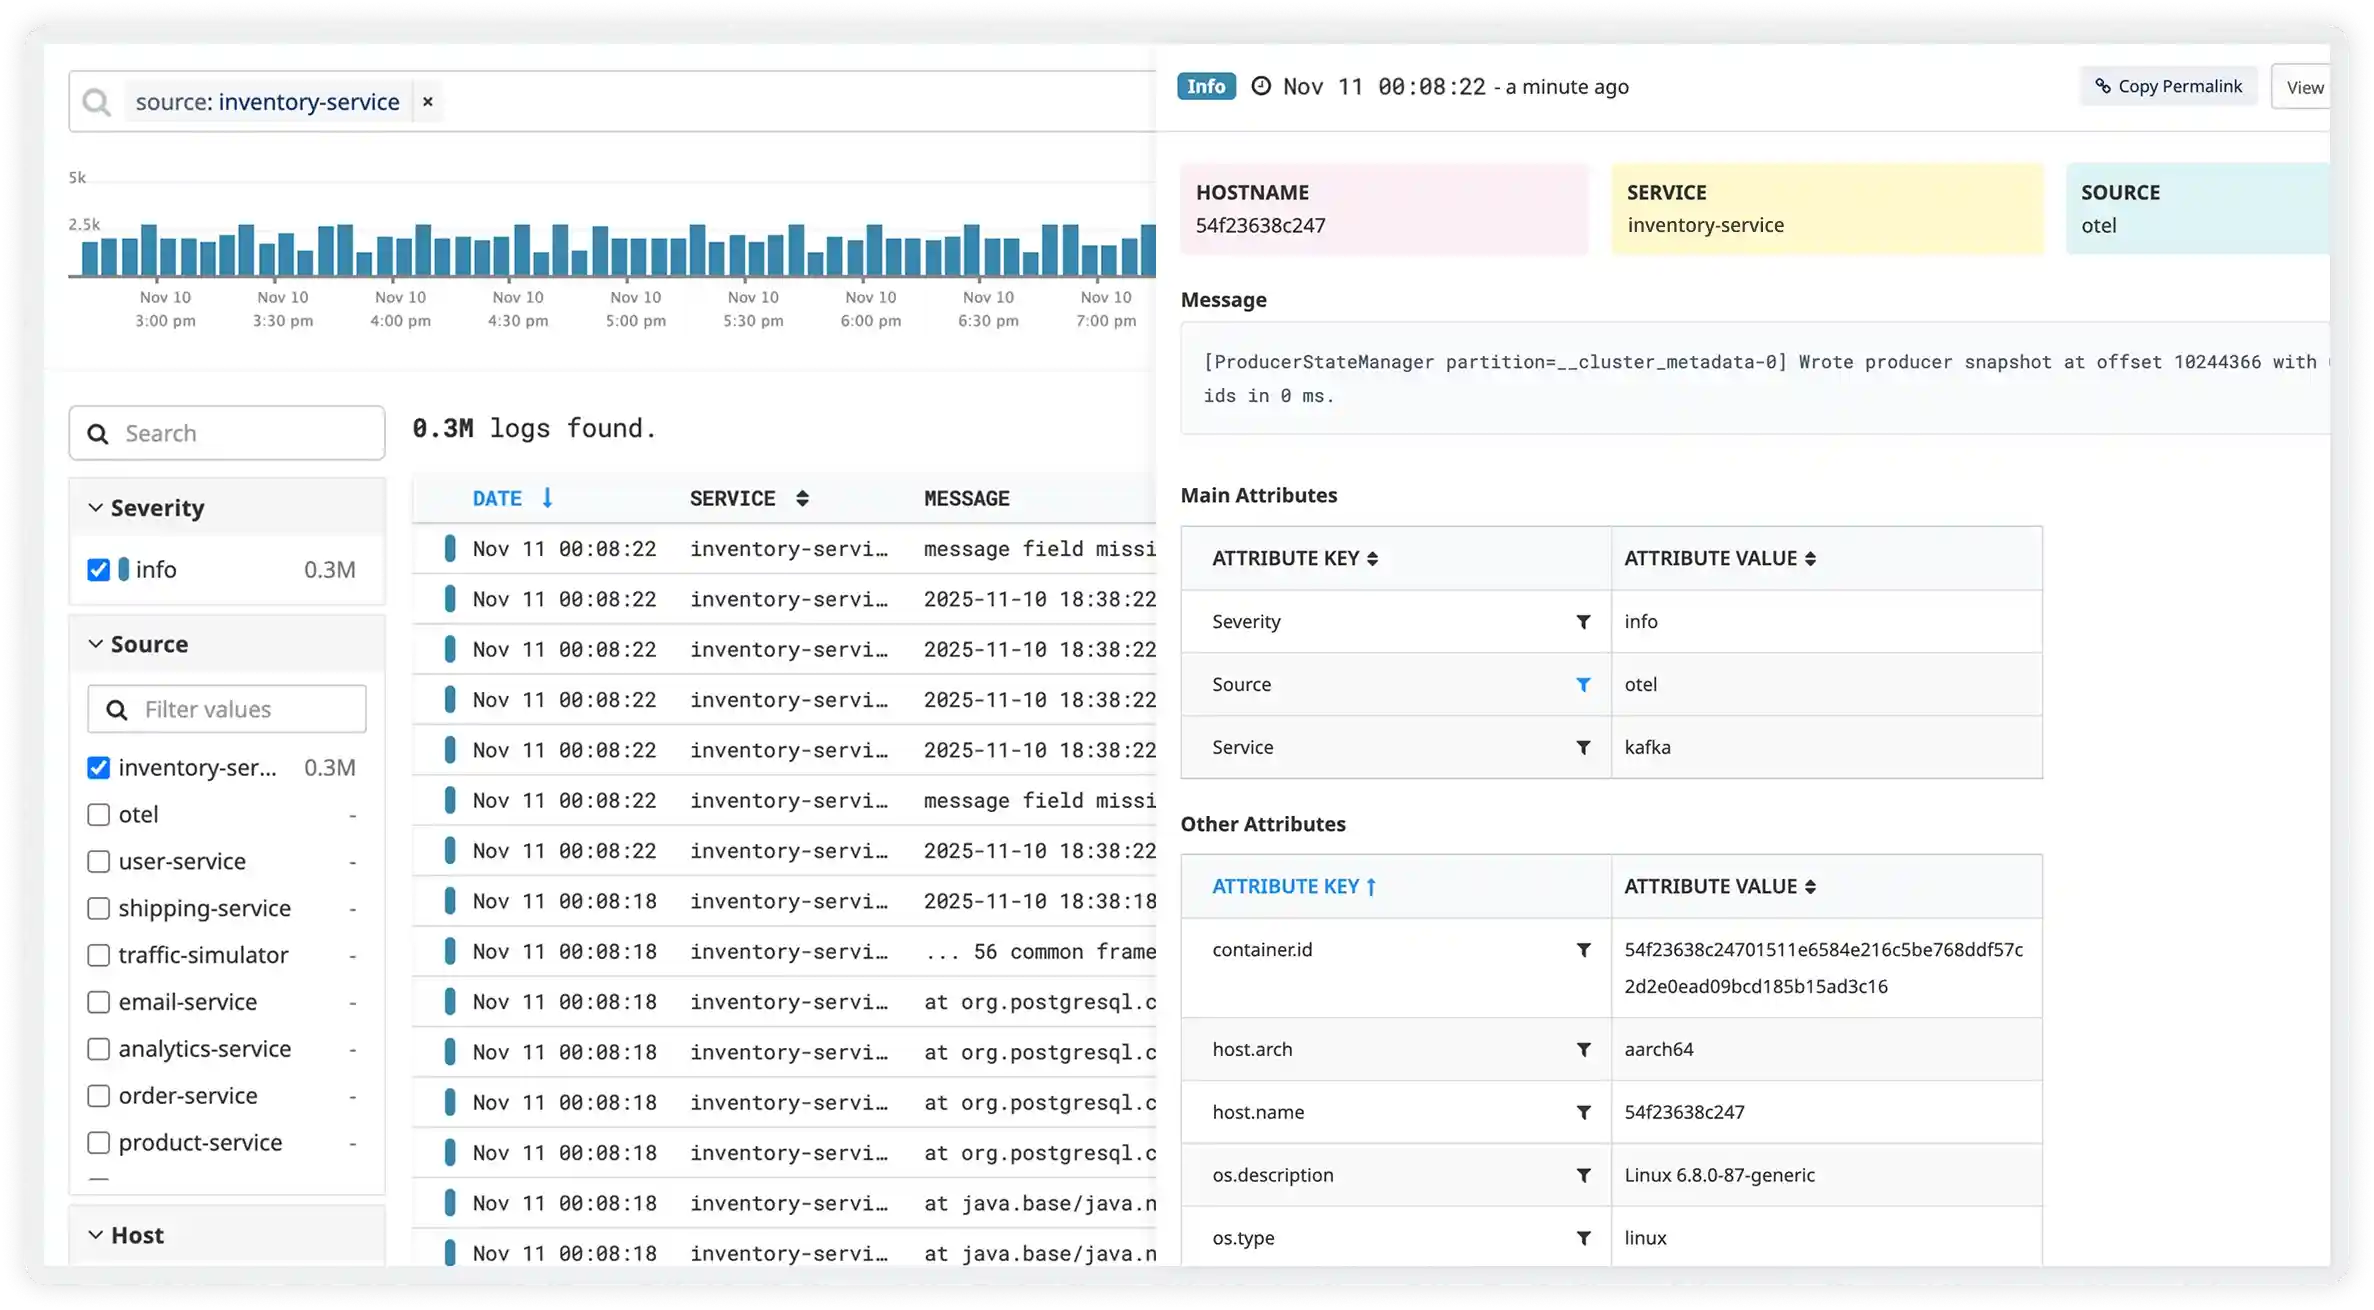
Connected Context Across the Stack
Logs are natively correlated with metrics, traces, and errors. Teams understand what happened, why it happened, and where to fix it without switching tools or losing context.
Built for Faster Troubleshooting, Not Just Search
Atatus surfaces relevant logs, patterns, and anomalies automatically. Teams spend less time digging through noise and more time resolving issues that impact reliability.
One Platform for Engineering and Operations
Engineering, SRE, and support teams work from the same log data. Share investigations, align faster during incidents, and resolve problems with a unified observability platform.
How Atatus Log Management Accelerates Troubleshooting
Centralize, search, and analyze logs with measurable improvements in debugging speed and cost savings
Centralized Log Aggregation
Collect logs from applications, servers, containers, and cloud services in one place. Search and analyze all logs from a single interface.
Lightning-Fast Search
Search through billions of logs in milliseconds. Full-text search, regex support, and advanced filtering to find needles in haystacks.
Logs-Traces-Metrics Correlation
Jump from logs to related traces and metrics instantly. Full context for every log entry helps debug issues 10x faster.
Reduce Storage Costs by 60%
Intelligent log sampling, compression, and tiered storage. Keep important logs while archiving or dropping noise.
Comprehensive Log Collection
Auto-discovery of log sources, structured and unstructured log parsing, and reliable log delivery. Never miss critical logs.
Real-Time Log Streaming
Stream logs in real-time, set up live tail for debugging, and get instant alerts on log patterns and anomalies.
Everything You Need to
Manage Logs
Production-ready log management that helps you debug faster and maintain observability
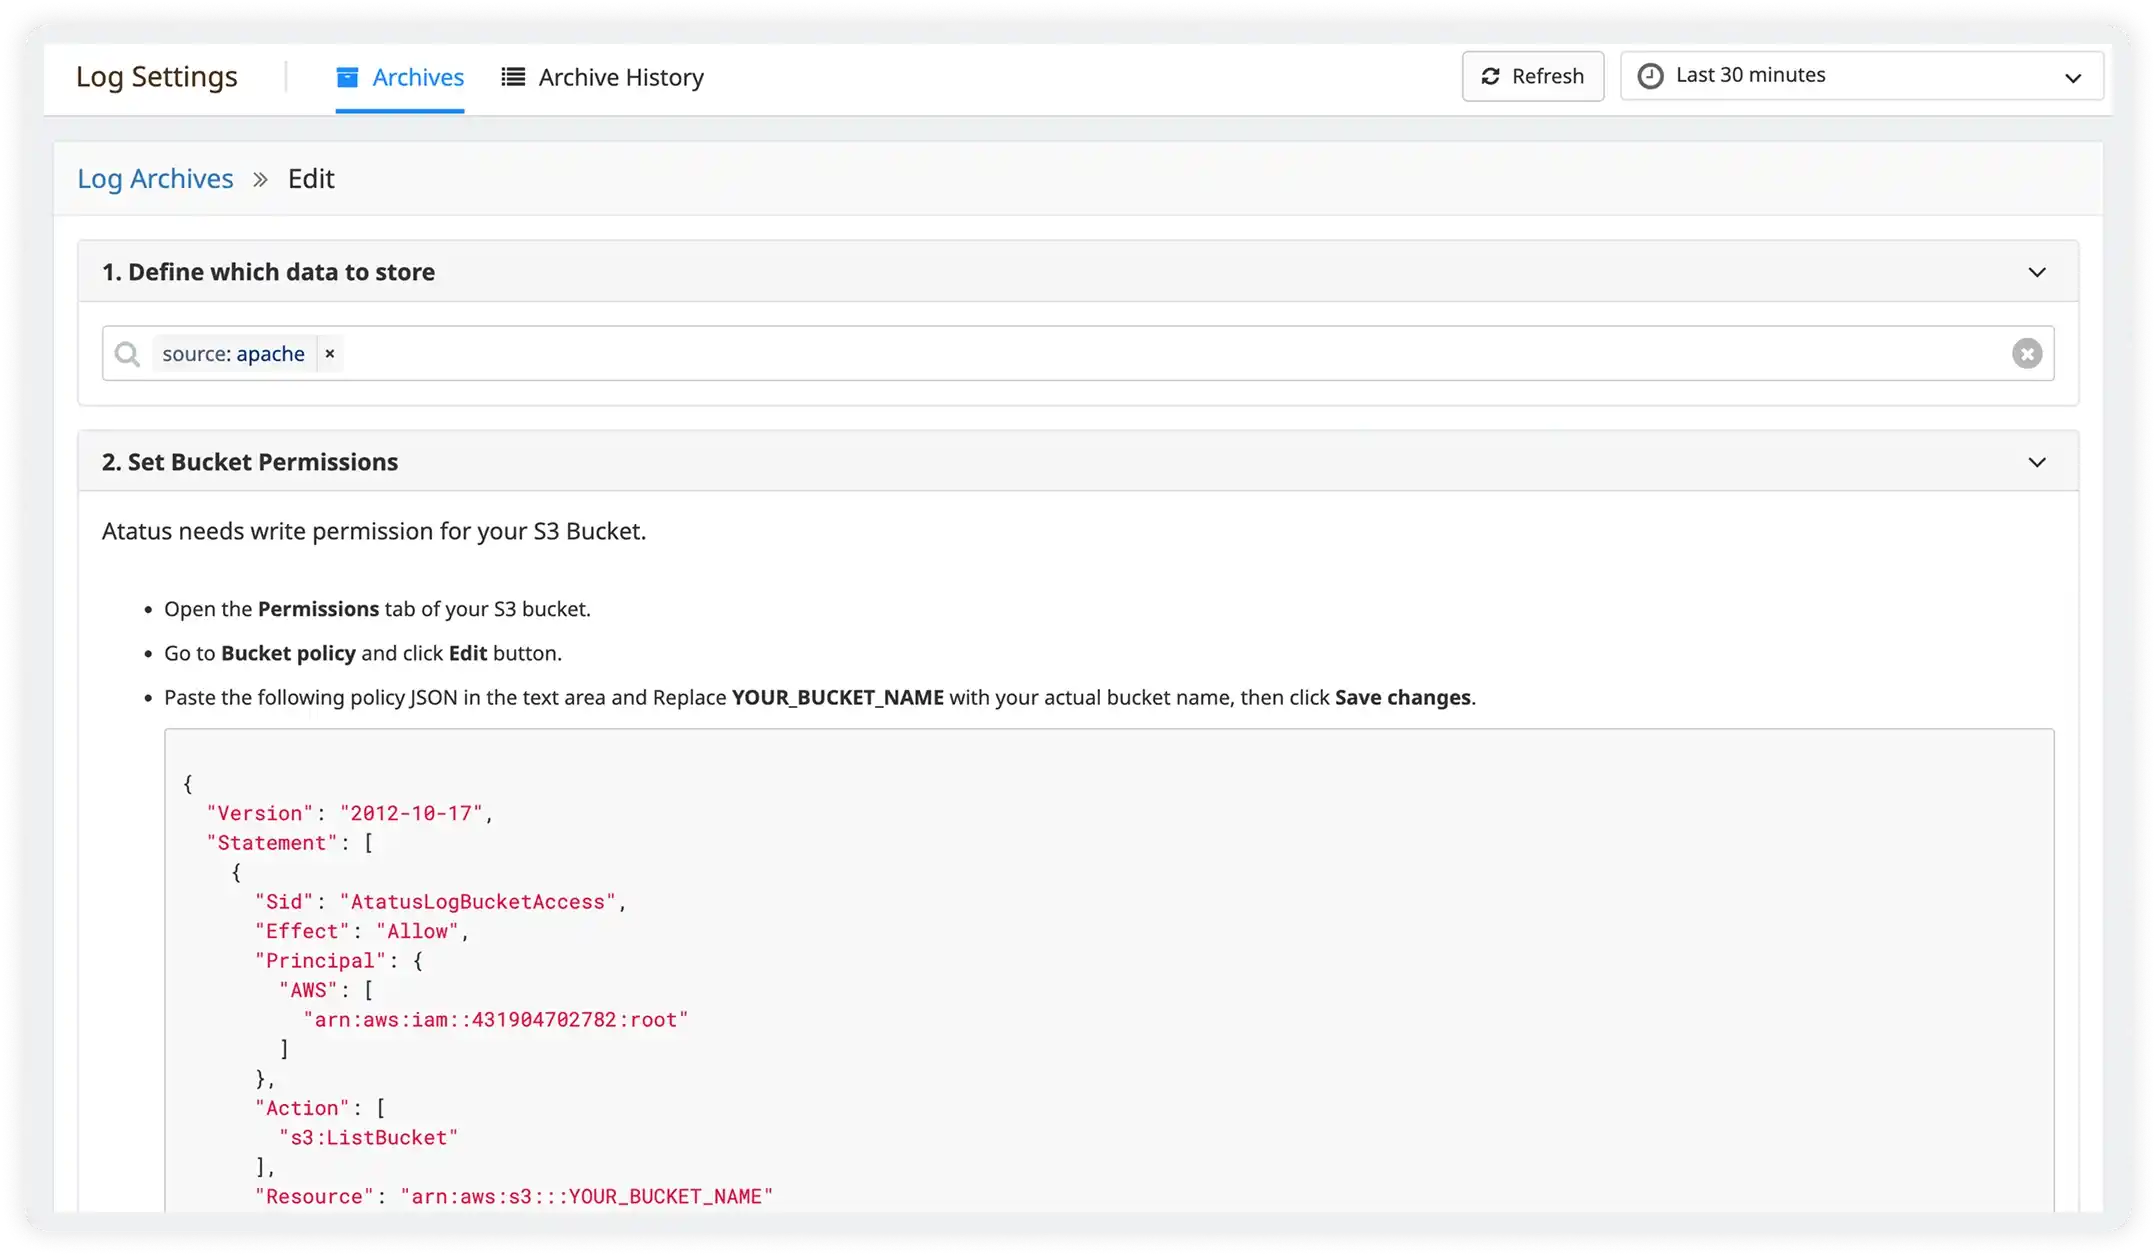
Store Logs Without Trade-offs
Securely archive logs for long-term retention and compliance while keeping them instantly searchable when investigations demand historical context.
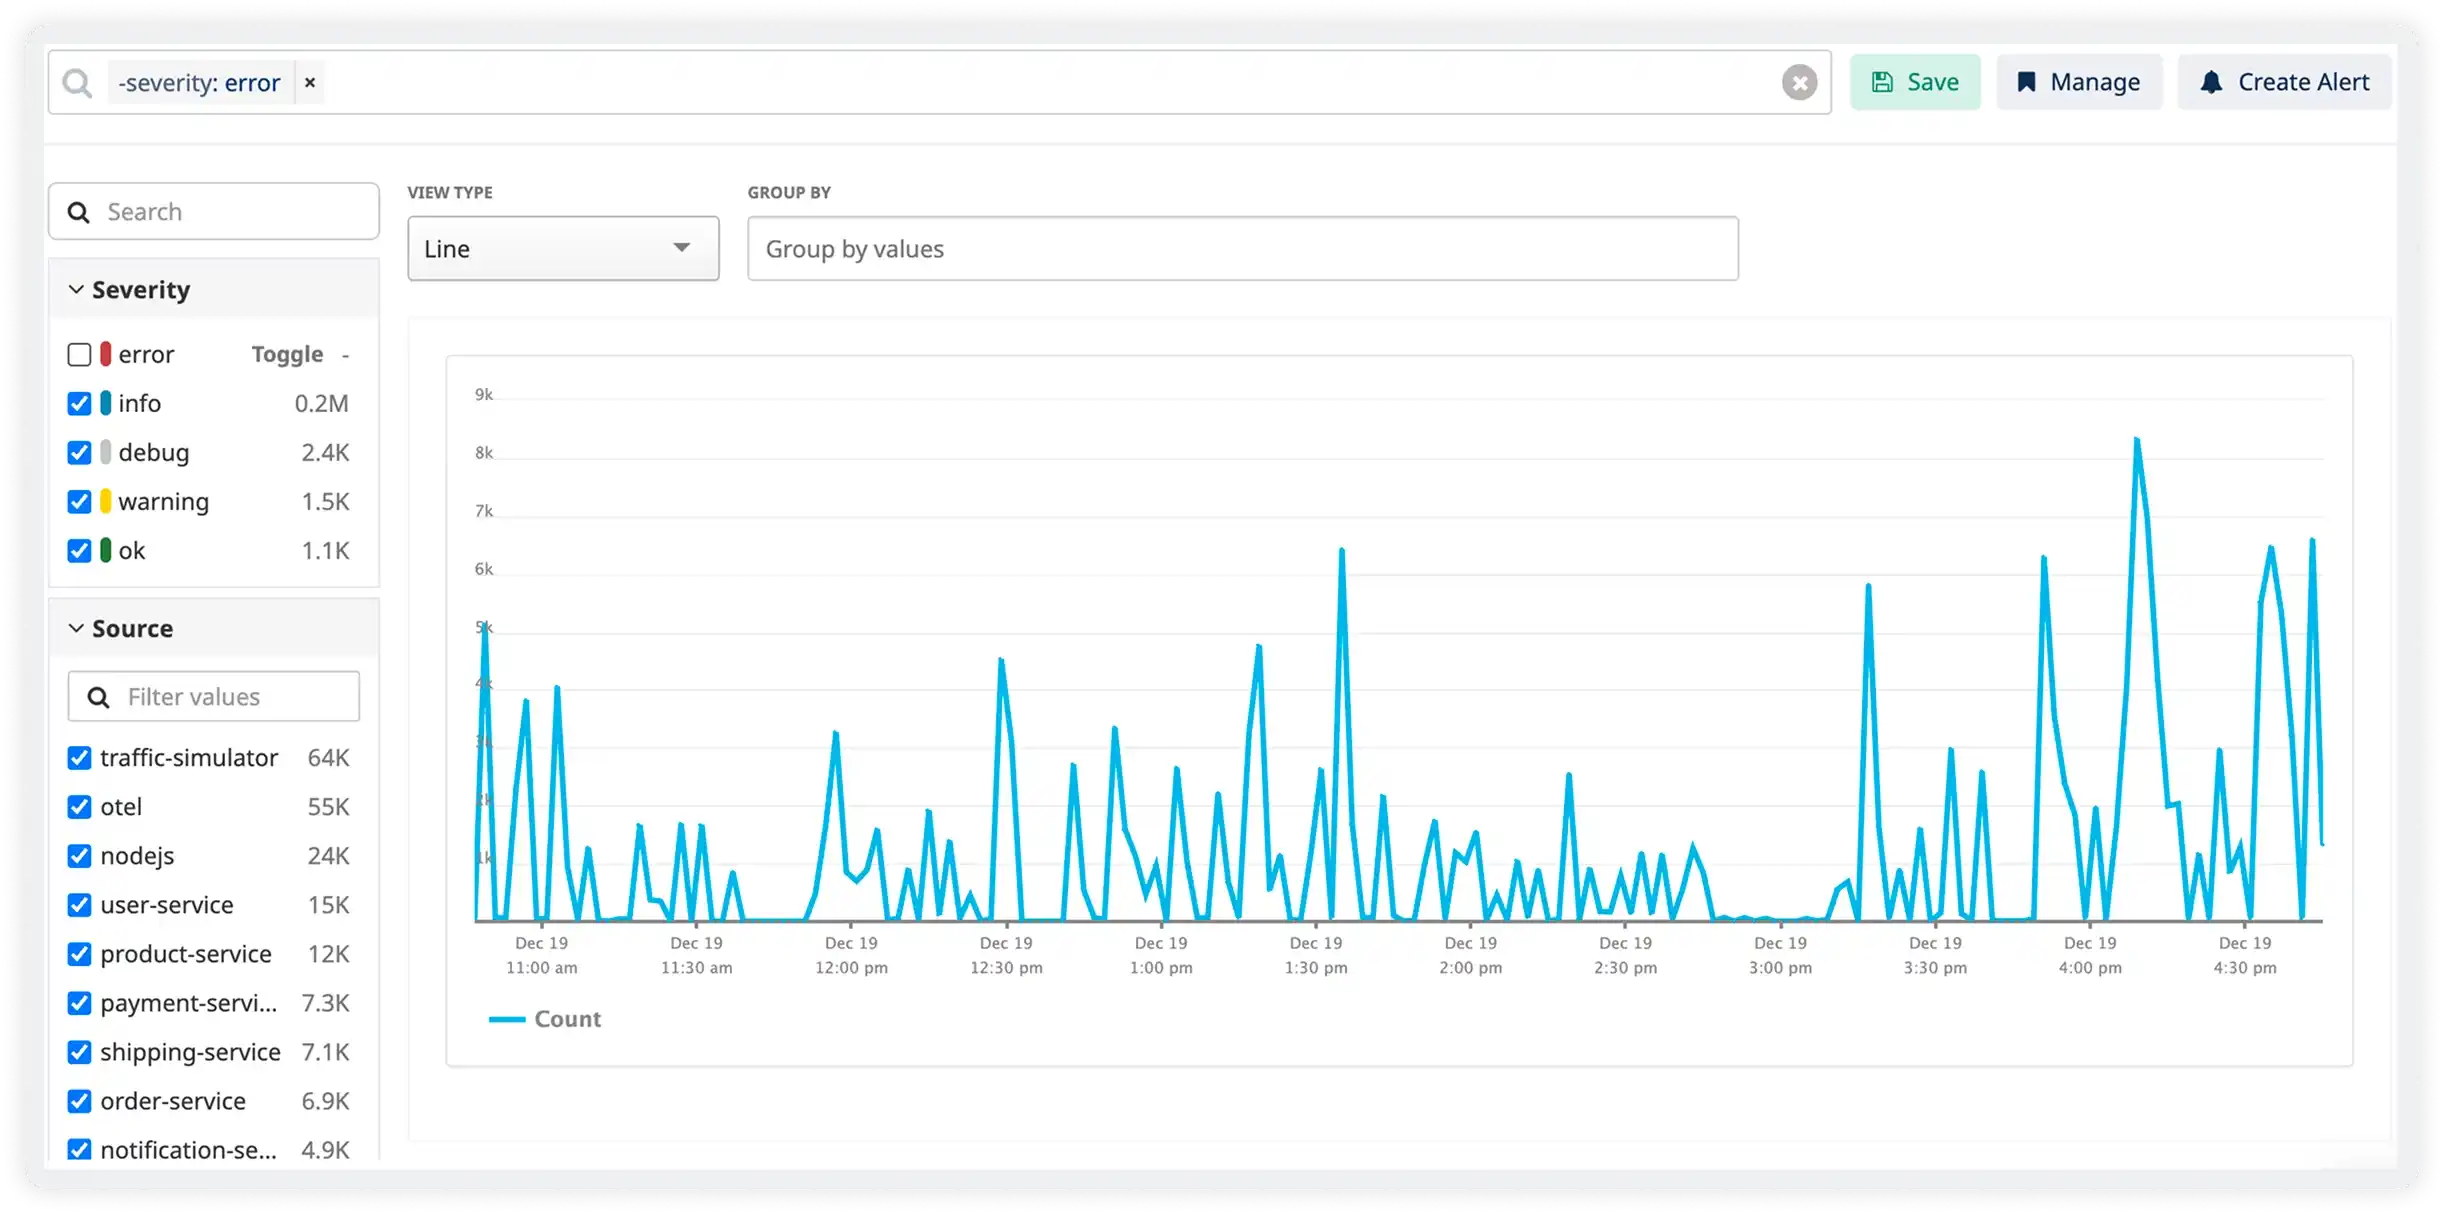
Turn Raw Logs Into Clear Answers
Slice, filter, and query massive log volumes to uncover trends, performance gaps, and error patterns that matter to your systems.
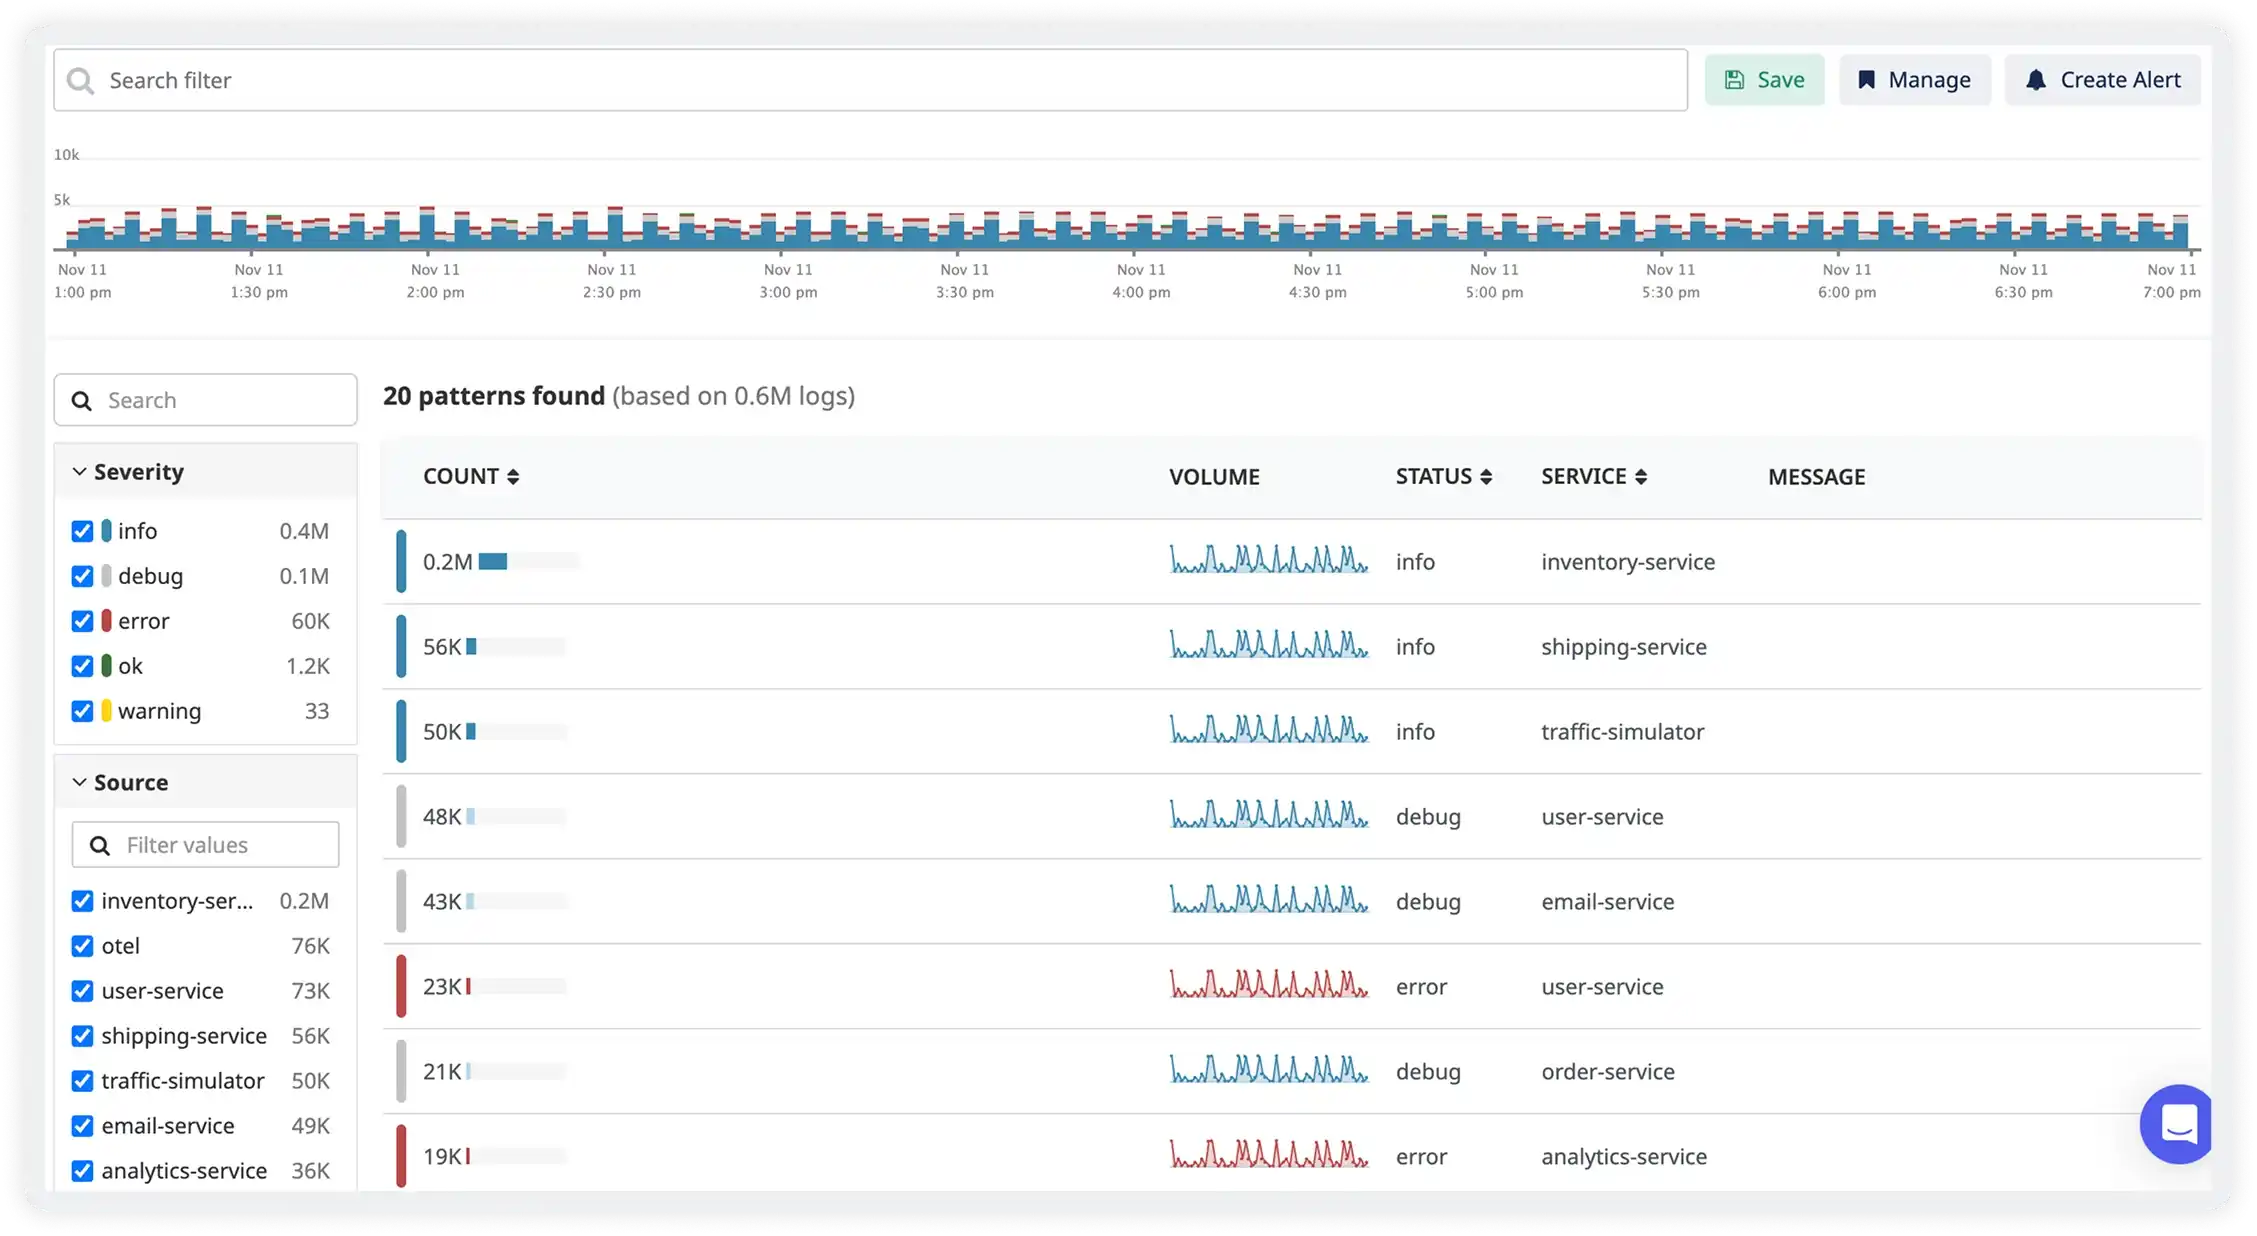
Spot Repeating Issues Automatically
Detect recurring log patterns to identify common failures and anomalies faster, without scanning endless log lines.
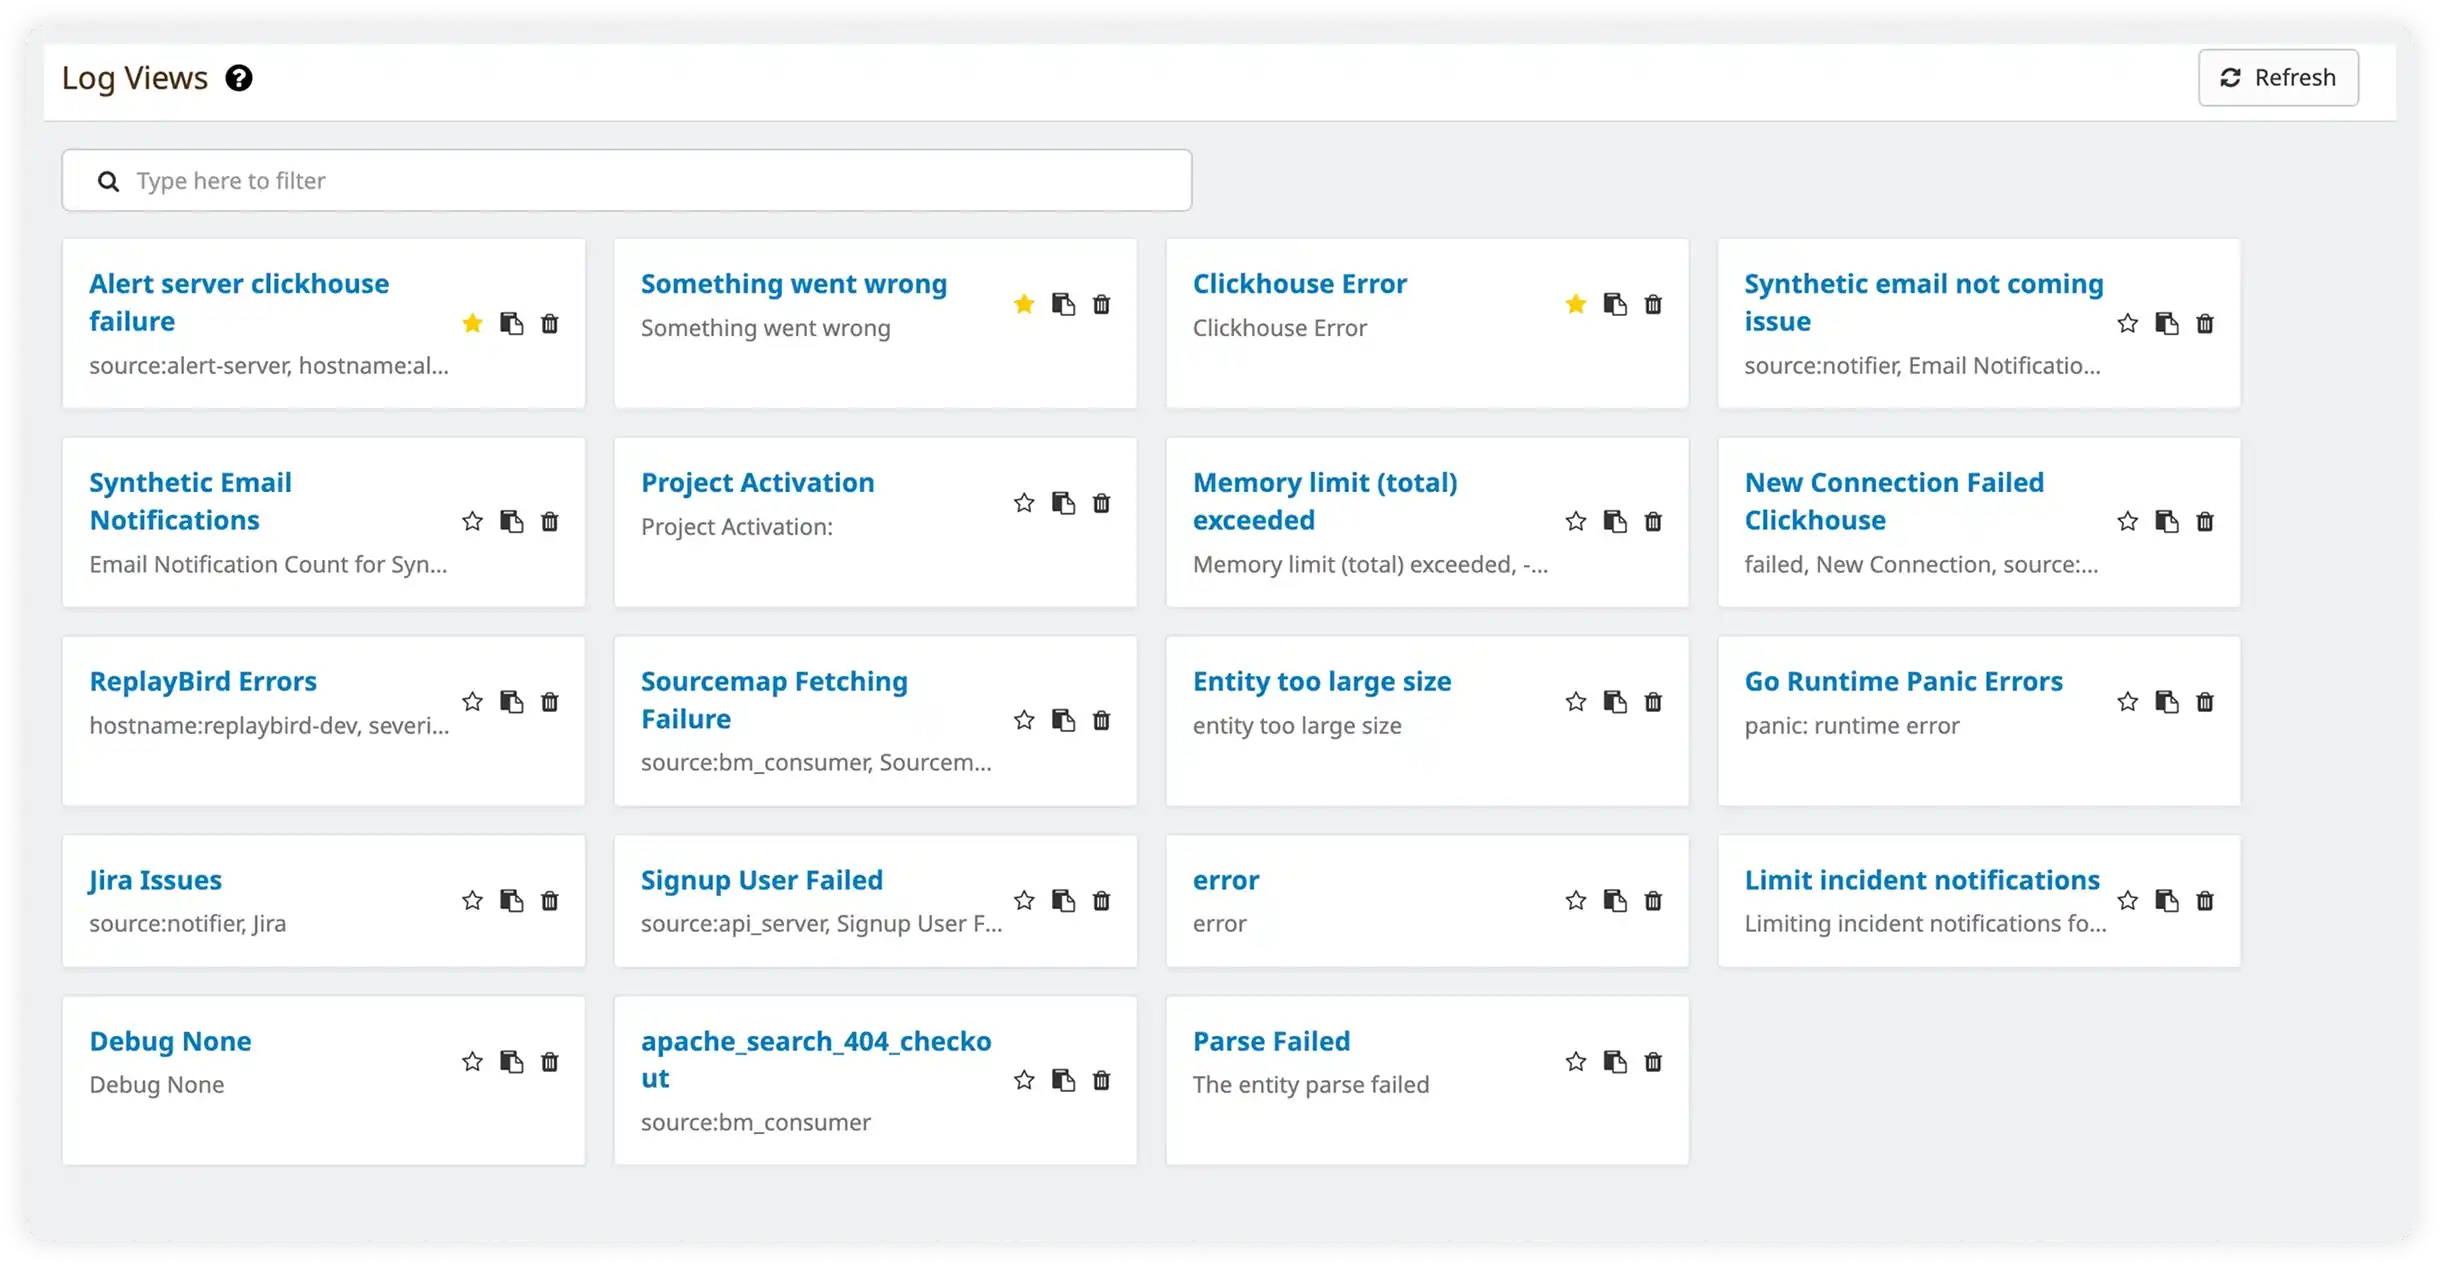
Organized Your Logs in Saved View
Create and share saved log views for faster access to critical data during investigations and day-to-day monitoring.
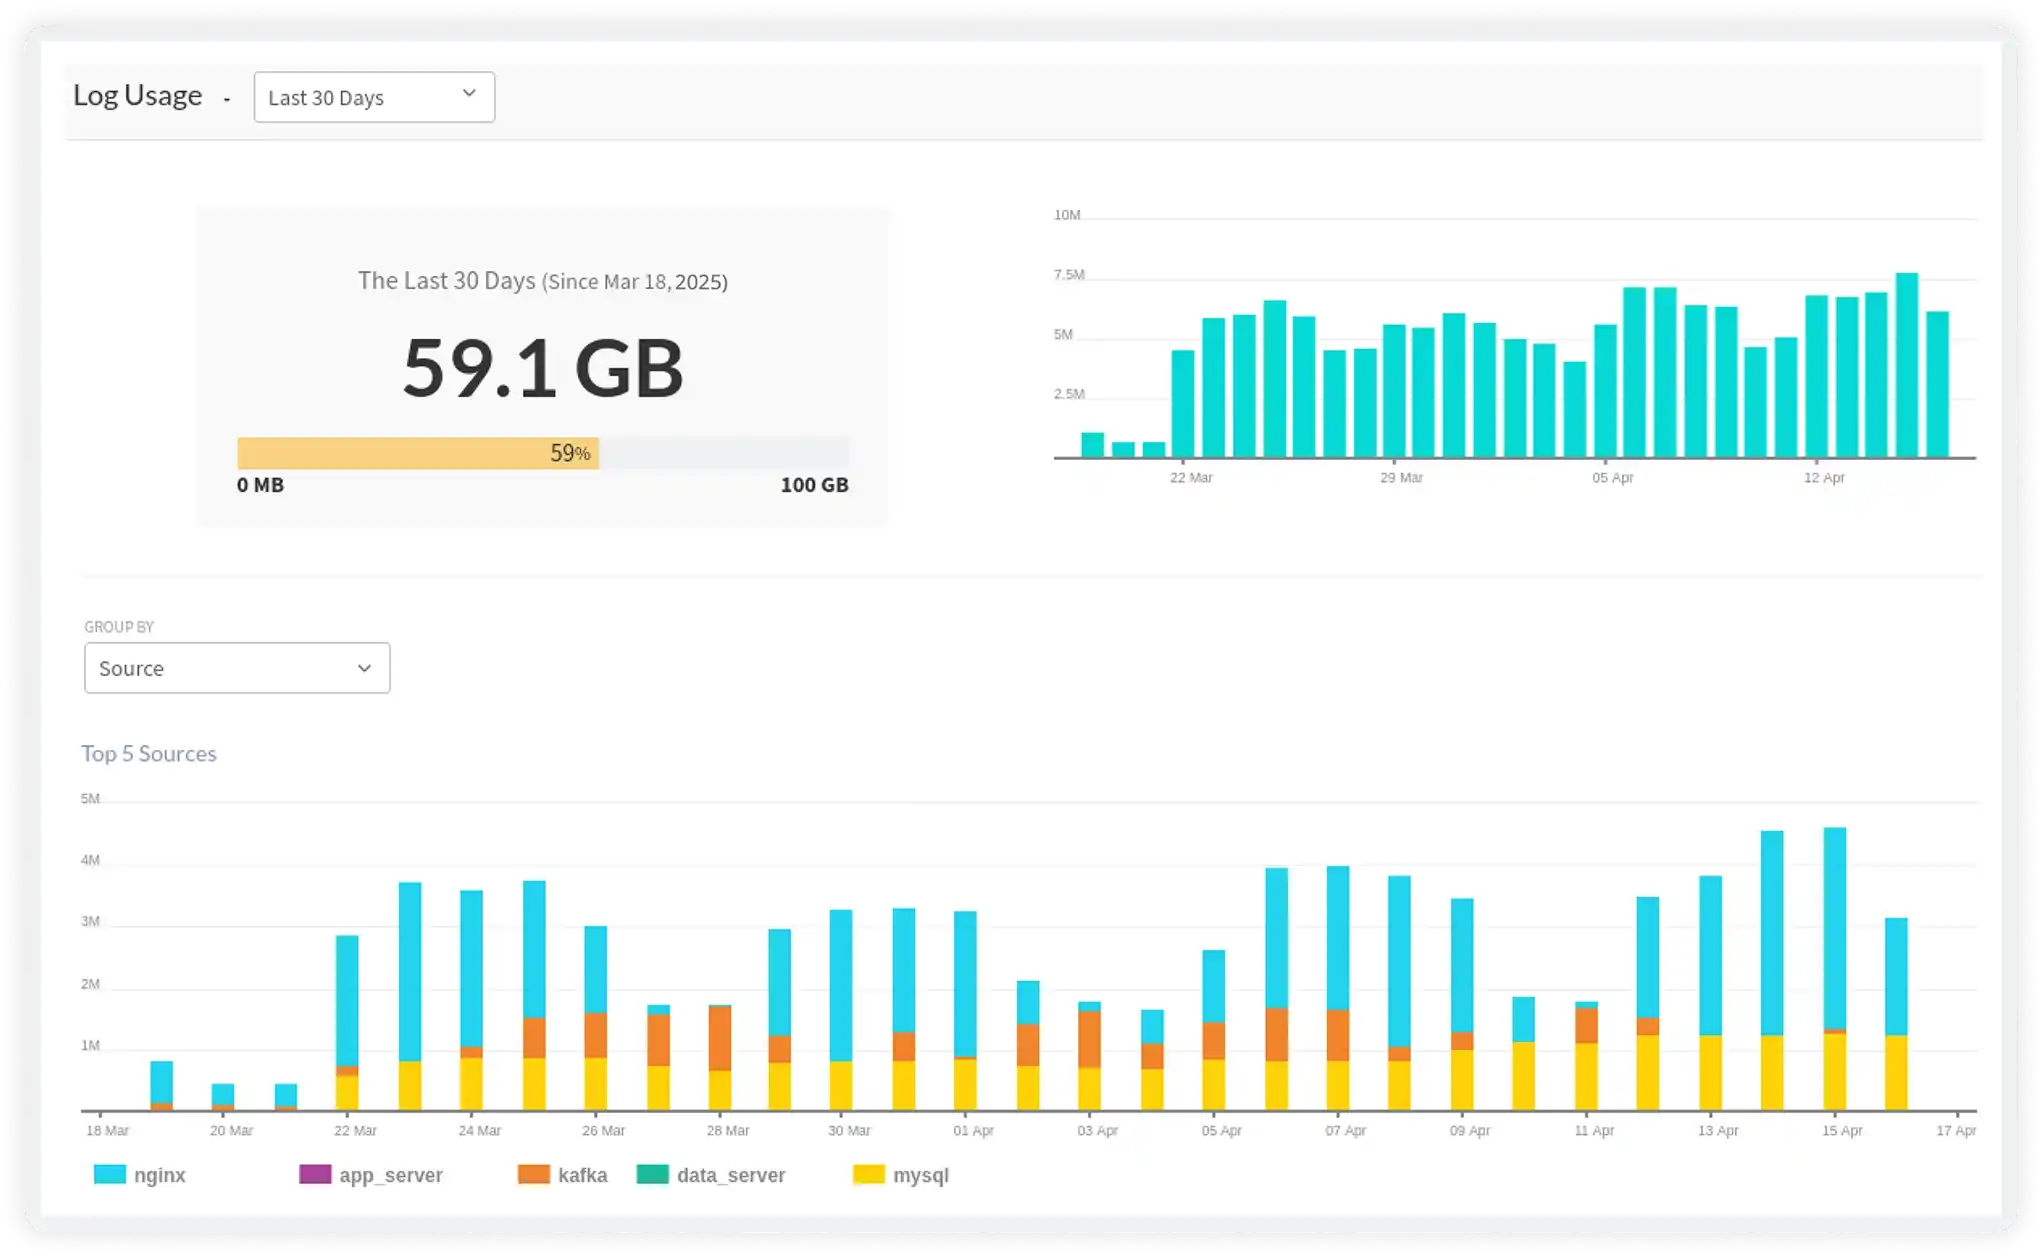
Full Transparency Into Log Consumption
Track ingestion volume, retention, and usage trends so teams can manage costs and scale log collection with confidence.
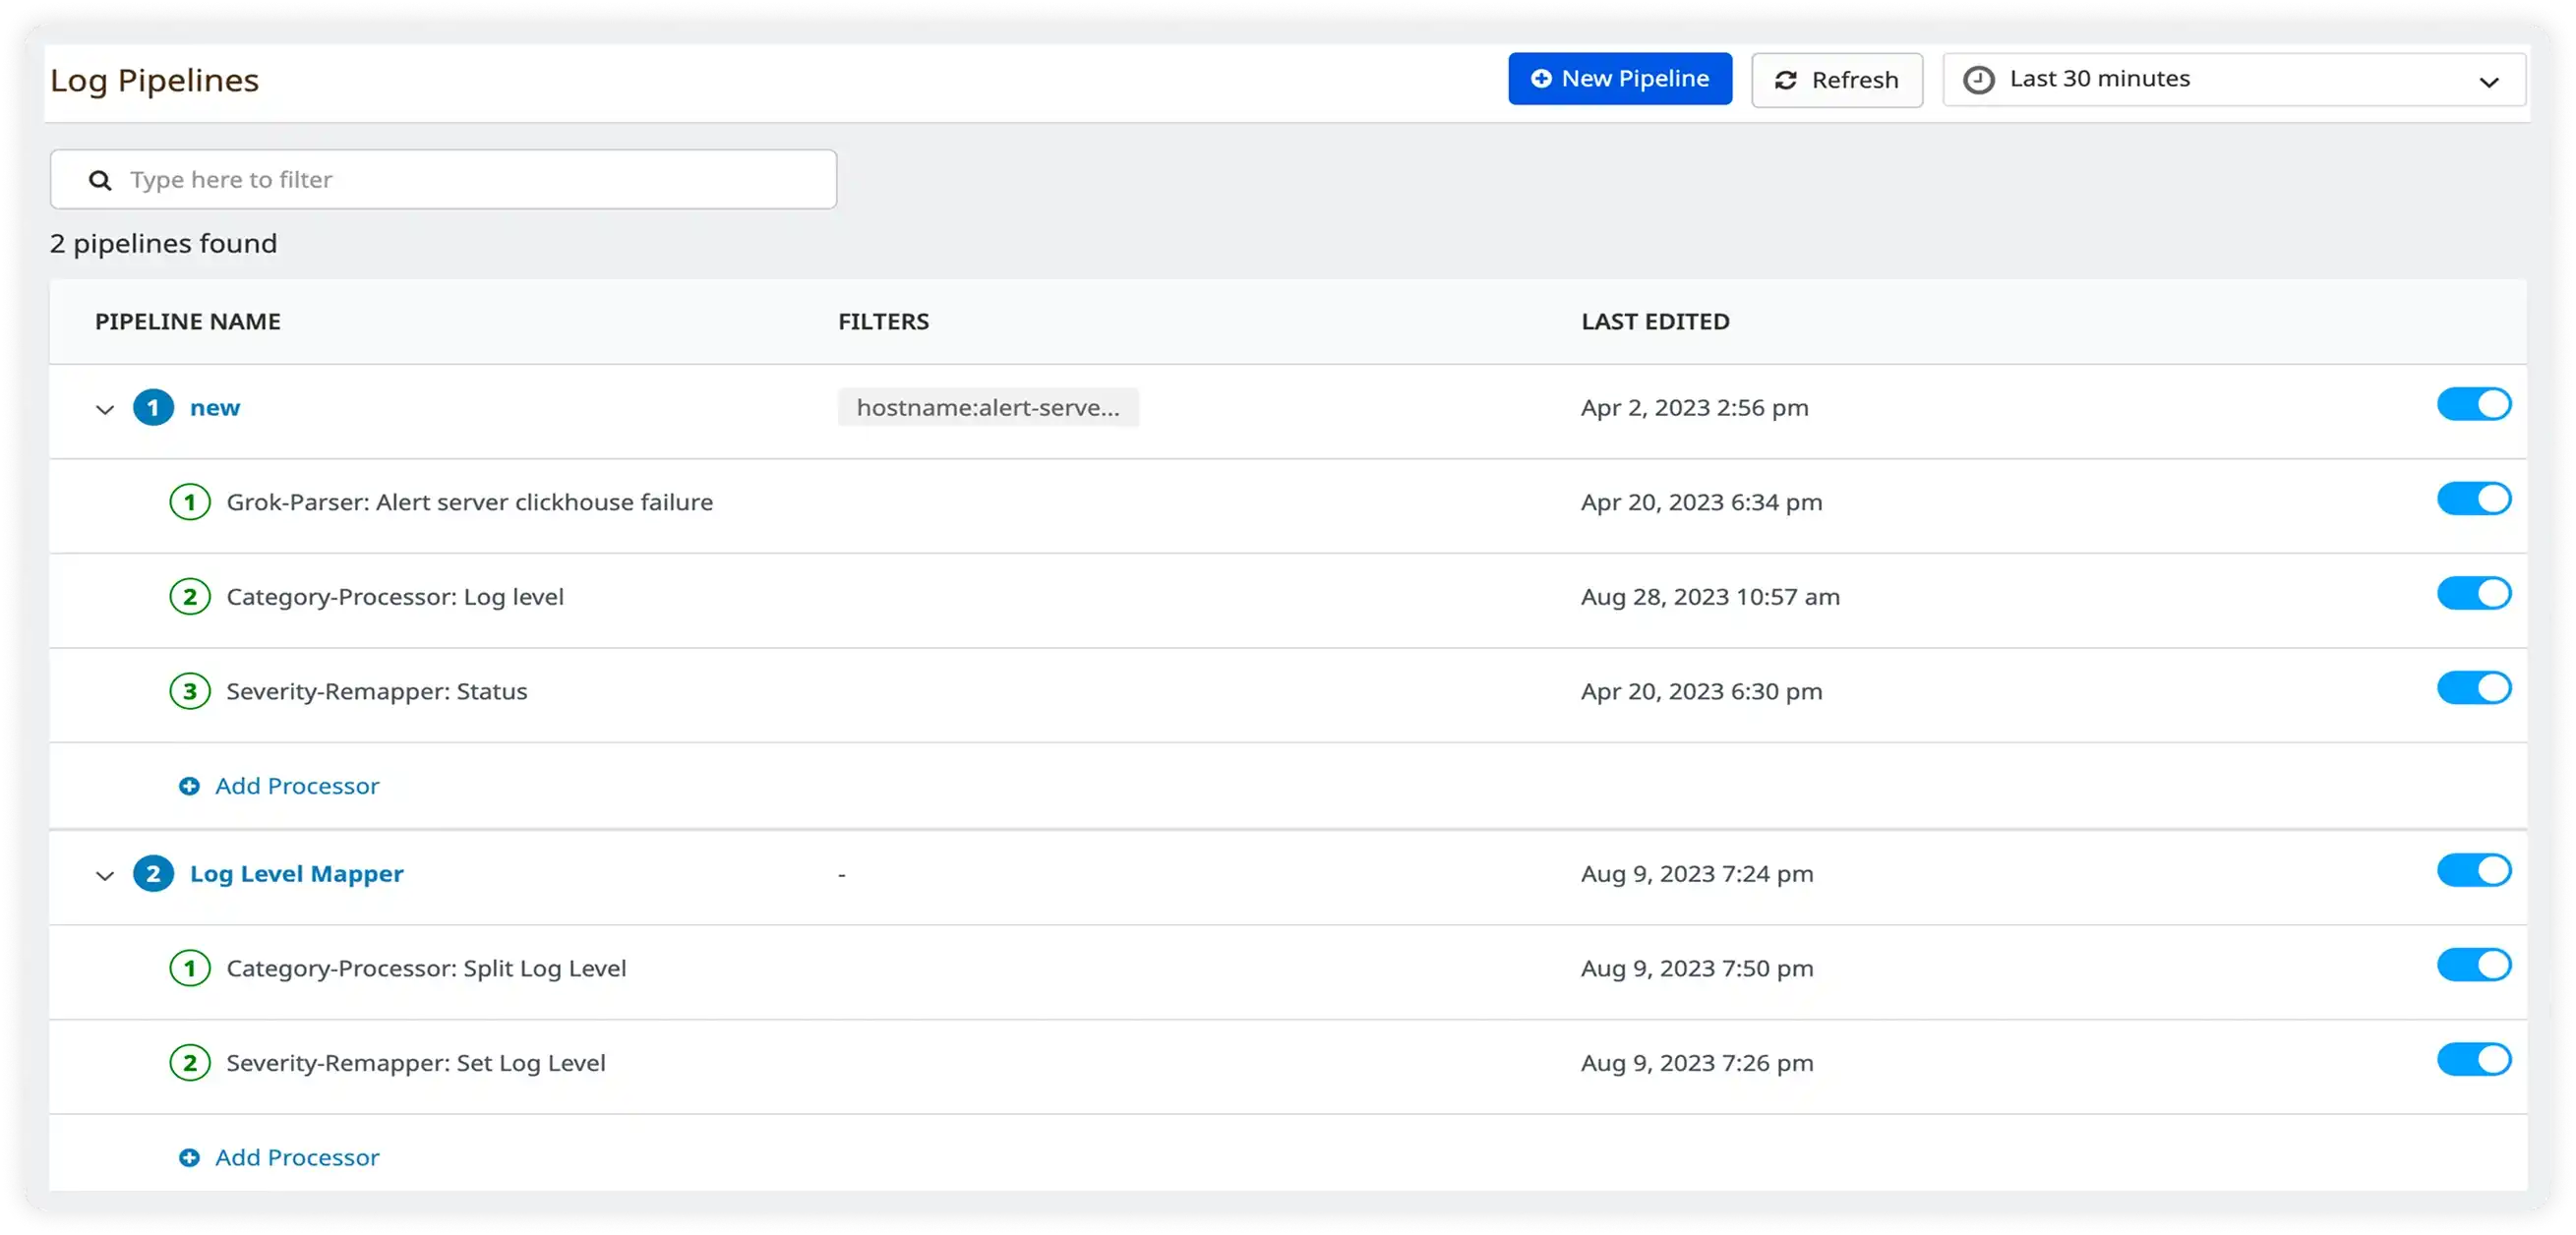
Shape Logs Before They Cost You
Parse, enrich, filter, and route logs in real time to control data flow, improve signal quality, and reduce unnecessary ingestion.
Unified Monitoring for Your Entire Application Stack
Designed to support applications built with popular languages and frameworks, providing unified visibility across the entire application stack.
Start Monitoring in Under 5 Minutes
Three simple steps to complete observability. No credit card required.
Real-time alerting
Immediate notification of high-priority incidents through advanced configurations based on error logs or custom queries.
Filter Context
Enhance debugging by adding/deleting related streams like host, service, source, severity for focused analysis.
Seek by Time
Pinpoint events in distributed logs for detailed issue resolution—critical for understanding specific occurrences across systems.
Milestones that spark performance excellence
Reflections from clients who've achieved unmatched excellence through innovative strategies.
Read customer stories


