Operational Logs for Apache Traffic and Server Health
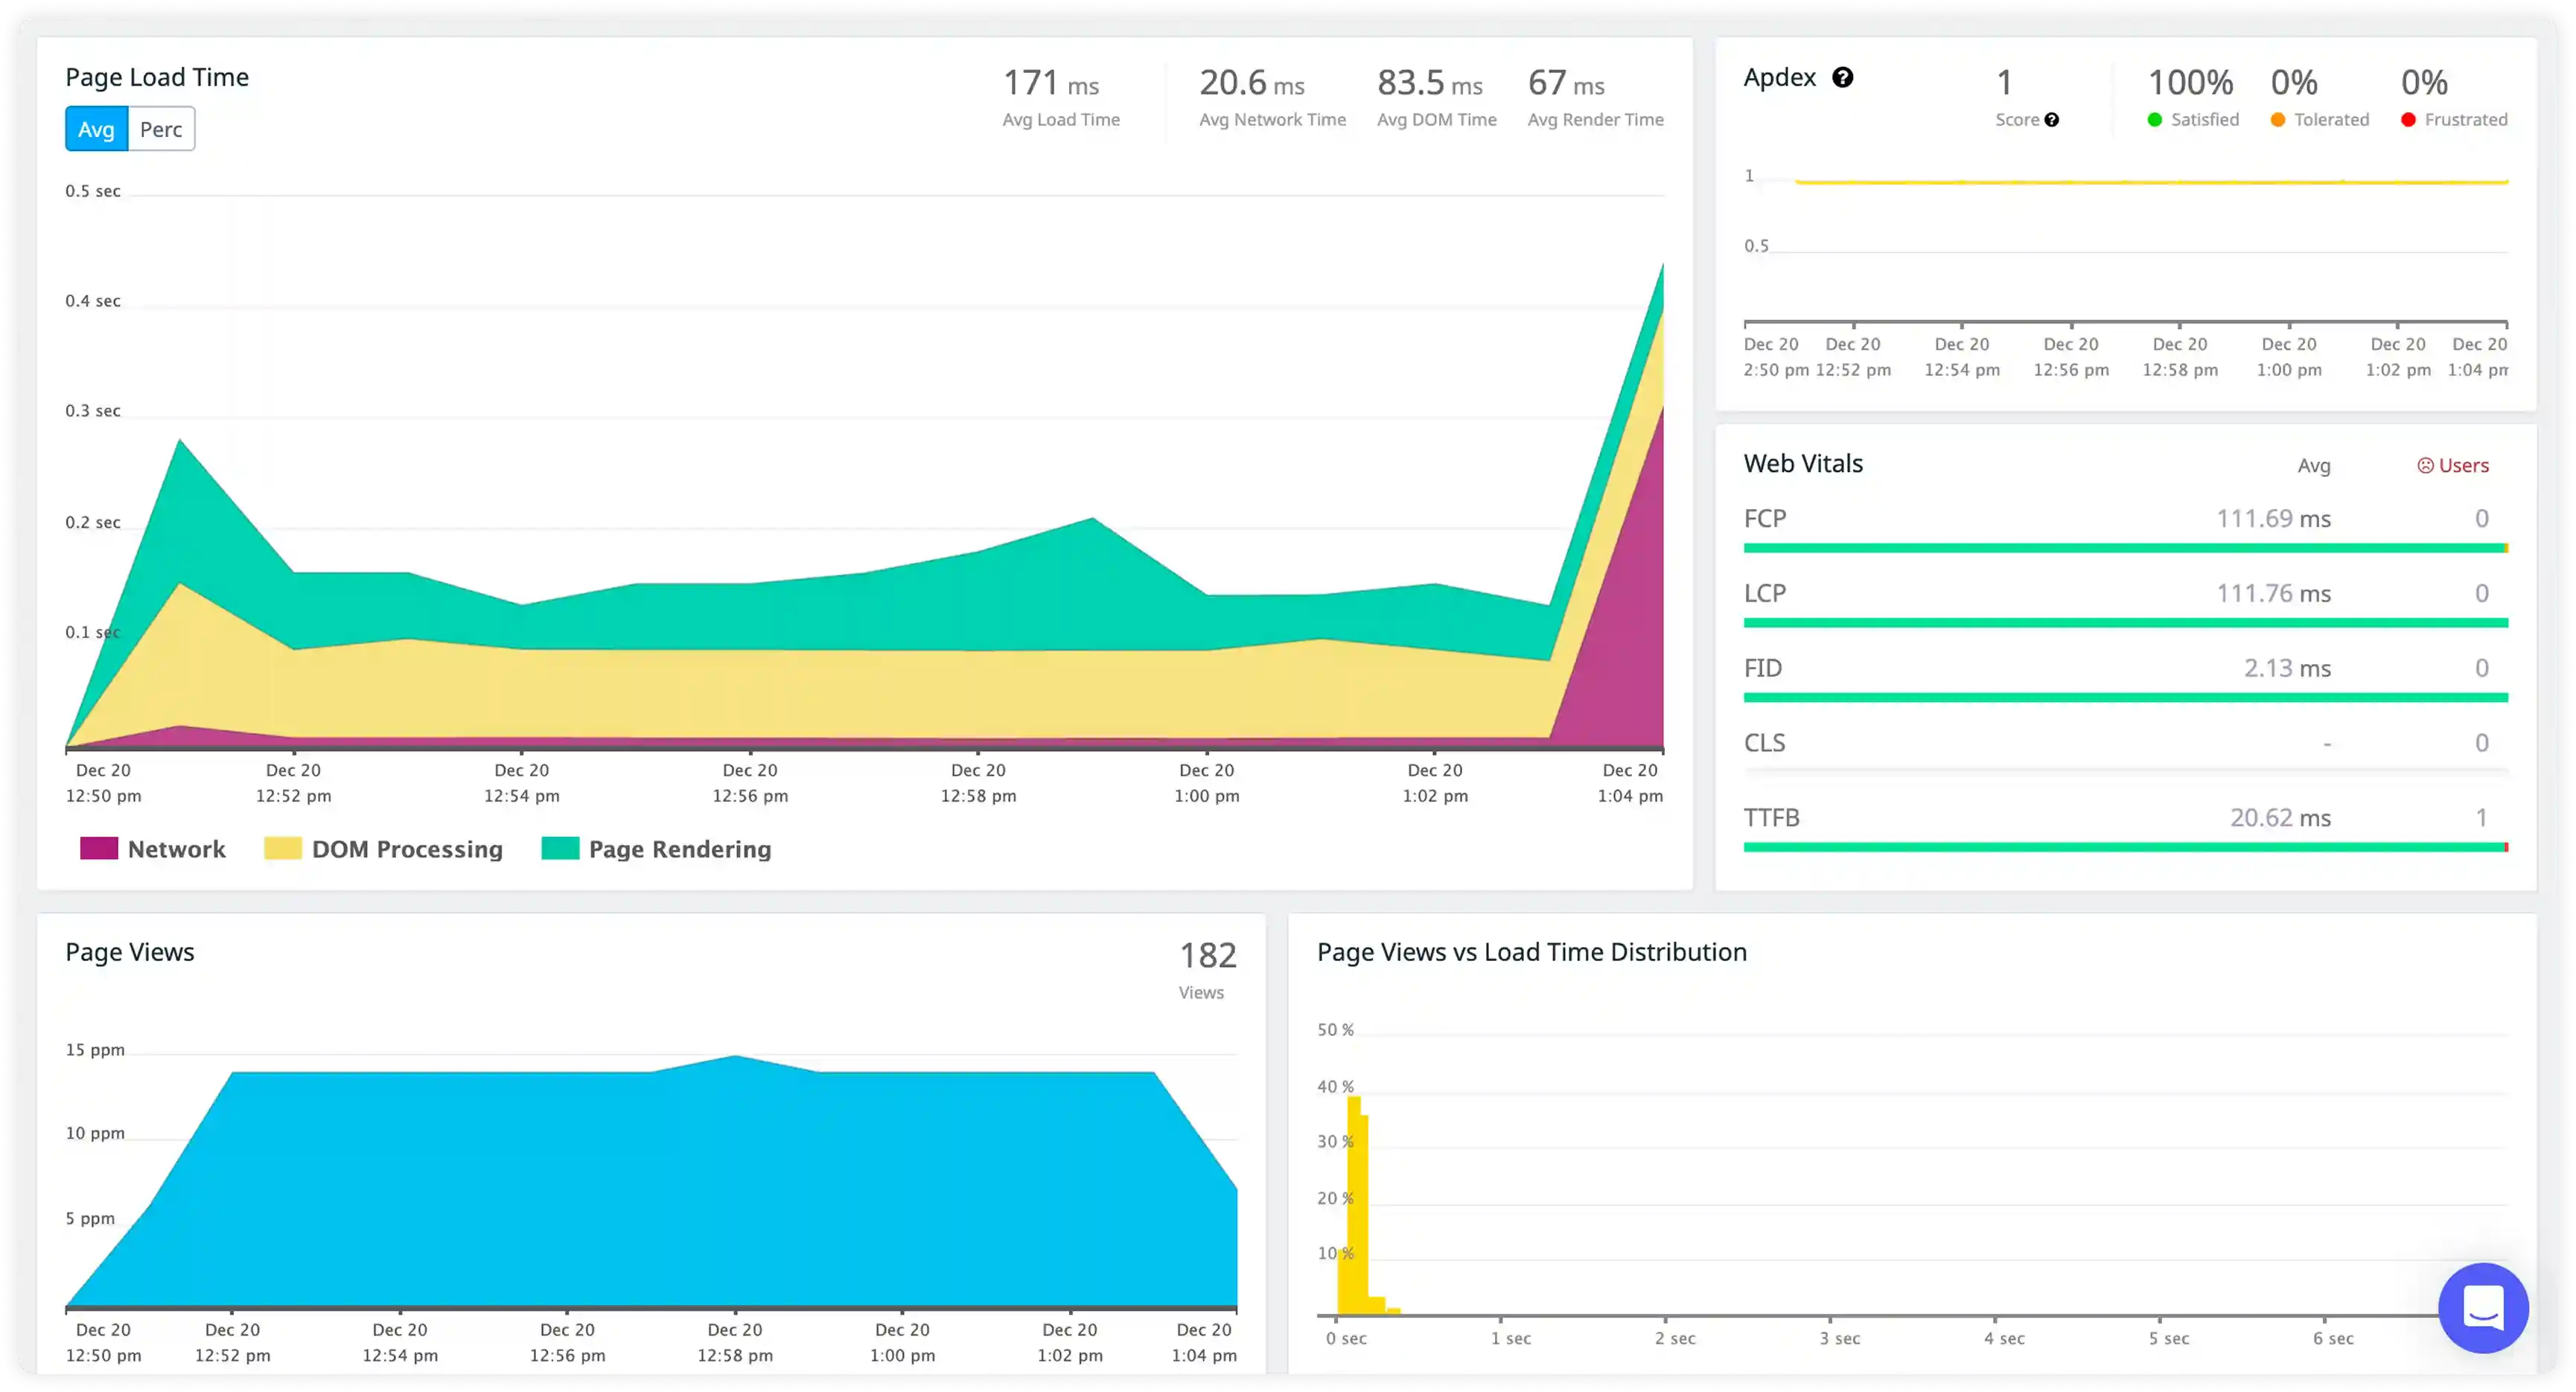
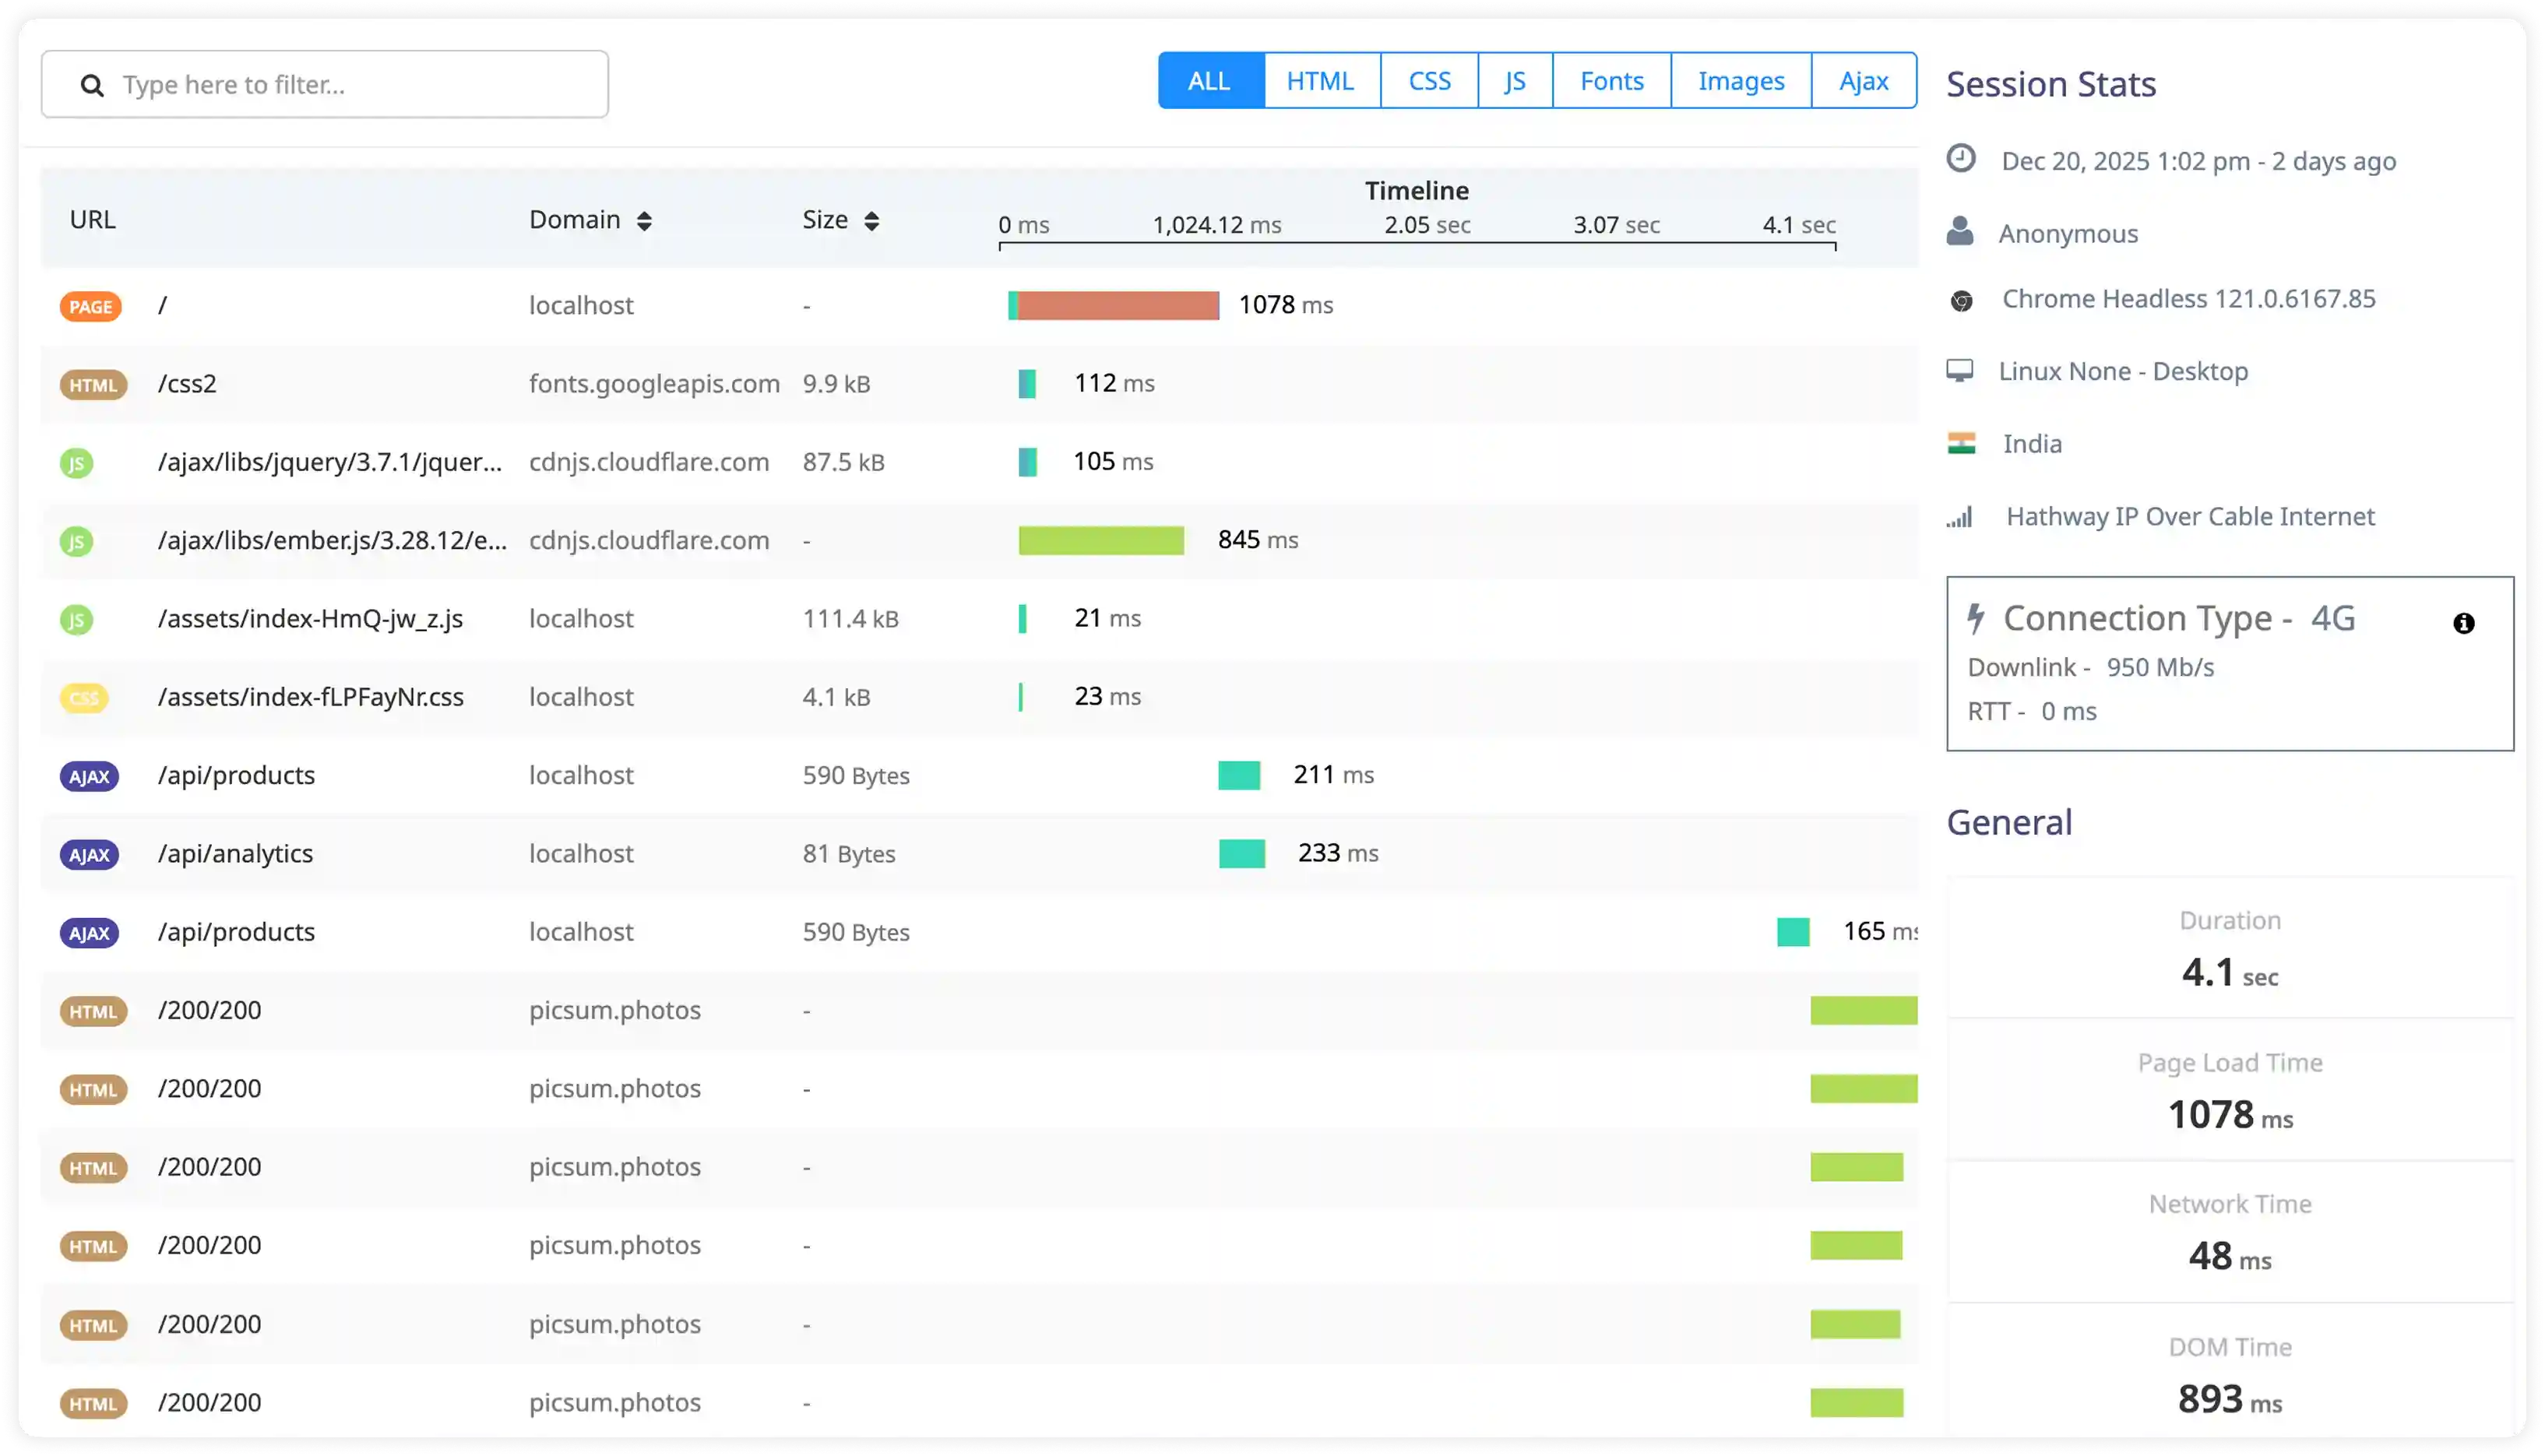
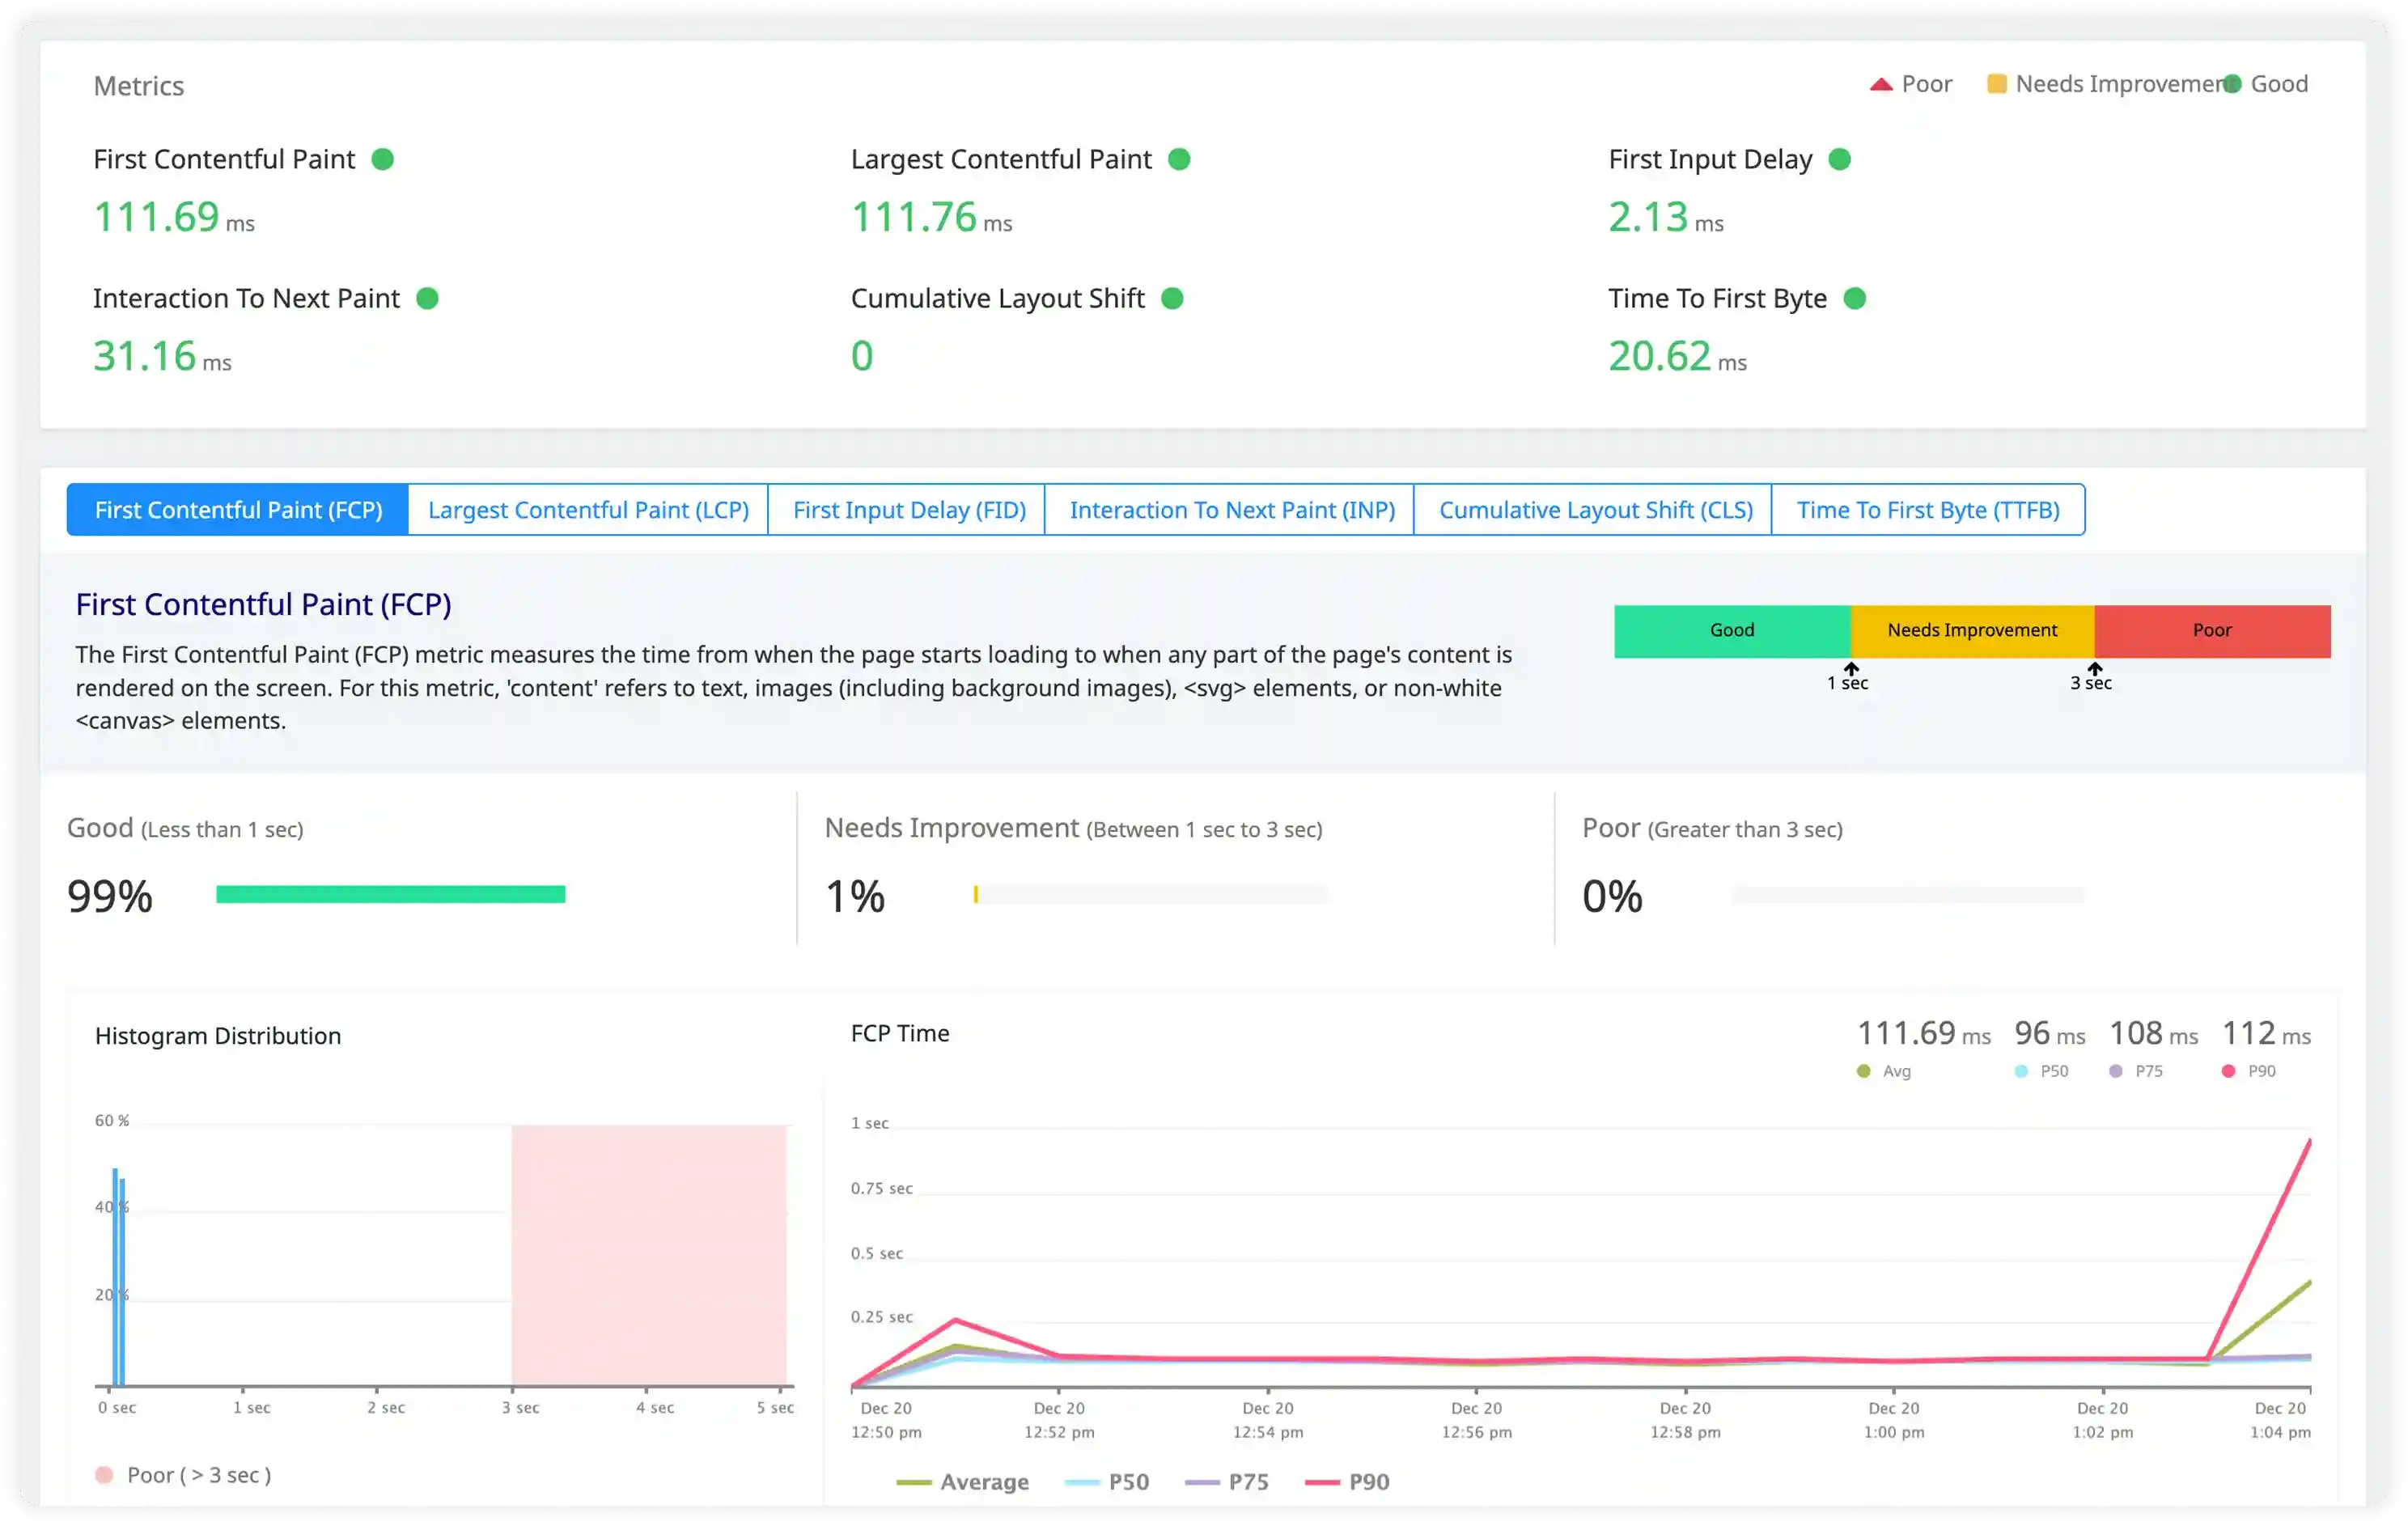
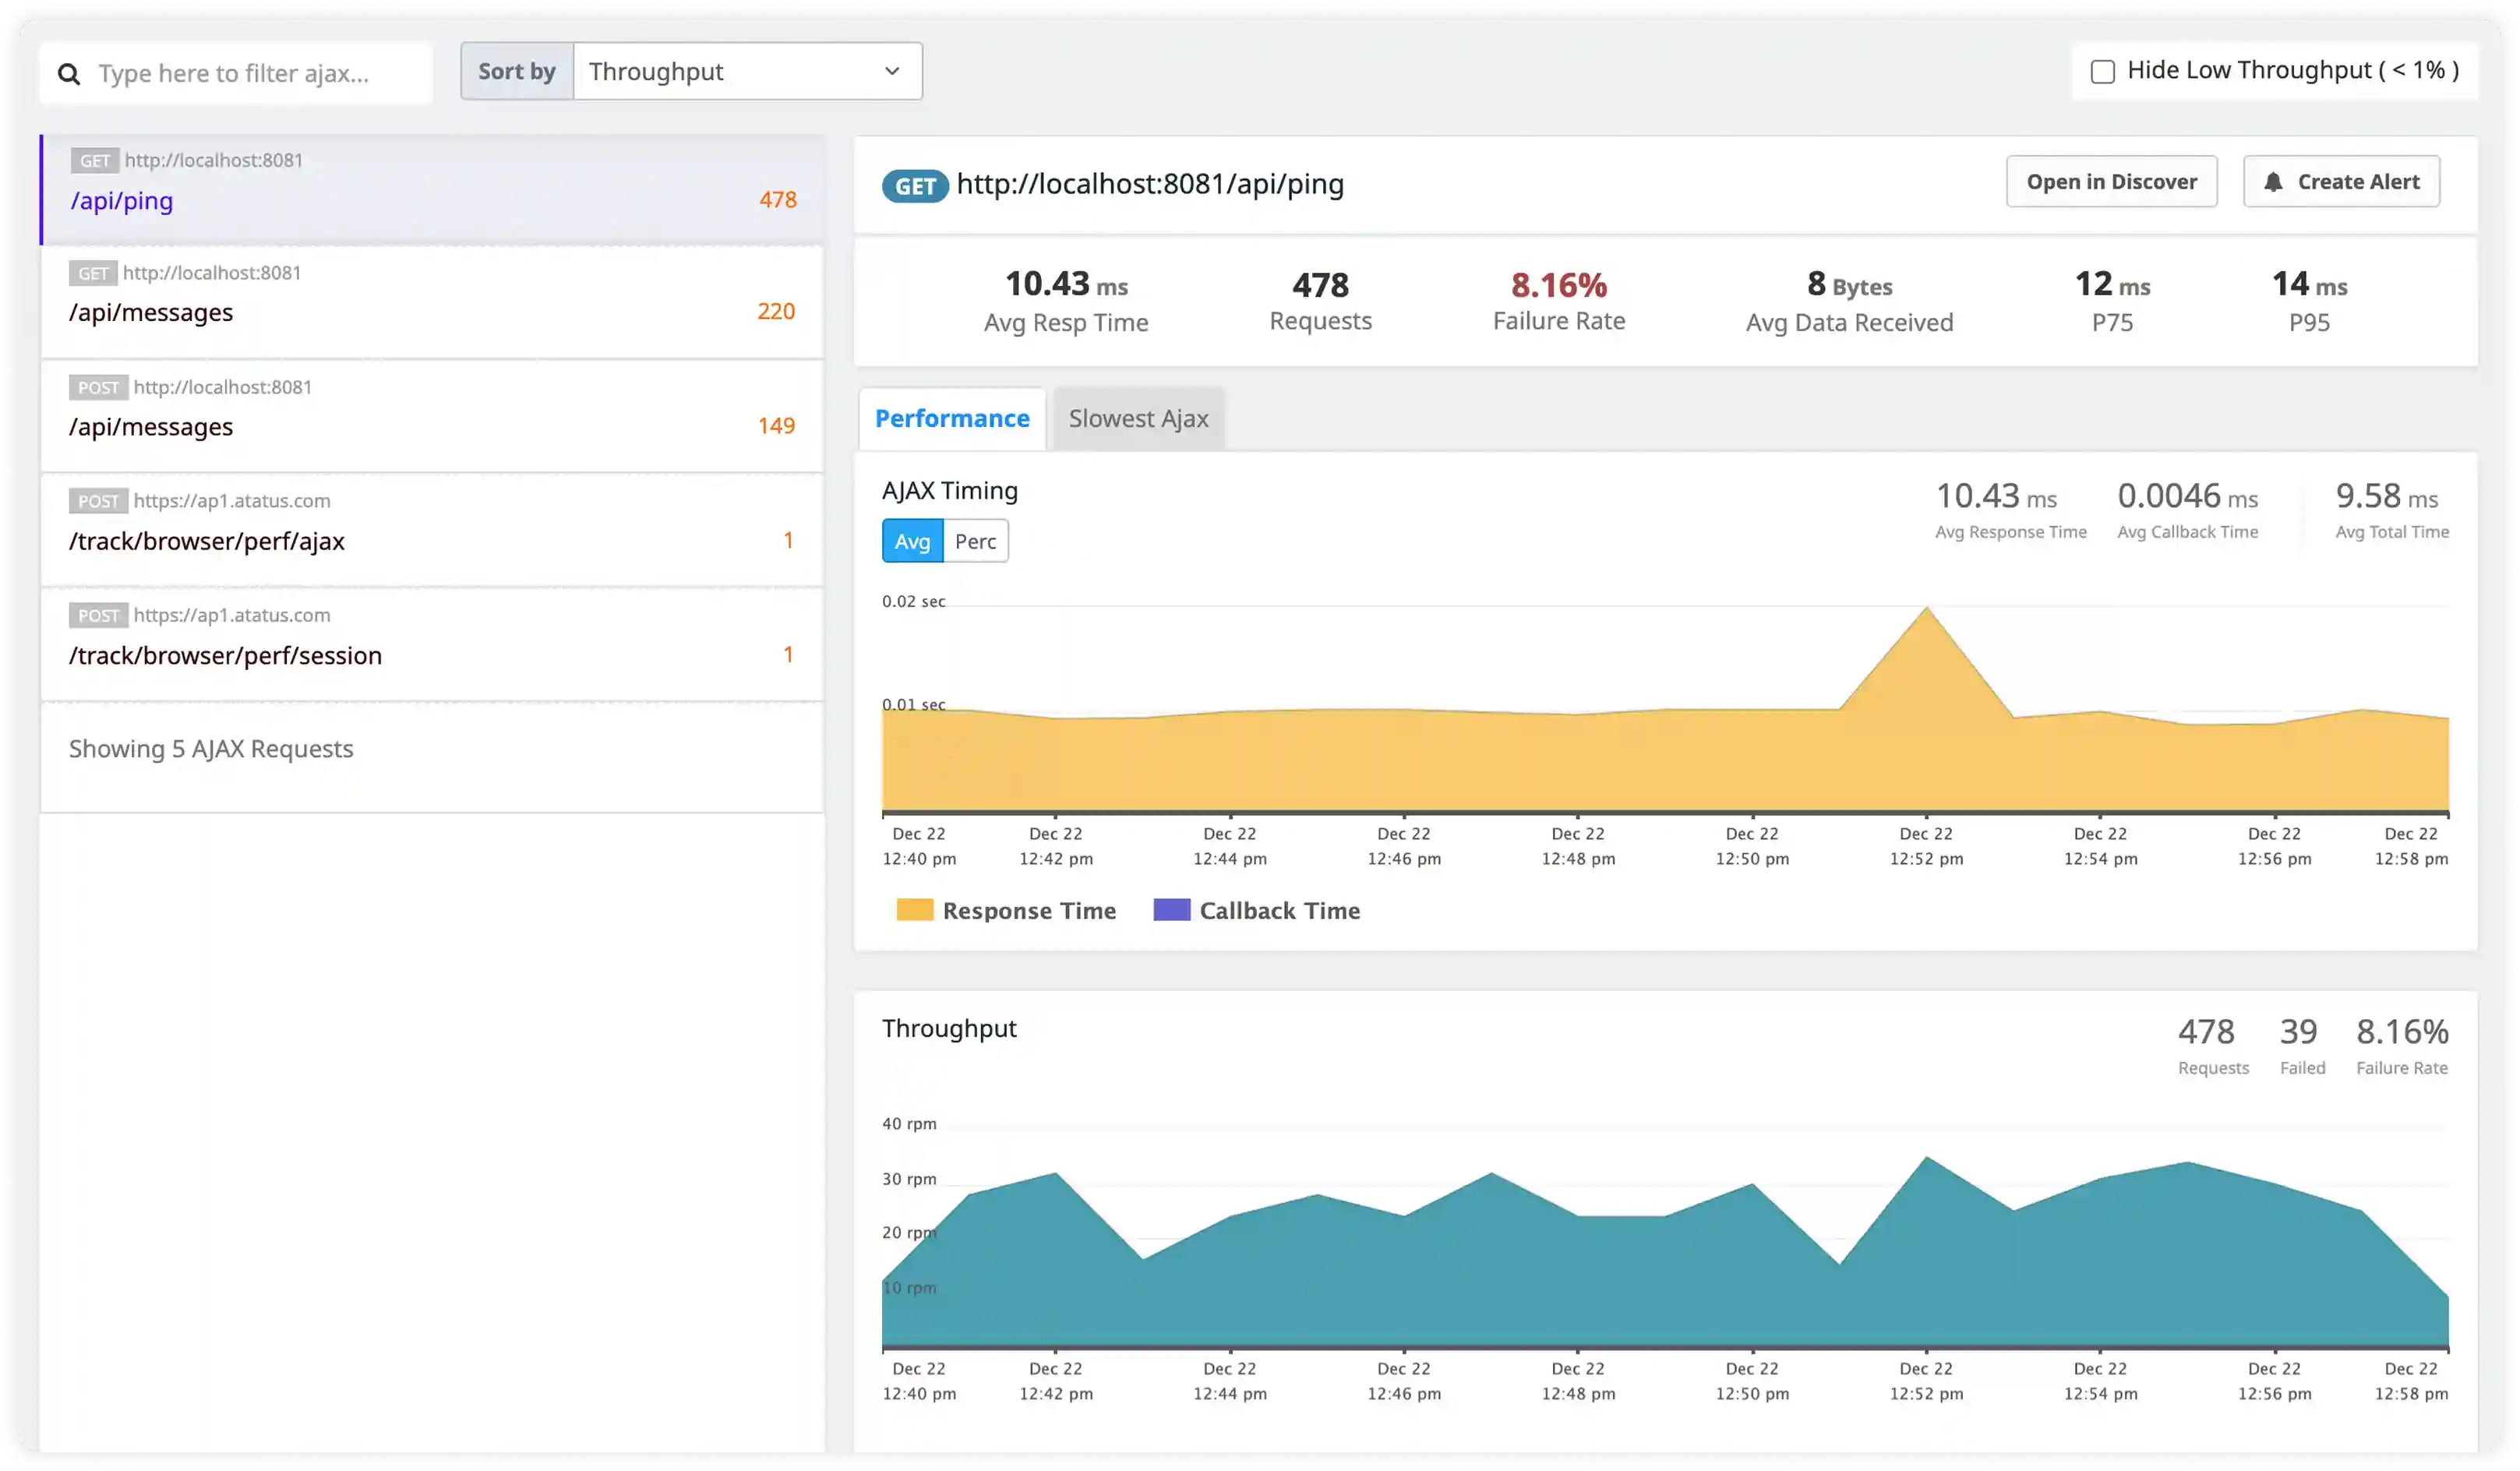
Track access activity, server behavior, performance signals, and security events across Apache web server environments in real time.
Monitor Apache logs to diagnose request handling and server stability issues
Analyze access log traffic
Inspect Apache access logs to understand request patterns, response codes, request latency, and client behavior.
Track server error logs
Capture Apache error log entries related to module failures, worker crashes, and runtime warnings.
Detect configuration issues
Monitor Apache logs generated during startup and reloads to identify syntax errors and invalid directives.
Monitor worker and process limits
Analyze Apache log messages related to MaxRequestWorkers, process exhaustion, and request queuing.
Track SSL and TLS failures
Capture Apache SSL logs to identify certificate errors, handshake failures, and protocol mismatches.
Observe proxy and rewrite behavior
Inspect logs generated by mod_proxy and mod_rewrite to troubleshoot routing and request rewriting issues.
Detect client and bot anomalies
Analyze Apache logs to identify abnormal traffic patterns, malformed requests, and abusive clients.
Correlate web and backend logs
Link Apache log entries with backend service logs to trace request failures across the stack.
Request and Access Activity
- Monitor Apache access logs capturing HTTP methods, URL paths, response codes, and client IPs to understand incoming traffic behavior across web applications.
- Correlate request logs with user sessions, application endpoints, and backend service interactions to trace request handling flow.
- Identify failed requests, repeated retries, and abnormal access spikes impacting response delivery.
- Detect disruptions in web traffic patterns that affect application availability and performance.

Server and Module Behavior
- Capture Apache error logs, module-level messages, and configuration events to observe runtime server behavior.
- Correlate module activity such as mod_rewrite, mod_proxy, and mod_ssl with request processing conditions.
- Identify misconfigurations, module failures, and runtime exceptions affecting web server stability.
- Detect operational issues impacting request routing and overall service reliability.

Performance and Resource Utilization
- Analyze request processing time, worker thread usage, and connection handling logs influencing Apache performance.
- Correlate concurrency levels, traffic bursts, and backend dependency response times with observed latency patterns.
- Identify slow responses, connection saturation, and resource contention that reduce throughput.
- Detect performance degradation through abnormal request timing and server workload behavior.

Security and Access Monitoring
- Track suspicious request patterns, unauthorized access attempts, and malformed requests captured in Apache logs.
- Identify brute-force attacks, exploit scans, and abnormal traffic sources impacting web application security.
- Correlate access logs with infrastructure and application events for security incident investigation.
- Detect operational and security risks affecting Apache-based deployments.

Why teams choose Atatus for Apache logs monitoring
Apache-native parsing
Atatus automatically interprets Apache access and error logs without custom patterns or configuration.
Unified traffic visibility
Atatus shows request volume, status codes, and error trends across all Apache servers.
Faster incident triage
Atatus isolates HTTP errors, worker exhaustion, and configuration issues using indexed logs.
Real-time alerting
Atatus notifies teams on traffic spikes, repeated failures, and service degradation.
Cross-stack correlation
Atatus connects Apache logs with backend application and database activity for full tracing.
Secure retention
Atatus stores Apache logs long-term for historical analysis and recurring issue detection.
Unified Observability for Every Engineering Team
Atatus adapts to how engineering teams work across development, operations, and reliability.
Developers
Trace requests, debug errors, and identify performance issues at the code level with clear context.
DevOps
Track deployments, monitor infrastructure impact, and understand how releases affect application stability.
Release Engineer
Measure service health, latency, and error rates to maintain reliability and reduce production risk.