End-to-End Request Routing and Proxy Execution Visibility
Understand backend routing behavior, concurrency pressure, and traffic anomalies affecting service delivery.
Monitor NGINX logs to troubleshoot traffic flow and reverse proxy issues
Analyze access log requests
Inspect NGINX access logs to understand request volume, upstream response times, and HTTP status distribution.
Track upstream failures
Monitor NGINX error logs for upstream connection failures, timeouts, and bad gateway errors.
Detect configuration reload issues
Analyze NGINX startup and reload logs to identify invalid directives and syntax errors.
Monitor rate limiting events
Capture NGINX logs generated by rate limiting and request throttling rules.
Track SSL handshake problems
Inspect NGINX SSL logs to detect certificate issues and TLS negotiation failures.
Observe load balancing behavior
Analyze logs related to upstream selection and retry logic to understand traffic distribution.
Detect abnormal client behavior
Identify malformed requests, excessive retries, and suspicious traffic patterns from access logs.
Correlate edge and backend logs
Link NGINX log entries with backend service logs for end-to-end request tracing.
Request Flow and Traffic Behavior
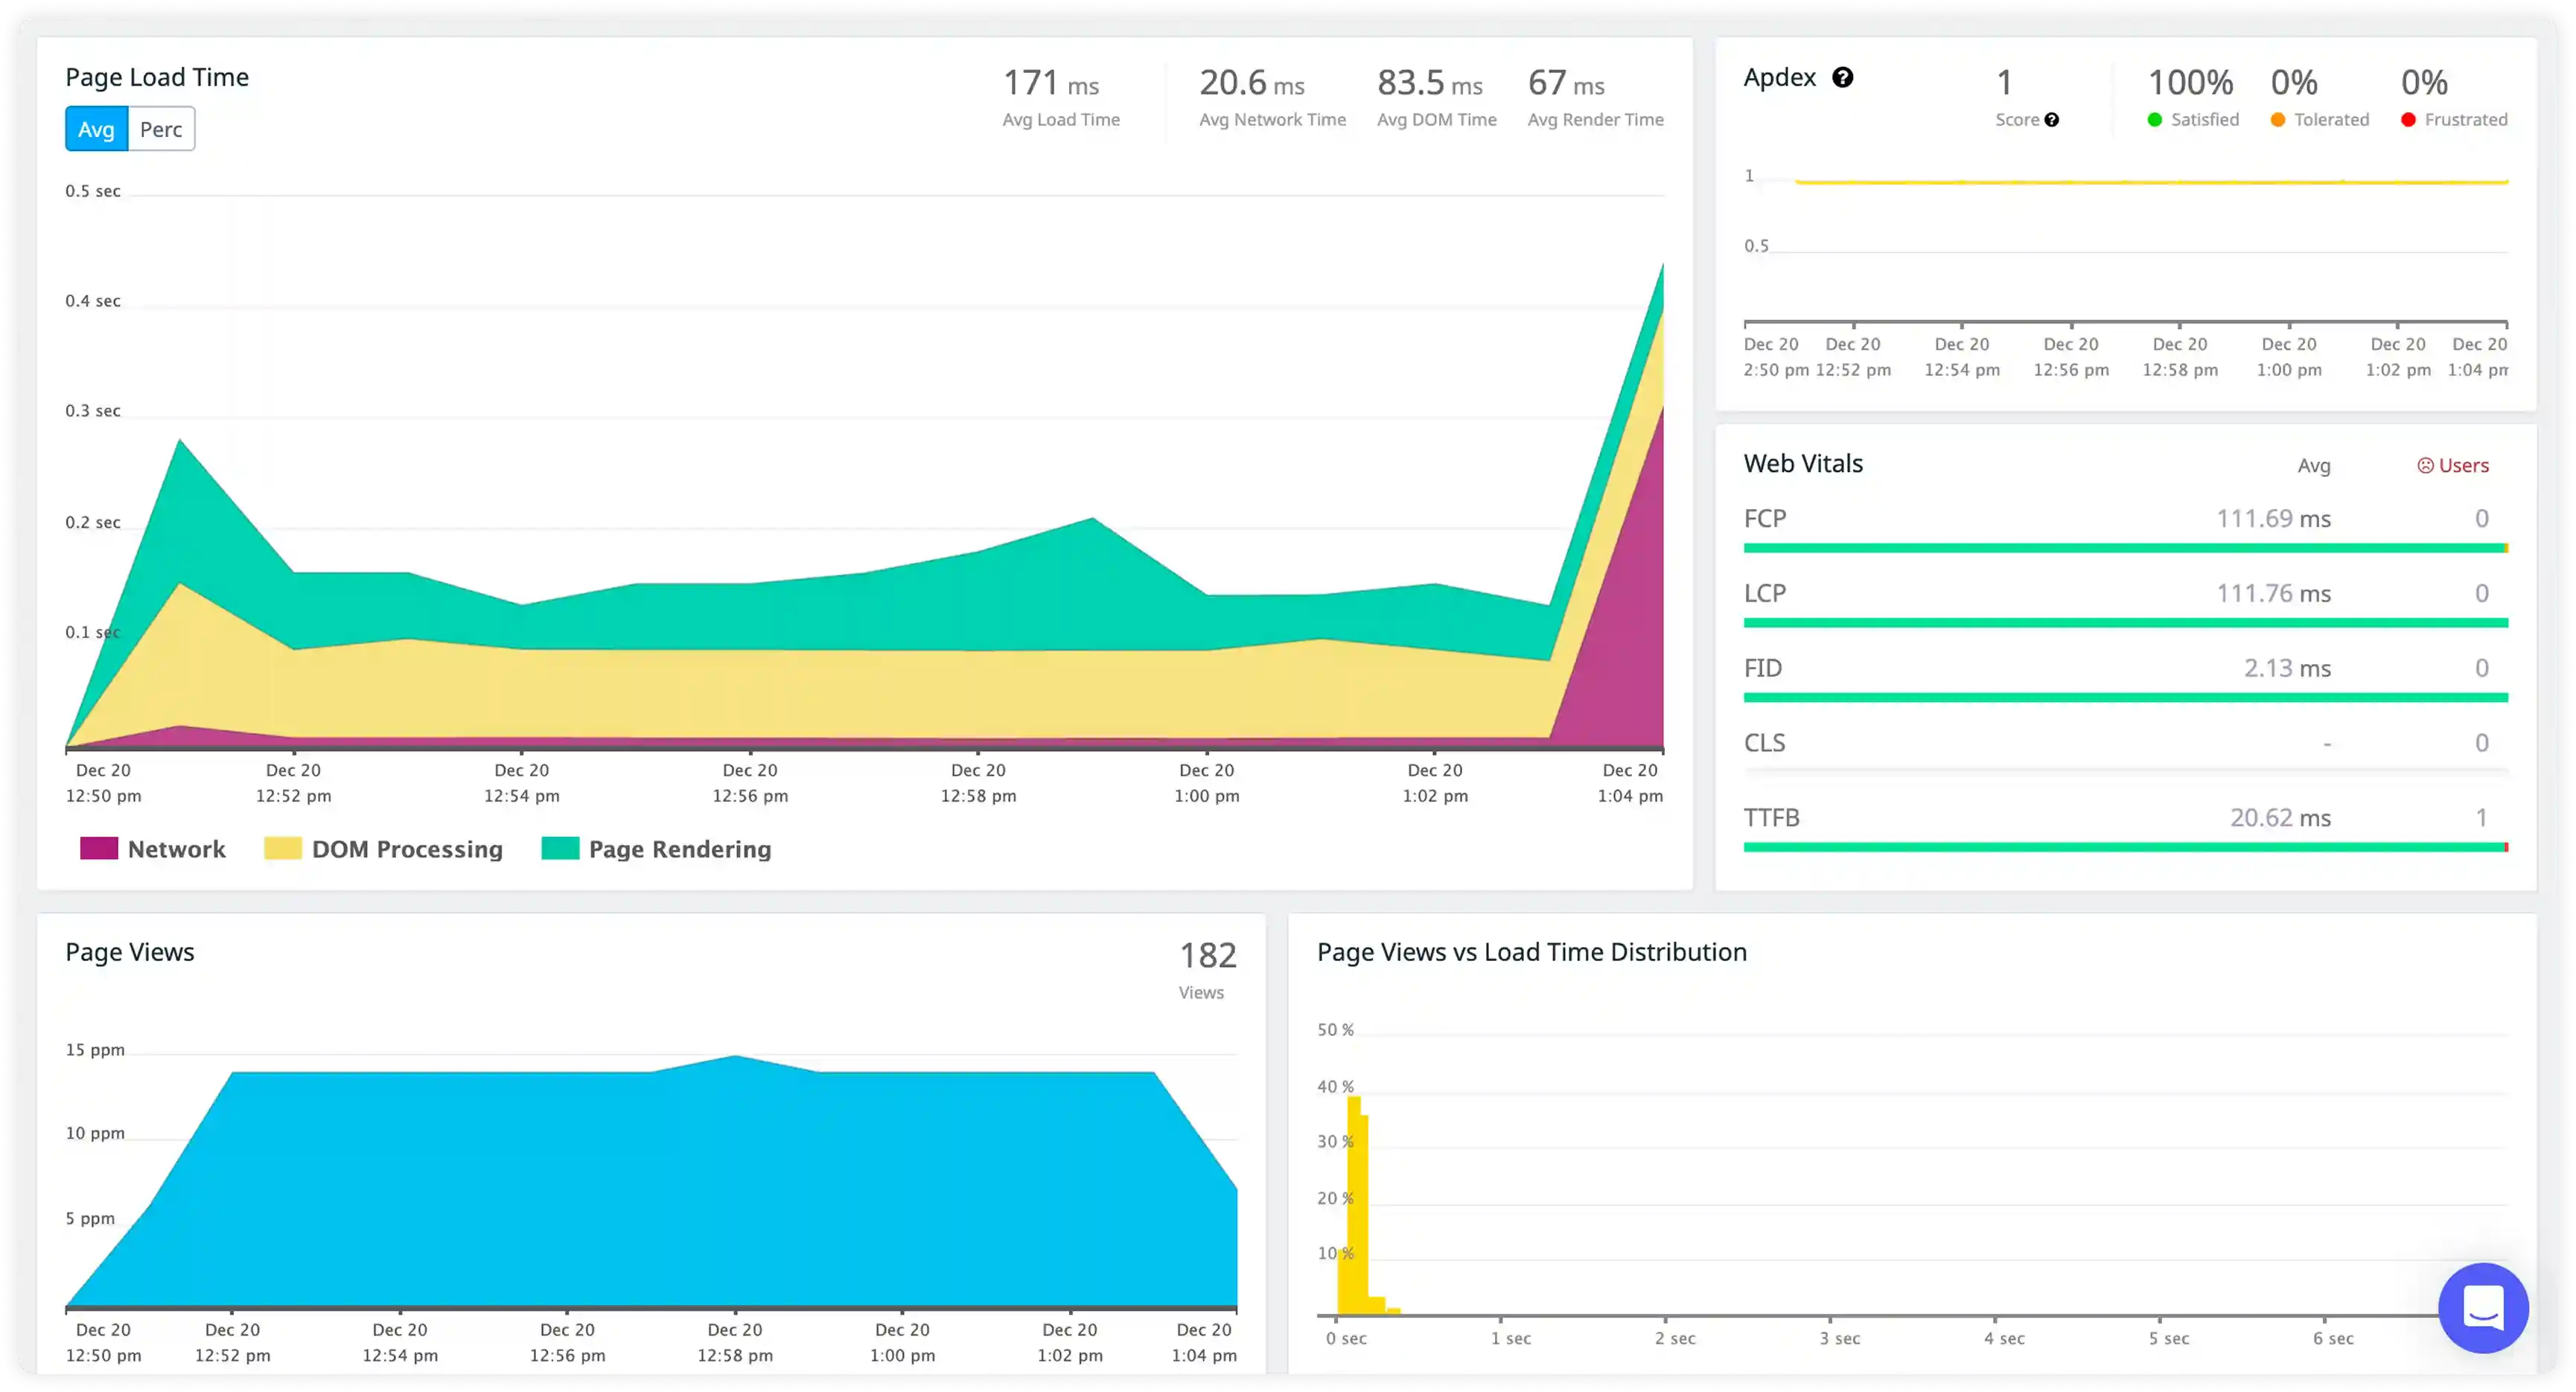
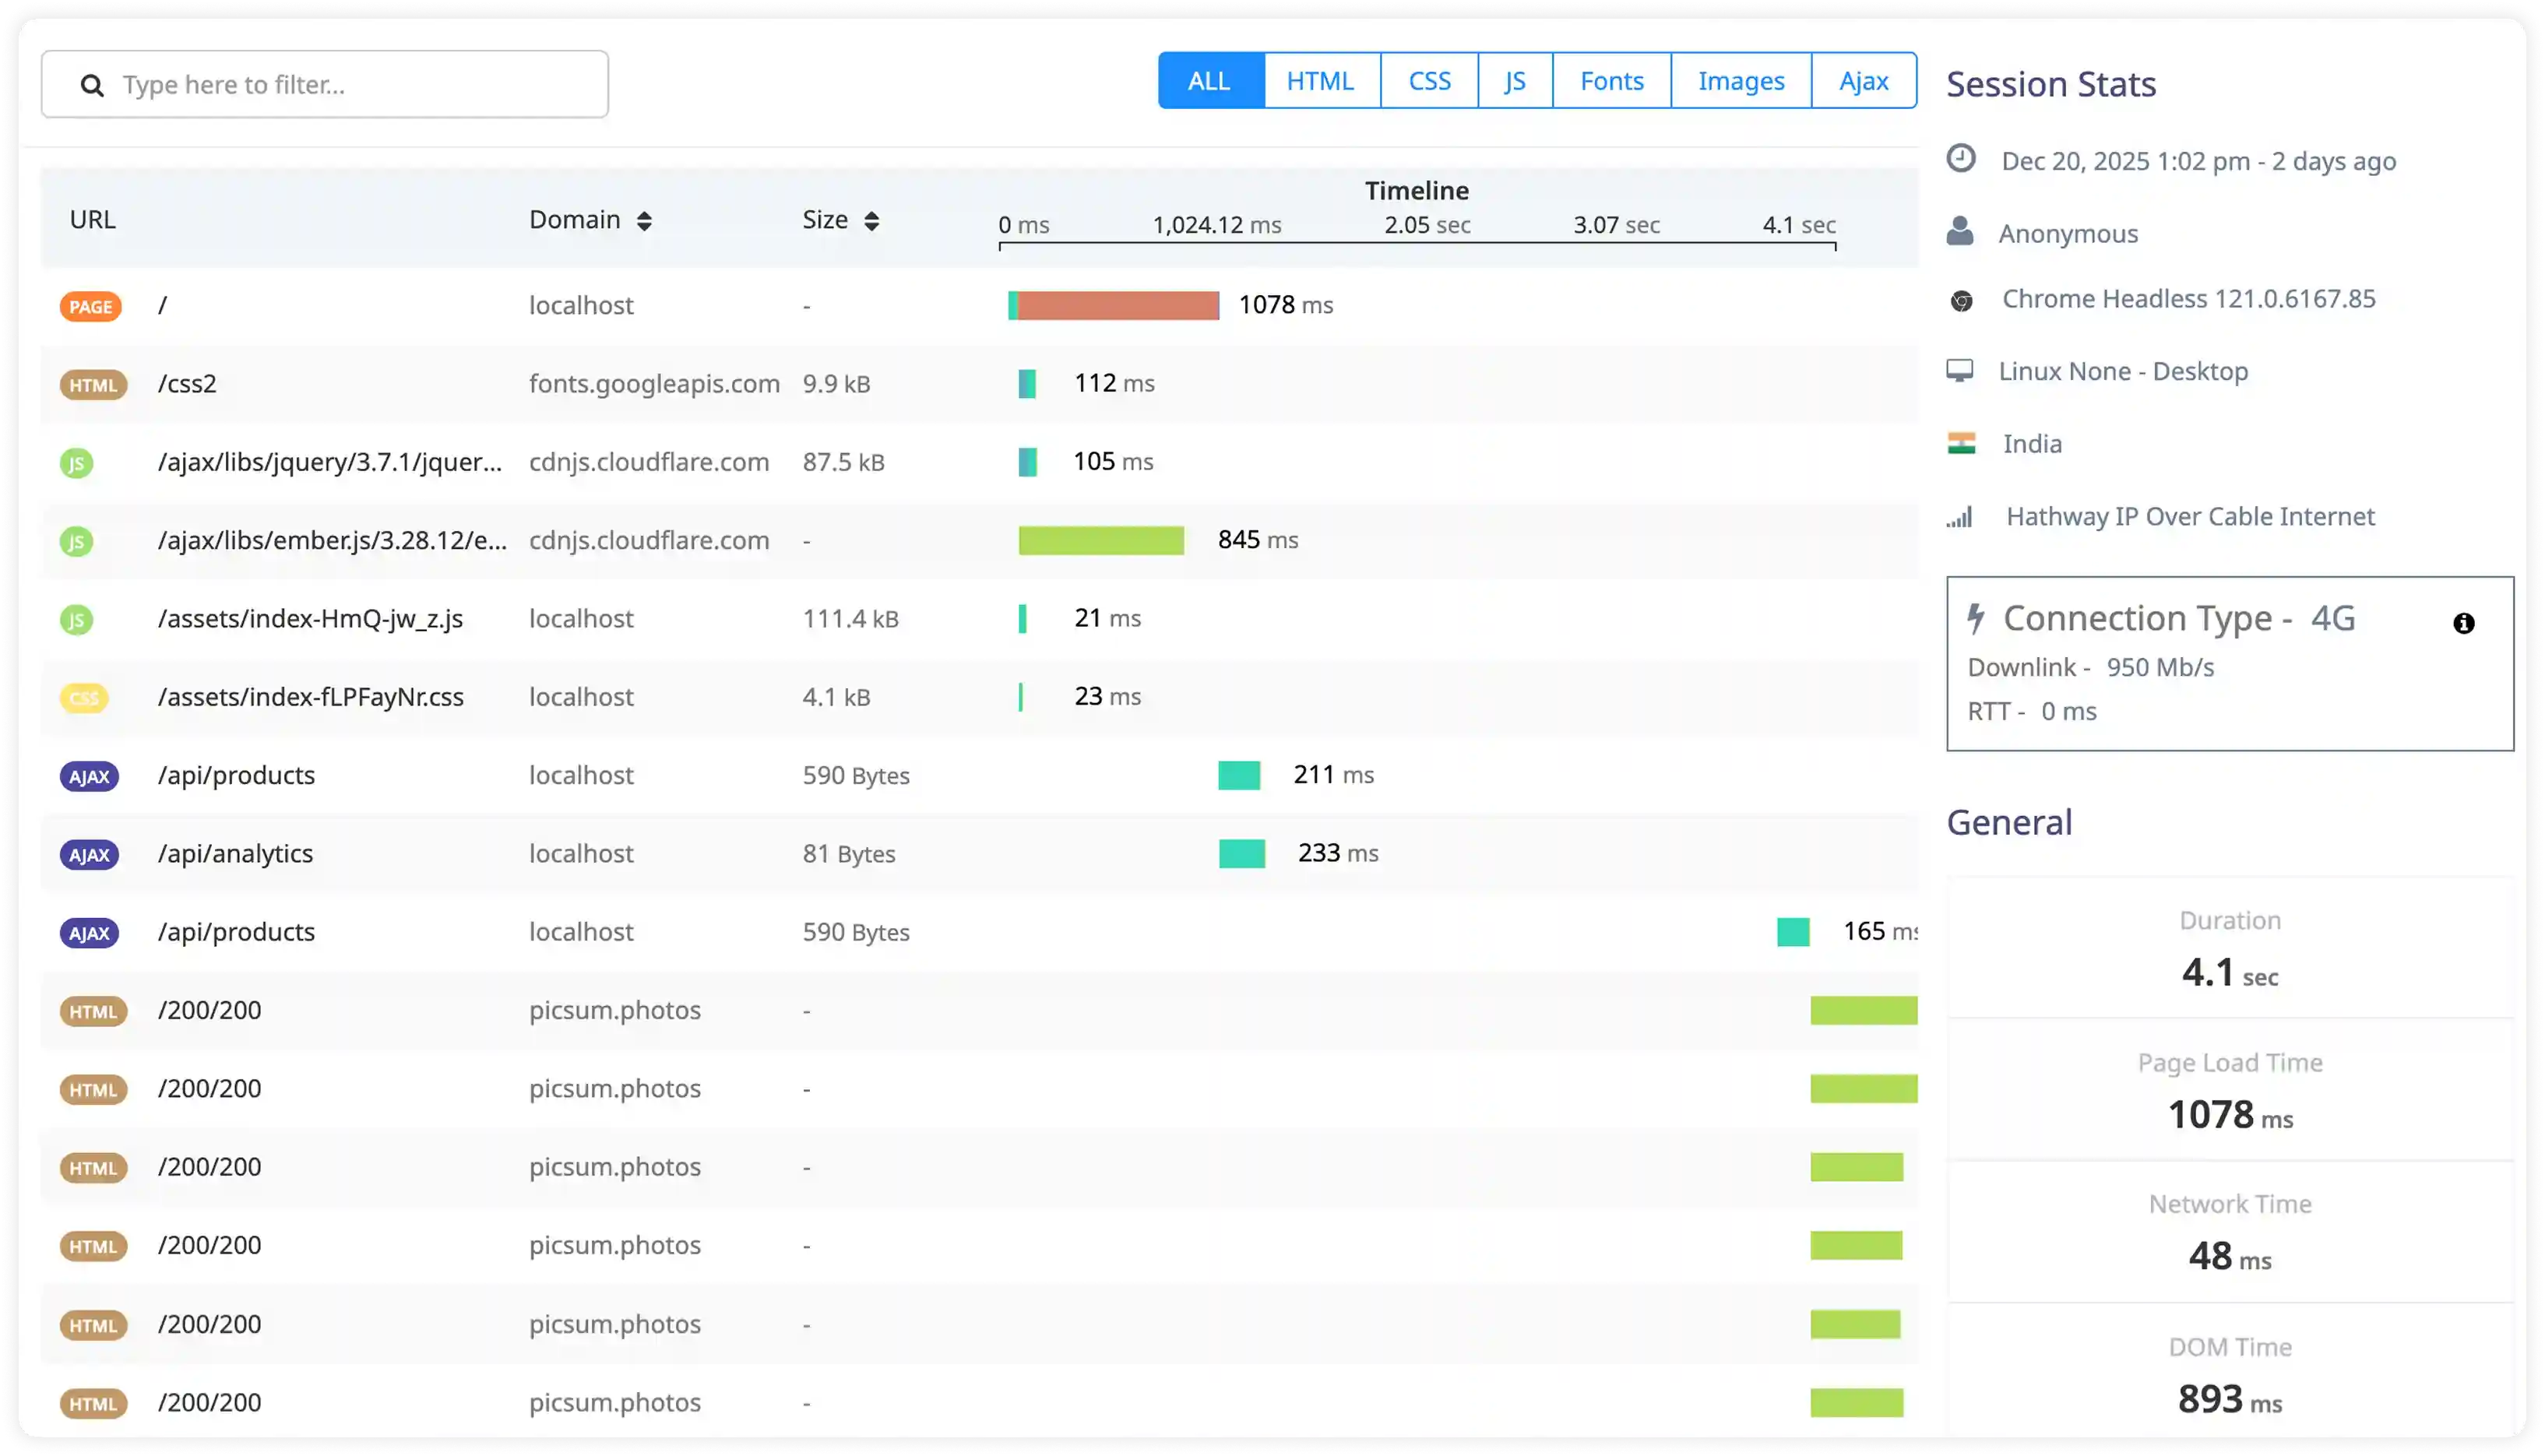
- Monitor Nginx access logs capturing HTTP methods, upstream routing details, response status codes, and client connection patterns to understand traffic distribution across web services.
- Correlate request paths, upstream responses, and load-balancer decisions to trace end-to-end request handling flow.
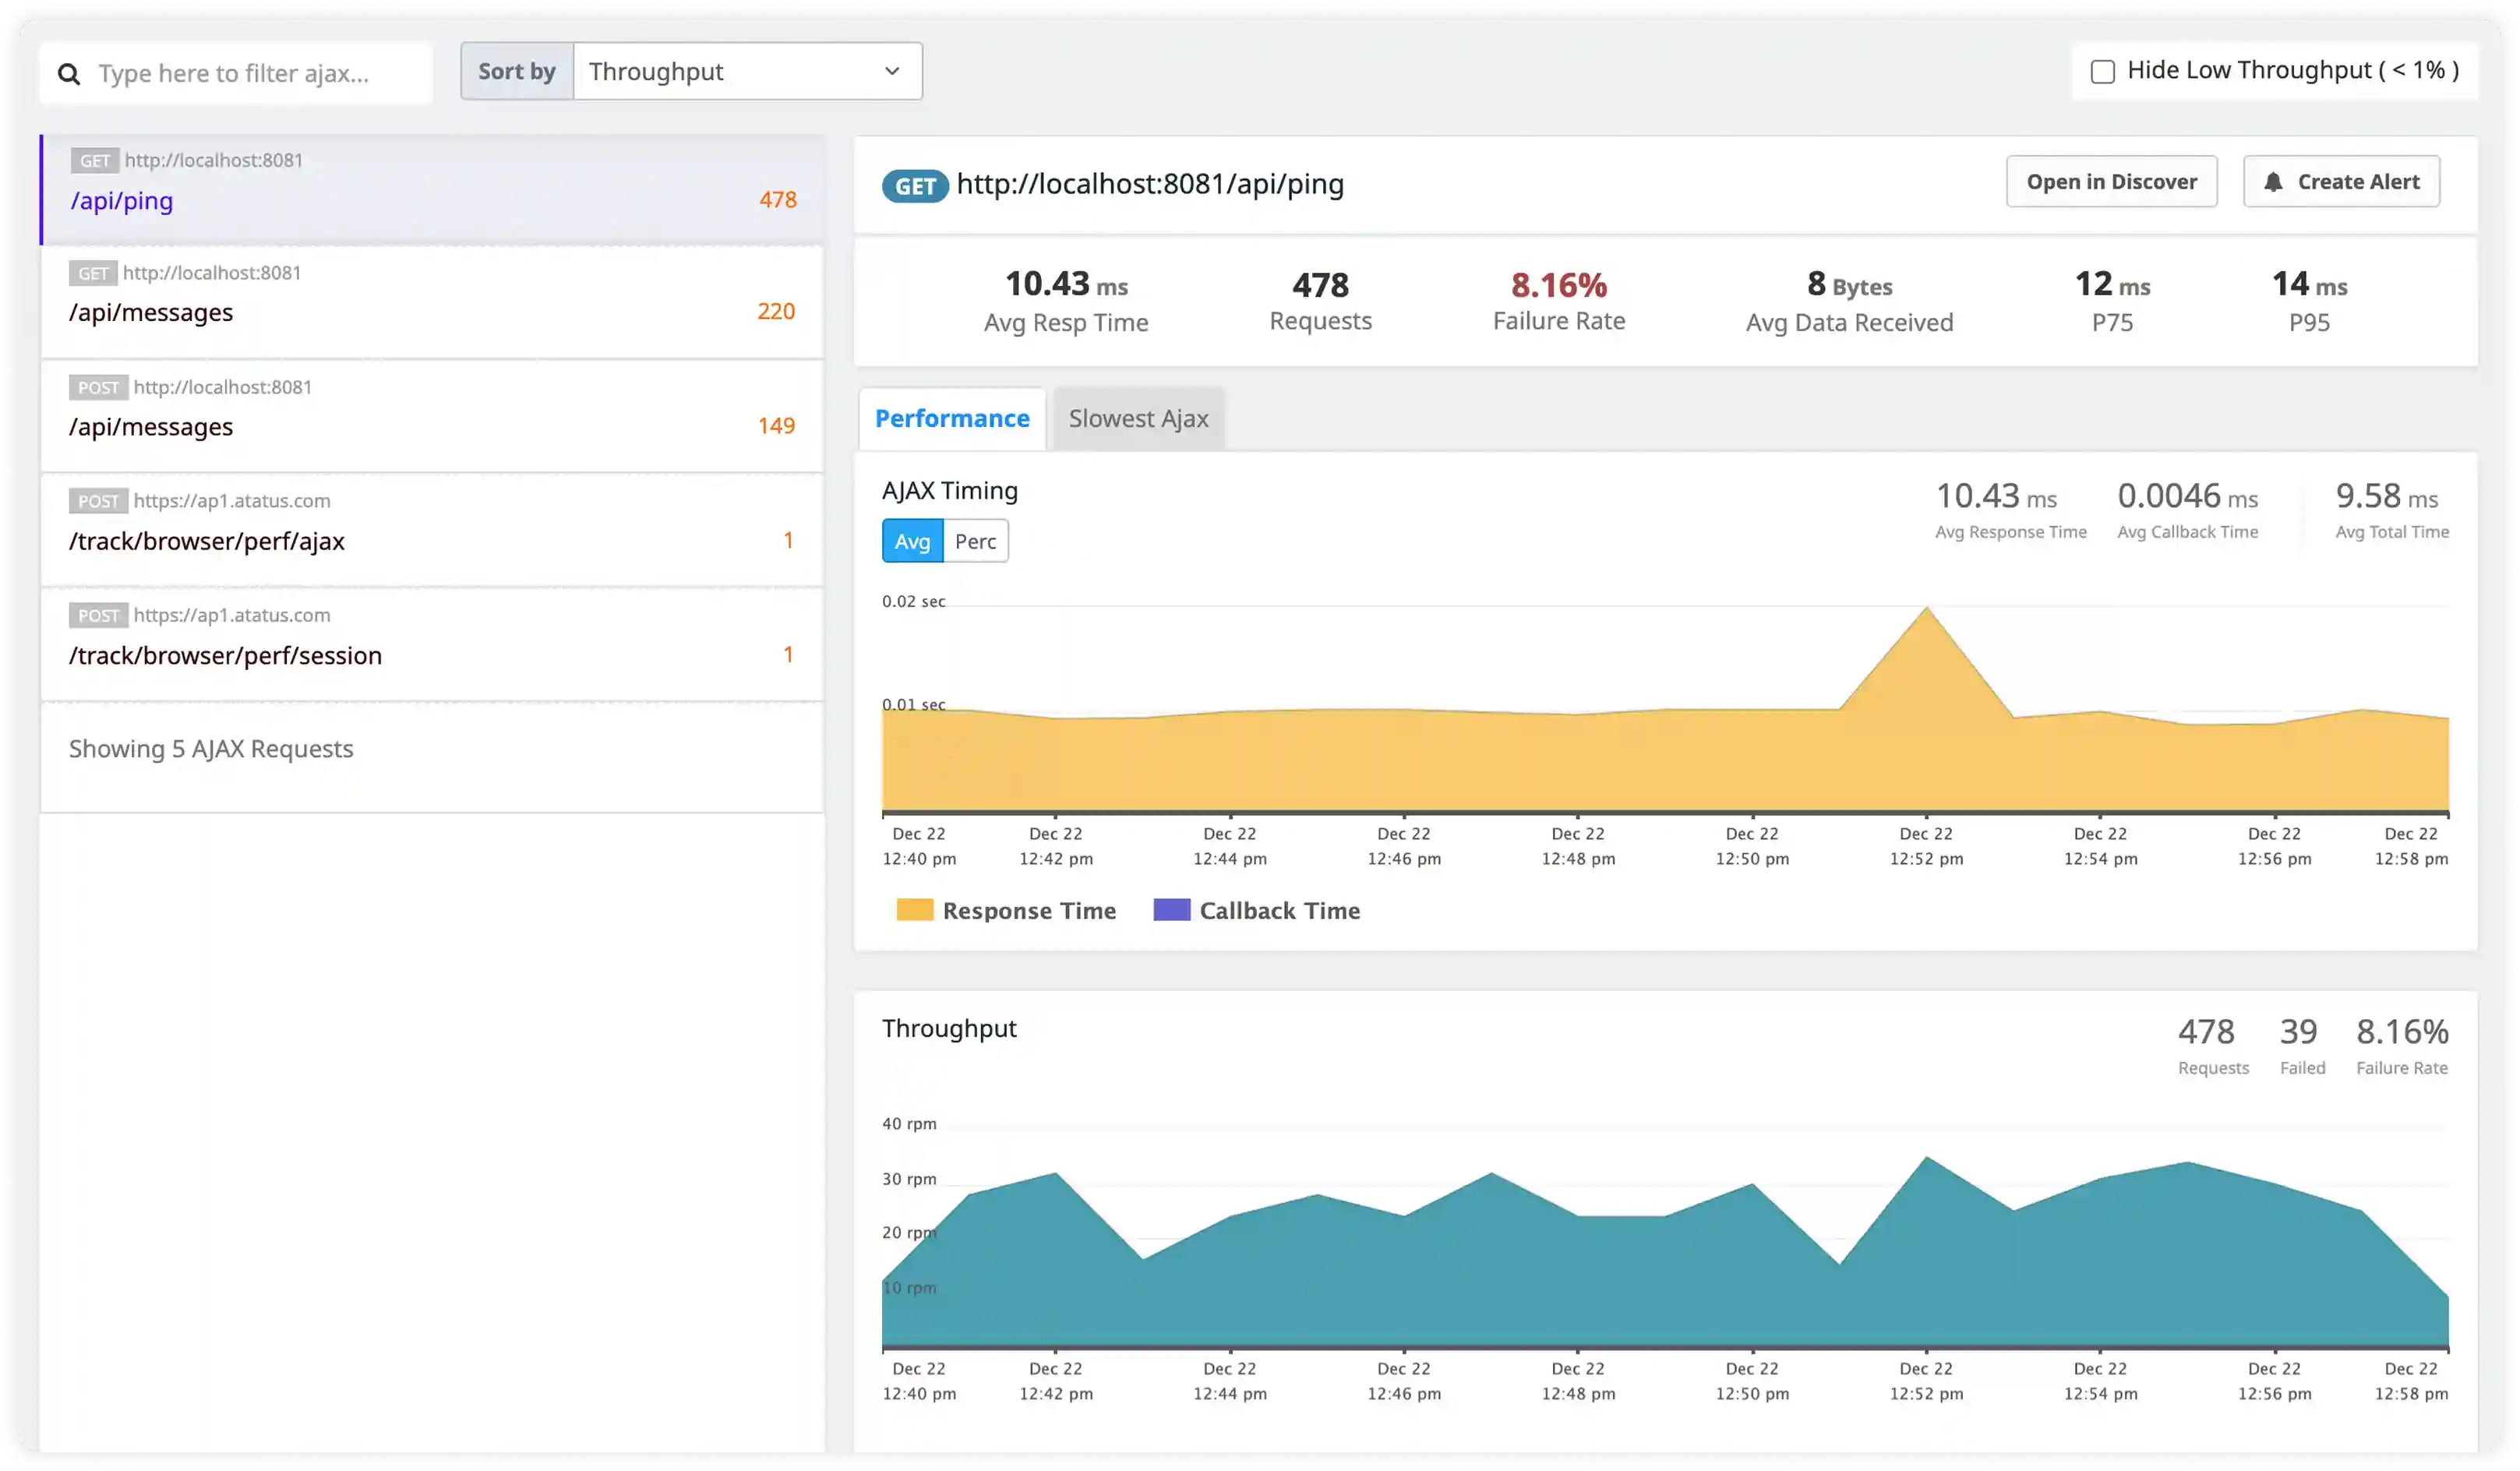
- Identify failed requests, upstream timeouts, and abnormal traffic bursts impacting response delivery.
- Detect disruptions in request flow that affect application availability and overall service reliability.

Upstream and Proxy Activity
- Capture proxy logs, upstream server communication events, and load-balancing behavior across backend services.
- Correlate upstream latency, connection retries, and backend health status with changing traffic conditions.
- Identify gateway errors, upstream failures, and routing inconsistencies impacting request processing.
- Detect operational risks affecting reverse proxy stability and backend service accessibility.

Performance and Connection Signals
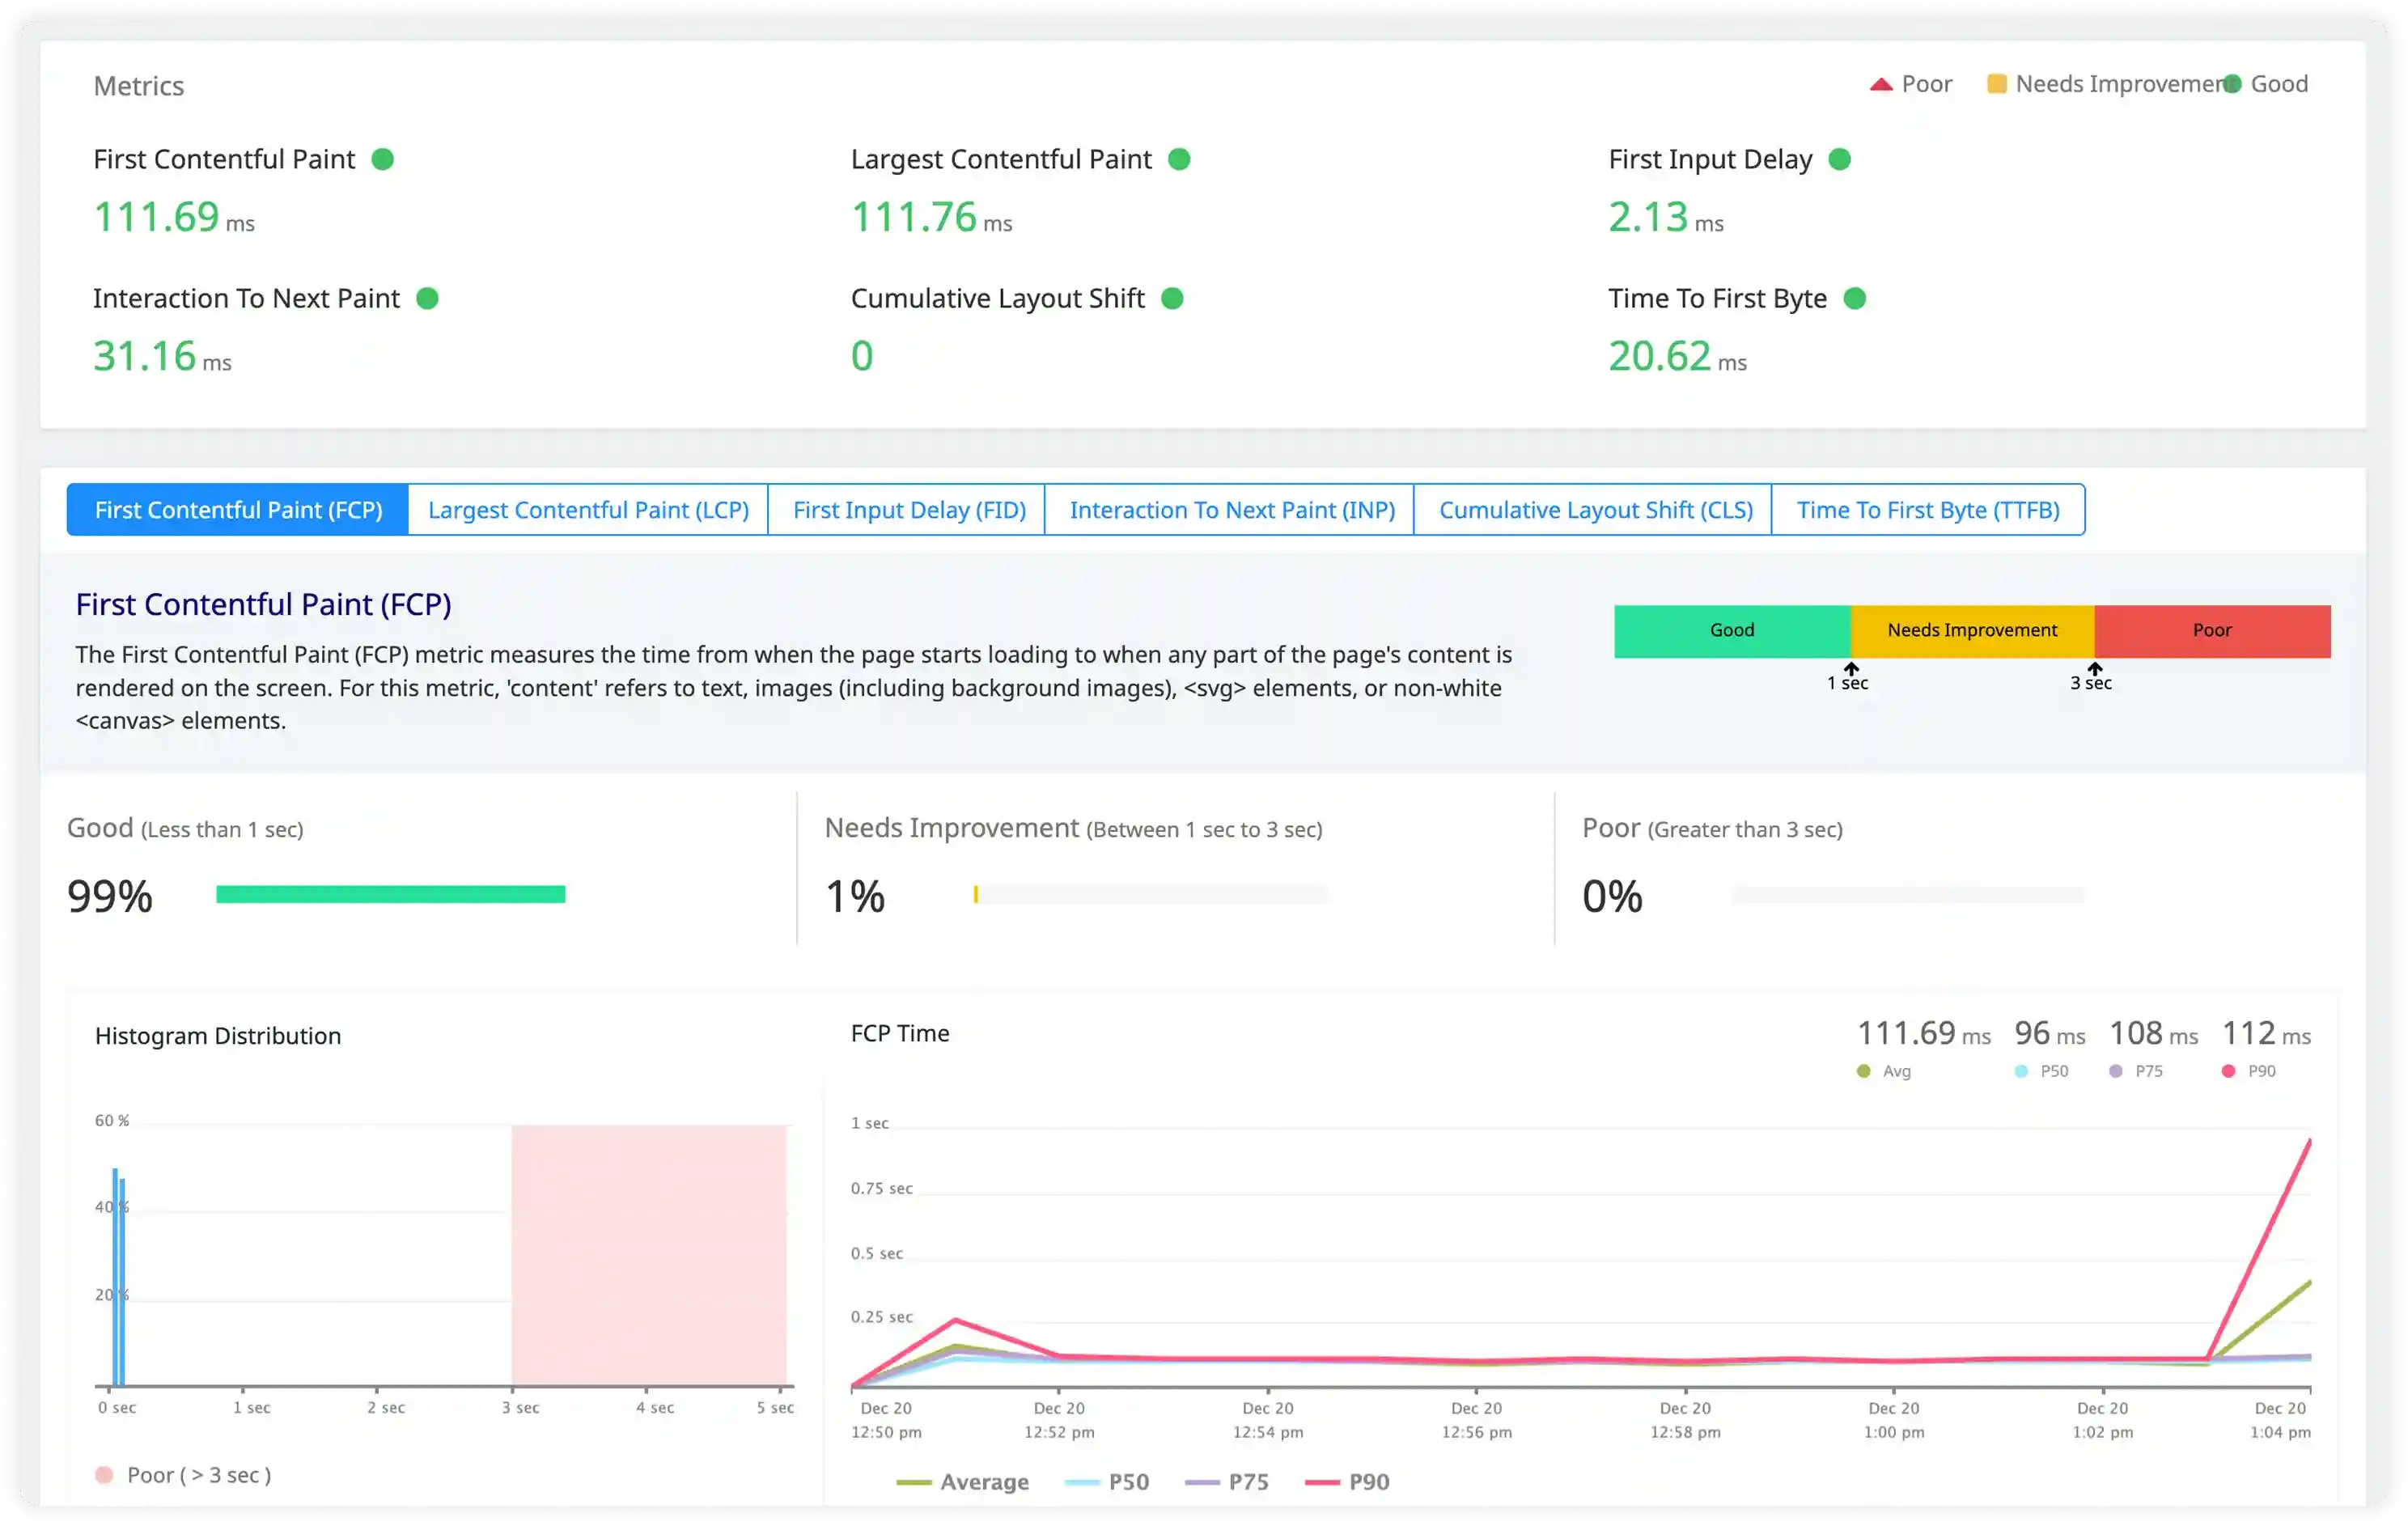
- Analyze connection handling logs, worker process behavior, and request processing time influencing Nginx performance.
- Correlate concurrency levels, keepalive usage, and network I/O behavior with throughput patterns.
- Identify connection saturation, slow upstream responses, and resource contention increasing latency.
- Detect performance degradation through abnormal request timing and irregular connection patterns.

Security and Access Monitoring
- Track suspicious requests, authentication failures, and unusual client behavior captured in Nginx logs.
- Identify exploit attempts, bot traffic, and unauthorized access patterns impacting application security.
- Correlate access activity with infrastructure and application events for security investigation.
- Detect operational and security risks affecting Nginx deployments.

Why teams choose Atatus for NGINX logs monitoring
NGINX-native parsing
Atatus interprets NGINX access and error logs with upstream and request-level context automatically.
Edge traffic visibility
Atatus centralizes logs from all NGINX instances handling ingress and proxy traffic.
Faster root cause analysis
Atatus quickly identifies upstream failures, timeouts, and configuration issues.
Real-time alerting
Atatus triggers alerts on 4xx and 5xx spikes, timeouts, and rejected requests.
Backend correlation
Atatus links NGINX events with backend service logs for end-to-end tracing.
High-volume ingestion
Atatus reliably handles NGINX log surges during traffic peaks and deployments.
Unified Observability for Every Engineering Team
Atatus adapts to how engineering teams work across development, operations, and reliability.
Developers
Trace requests, debug errors, and identify performance issues at the code level with clear context.
DevOps
Track deployments, monitor infrastructure impact, and understand how releases affect application stability.
Release Engineer
Measure service health, latency, and error rates to maintain reliability and reduce production risk.