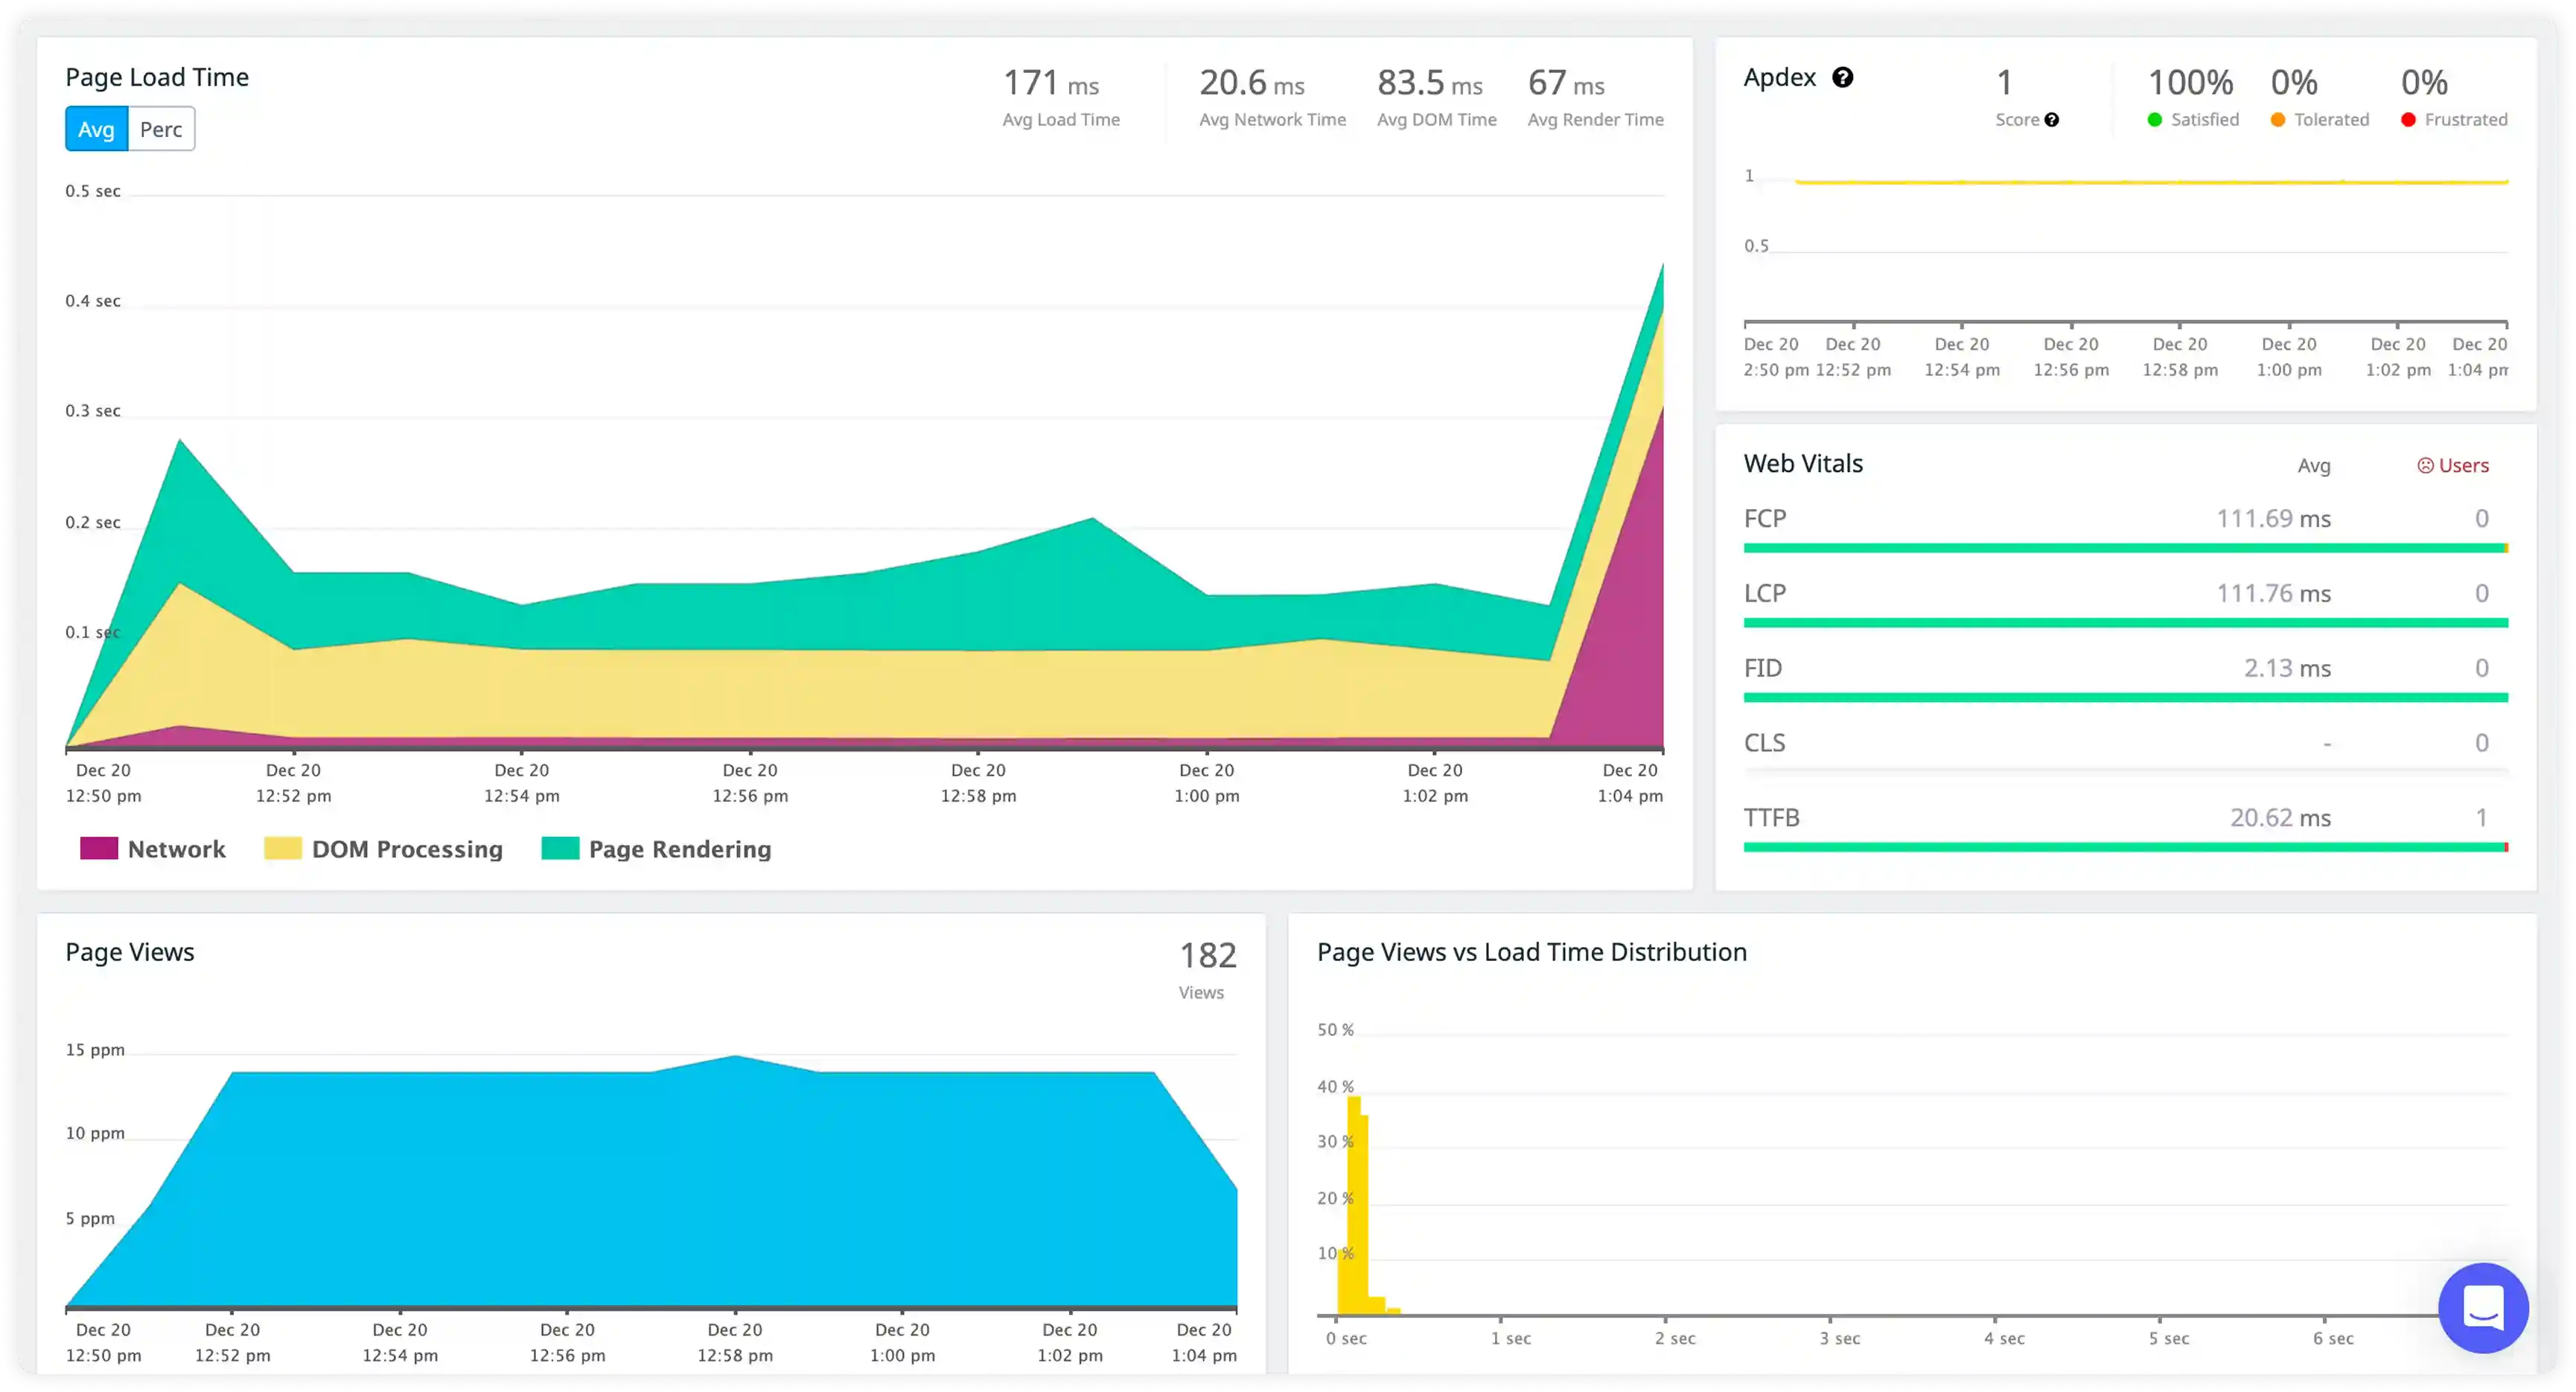
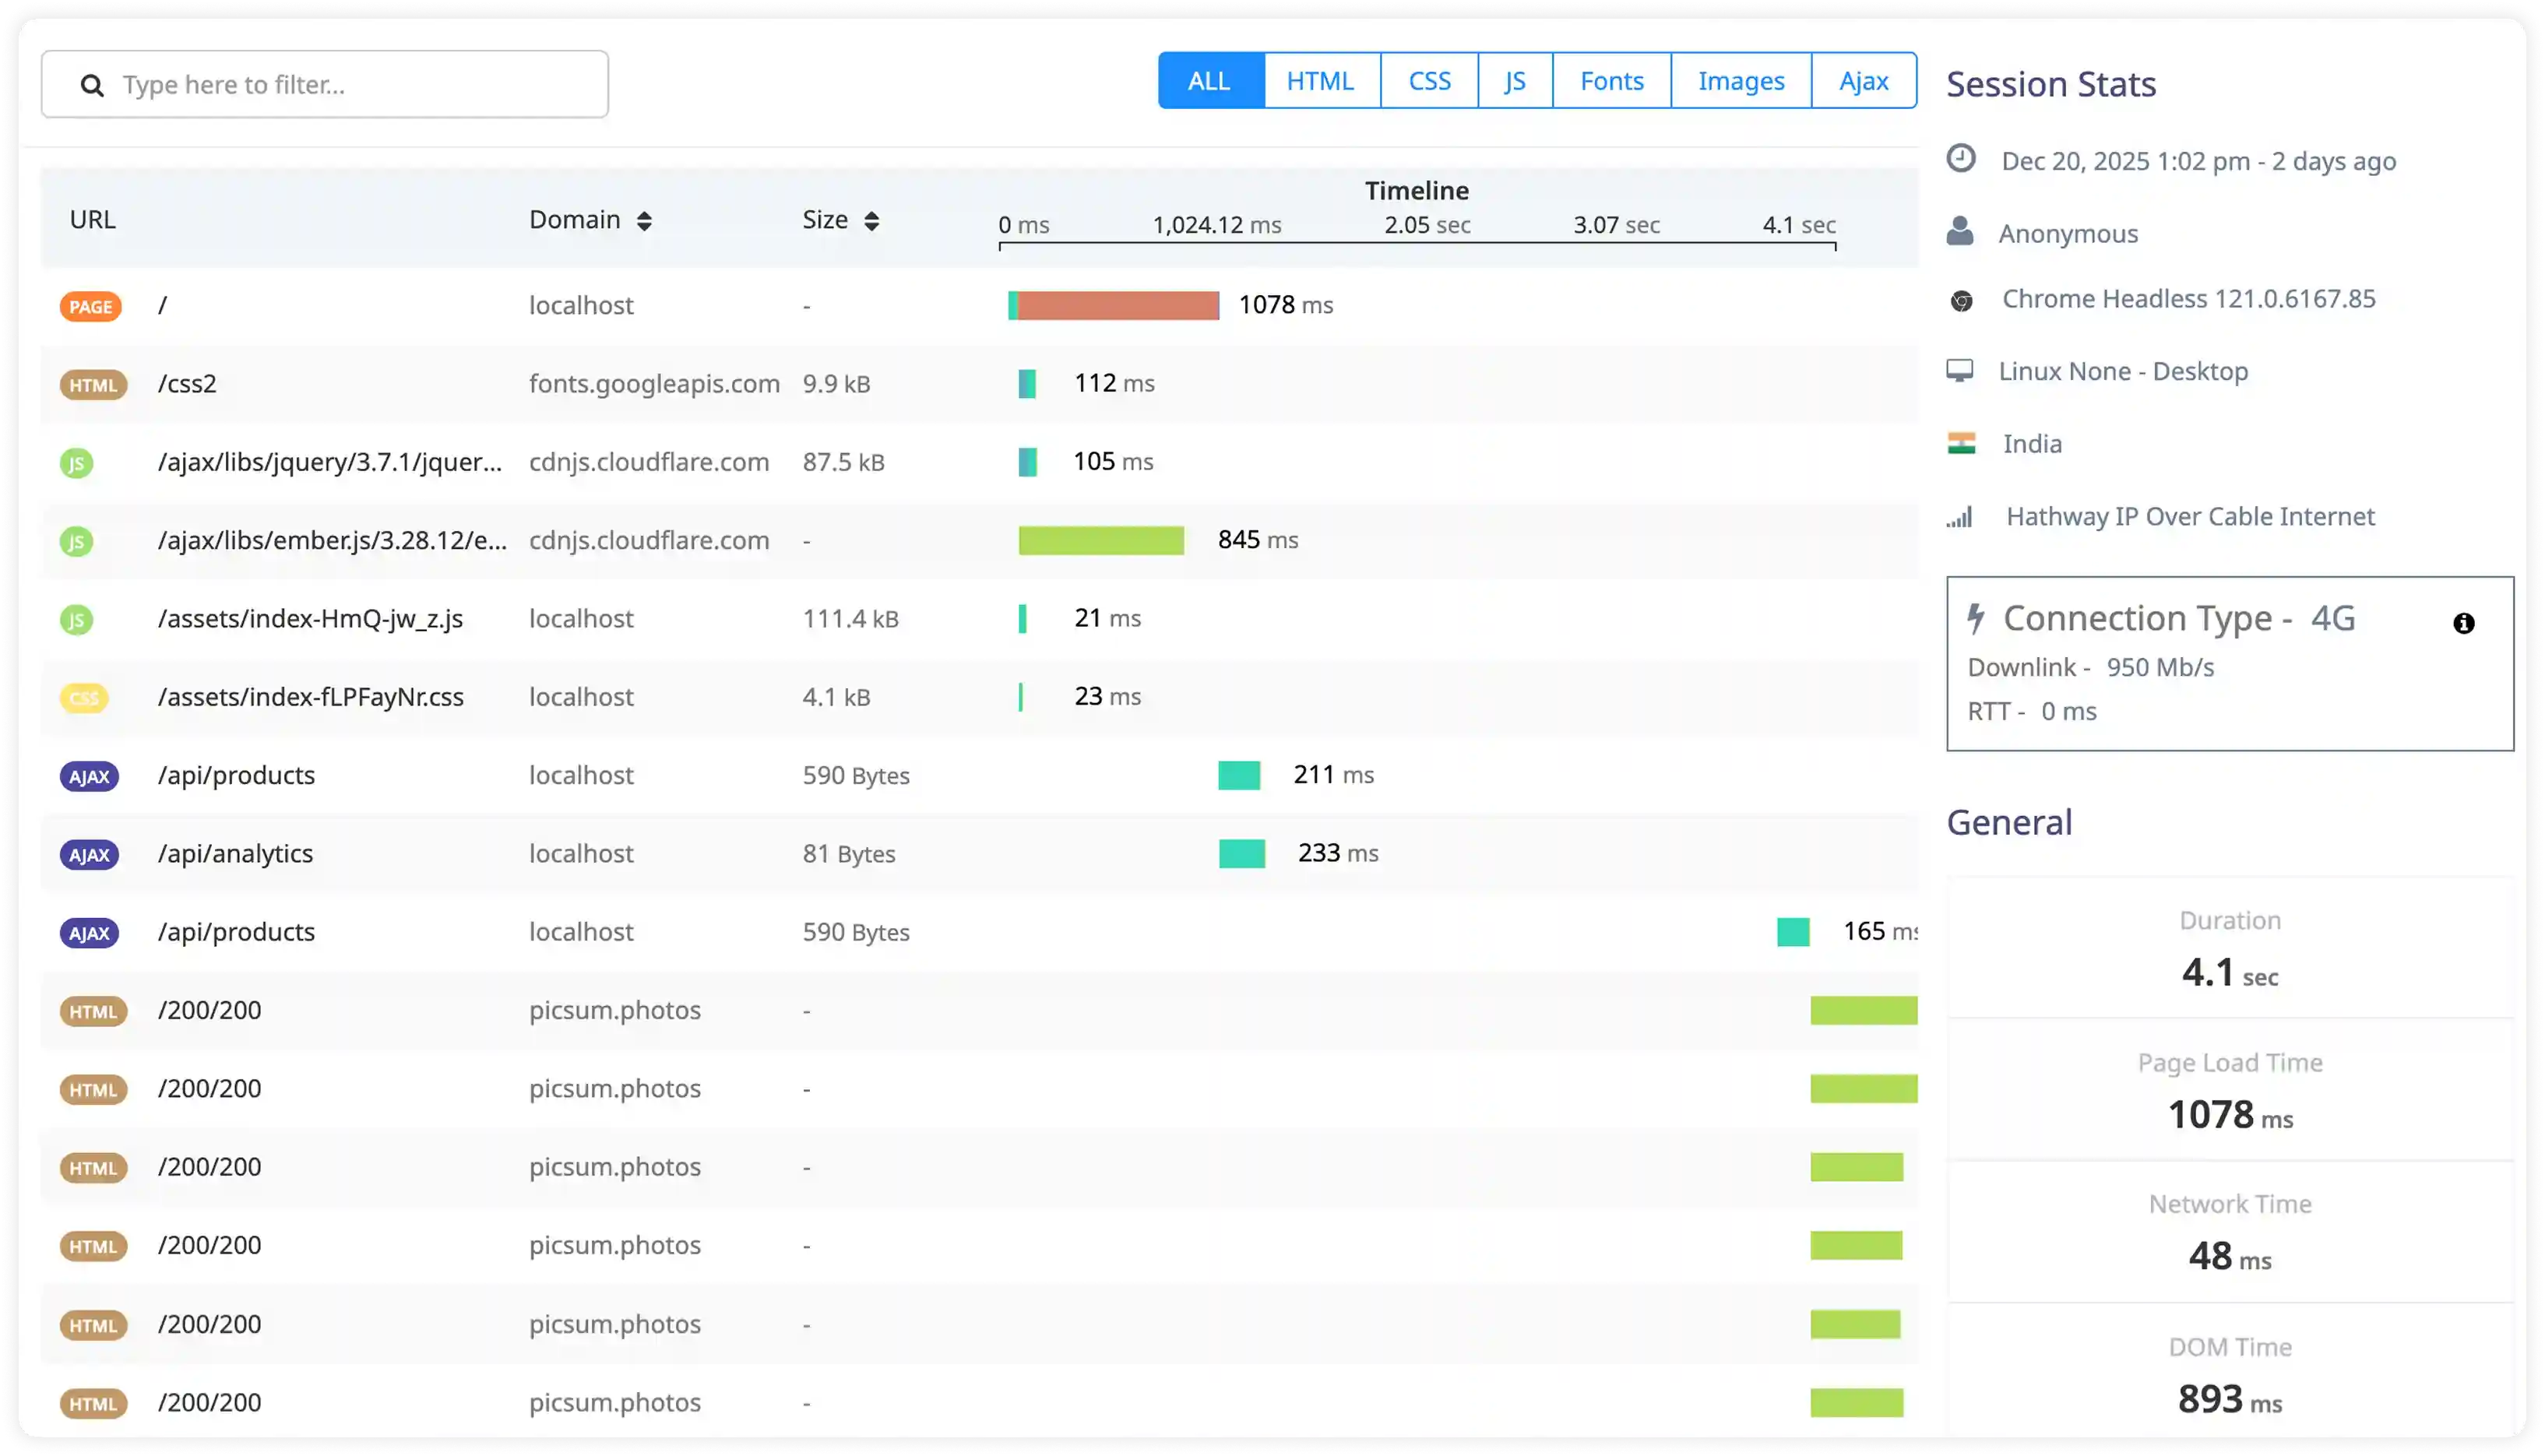
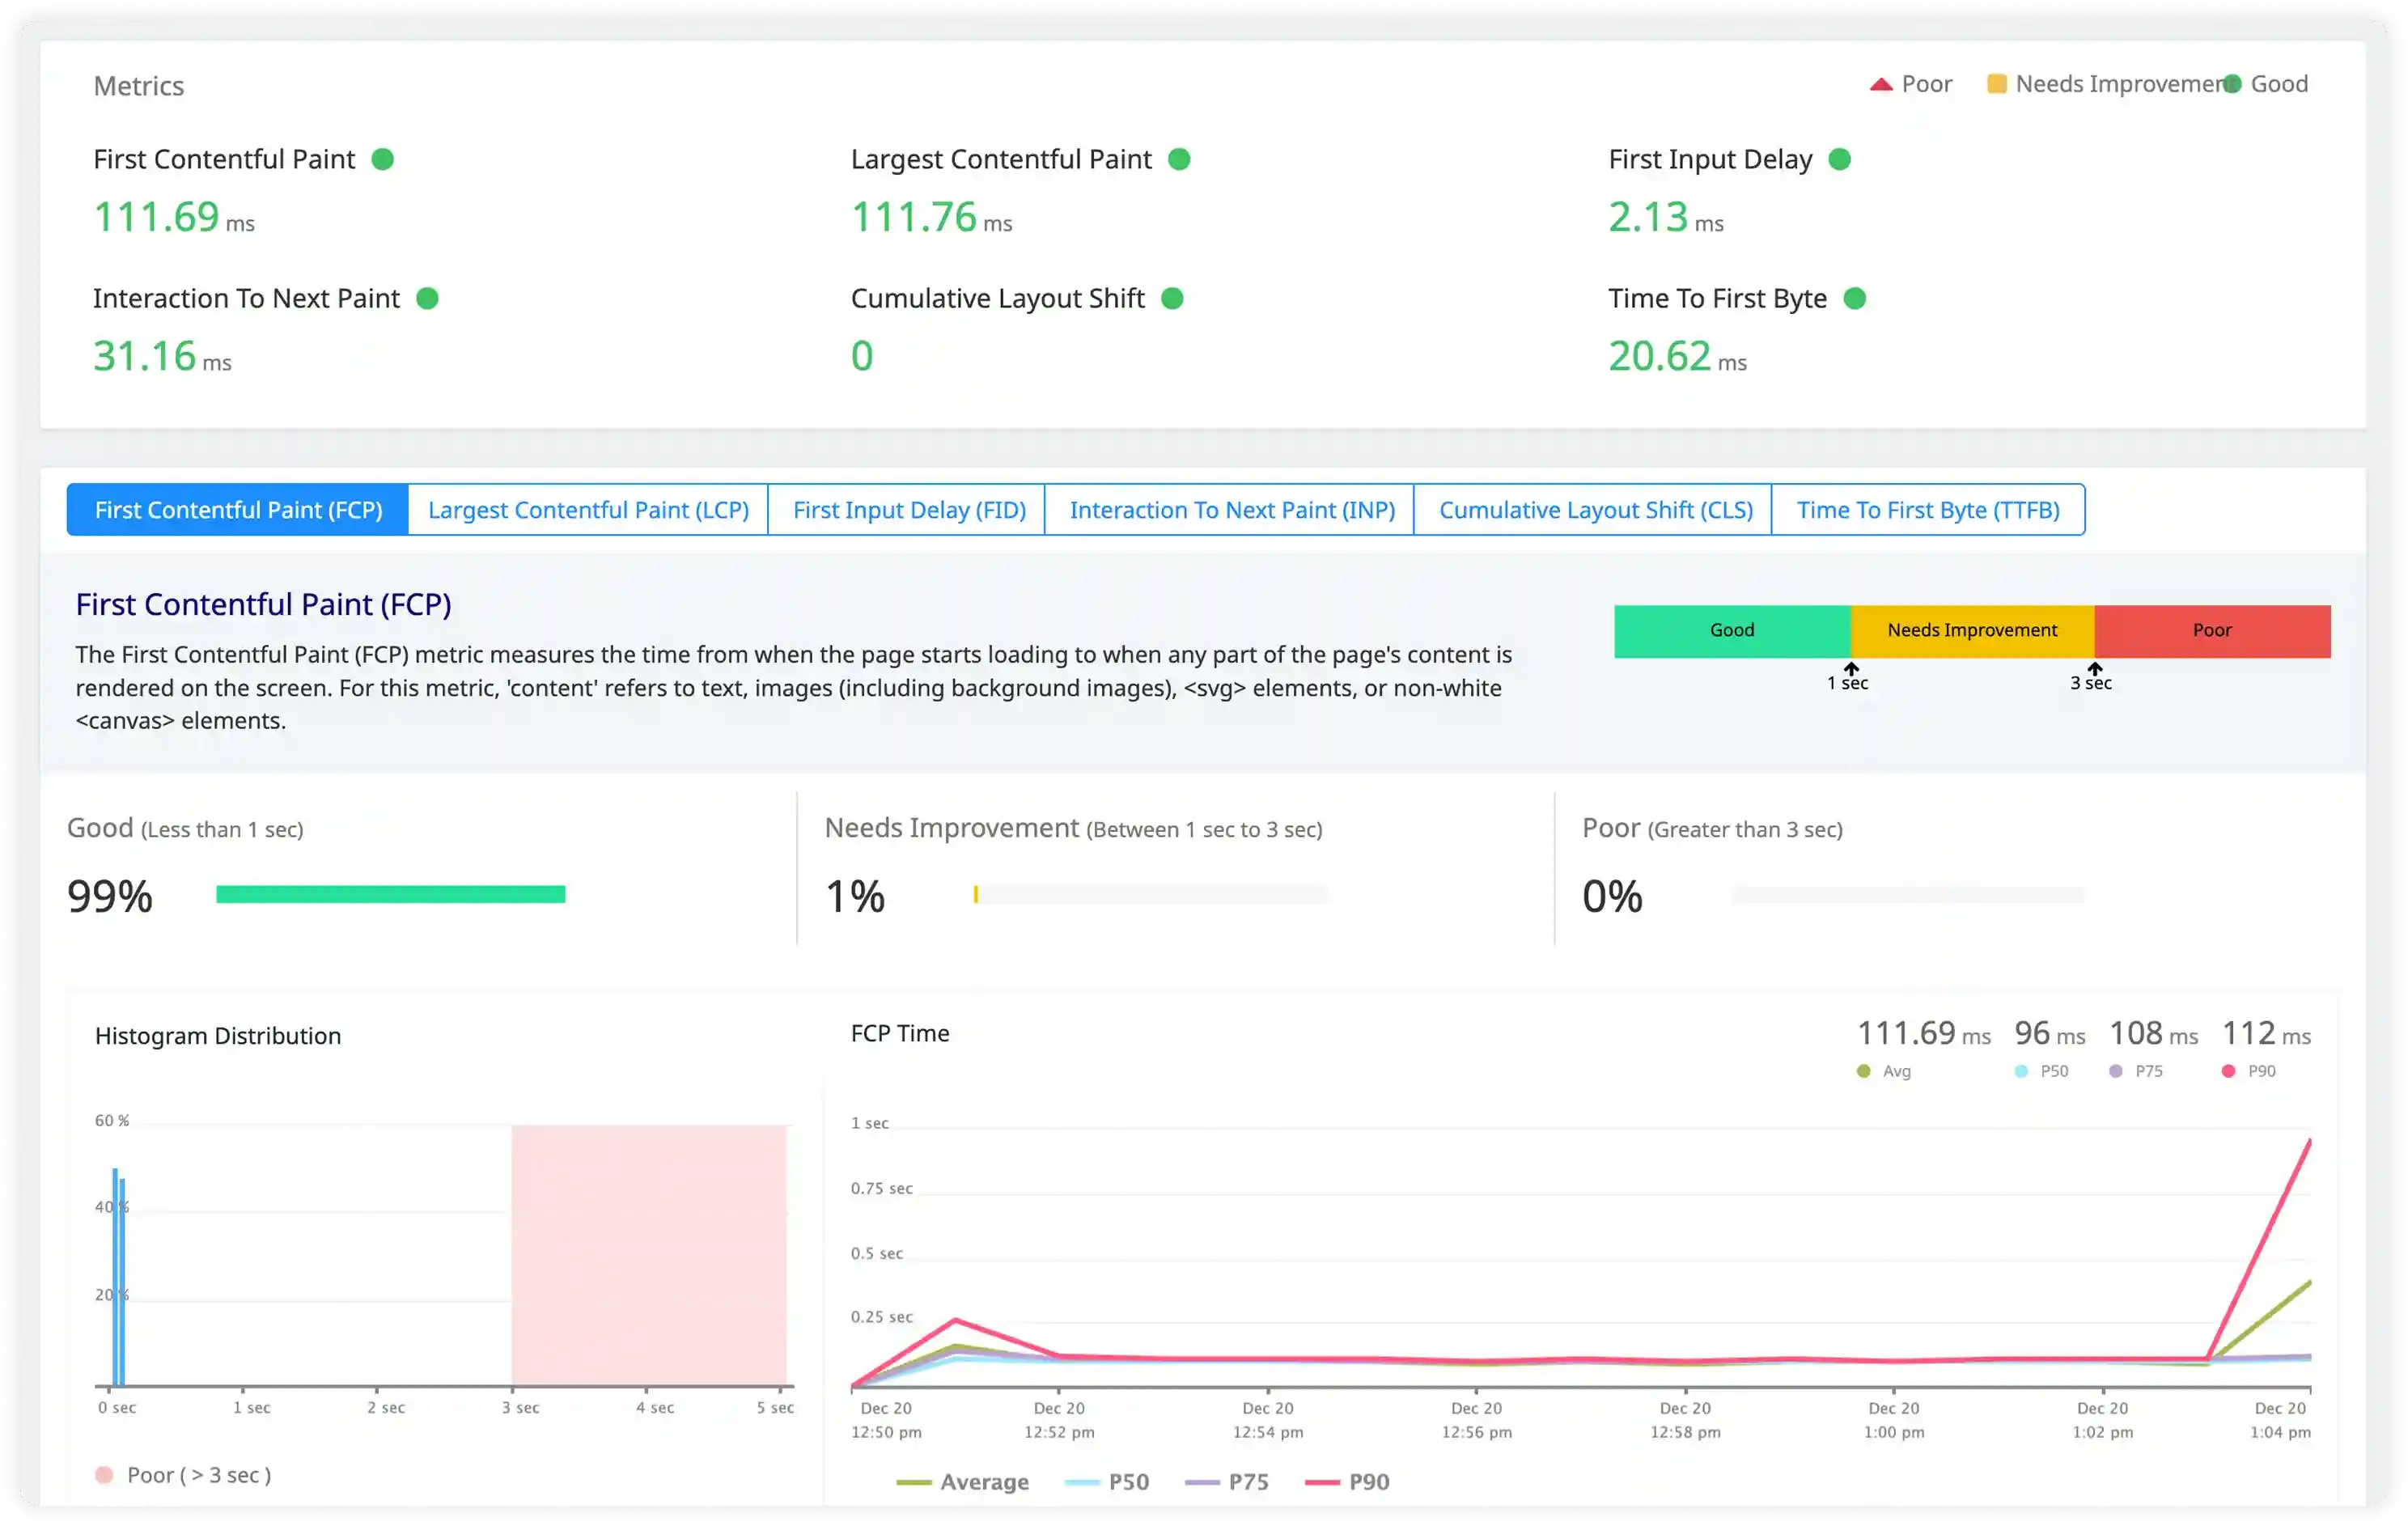
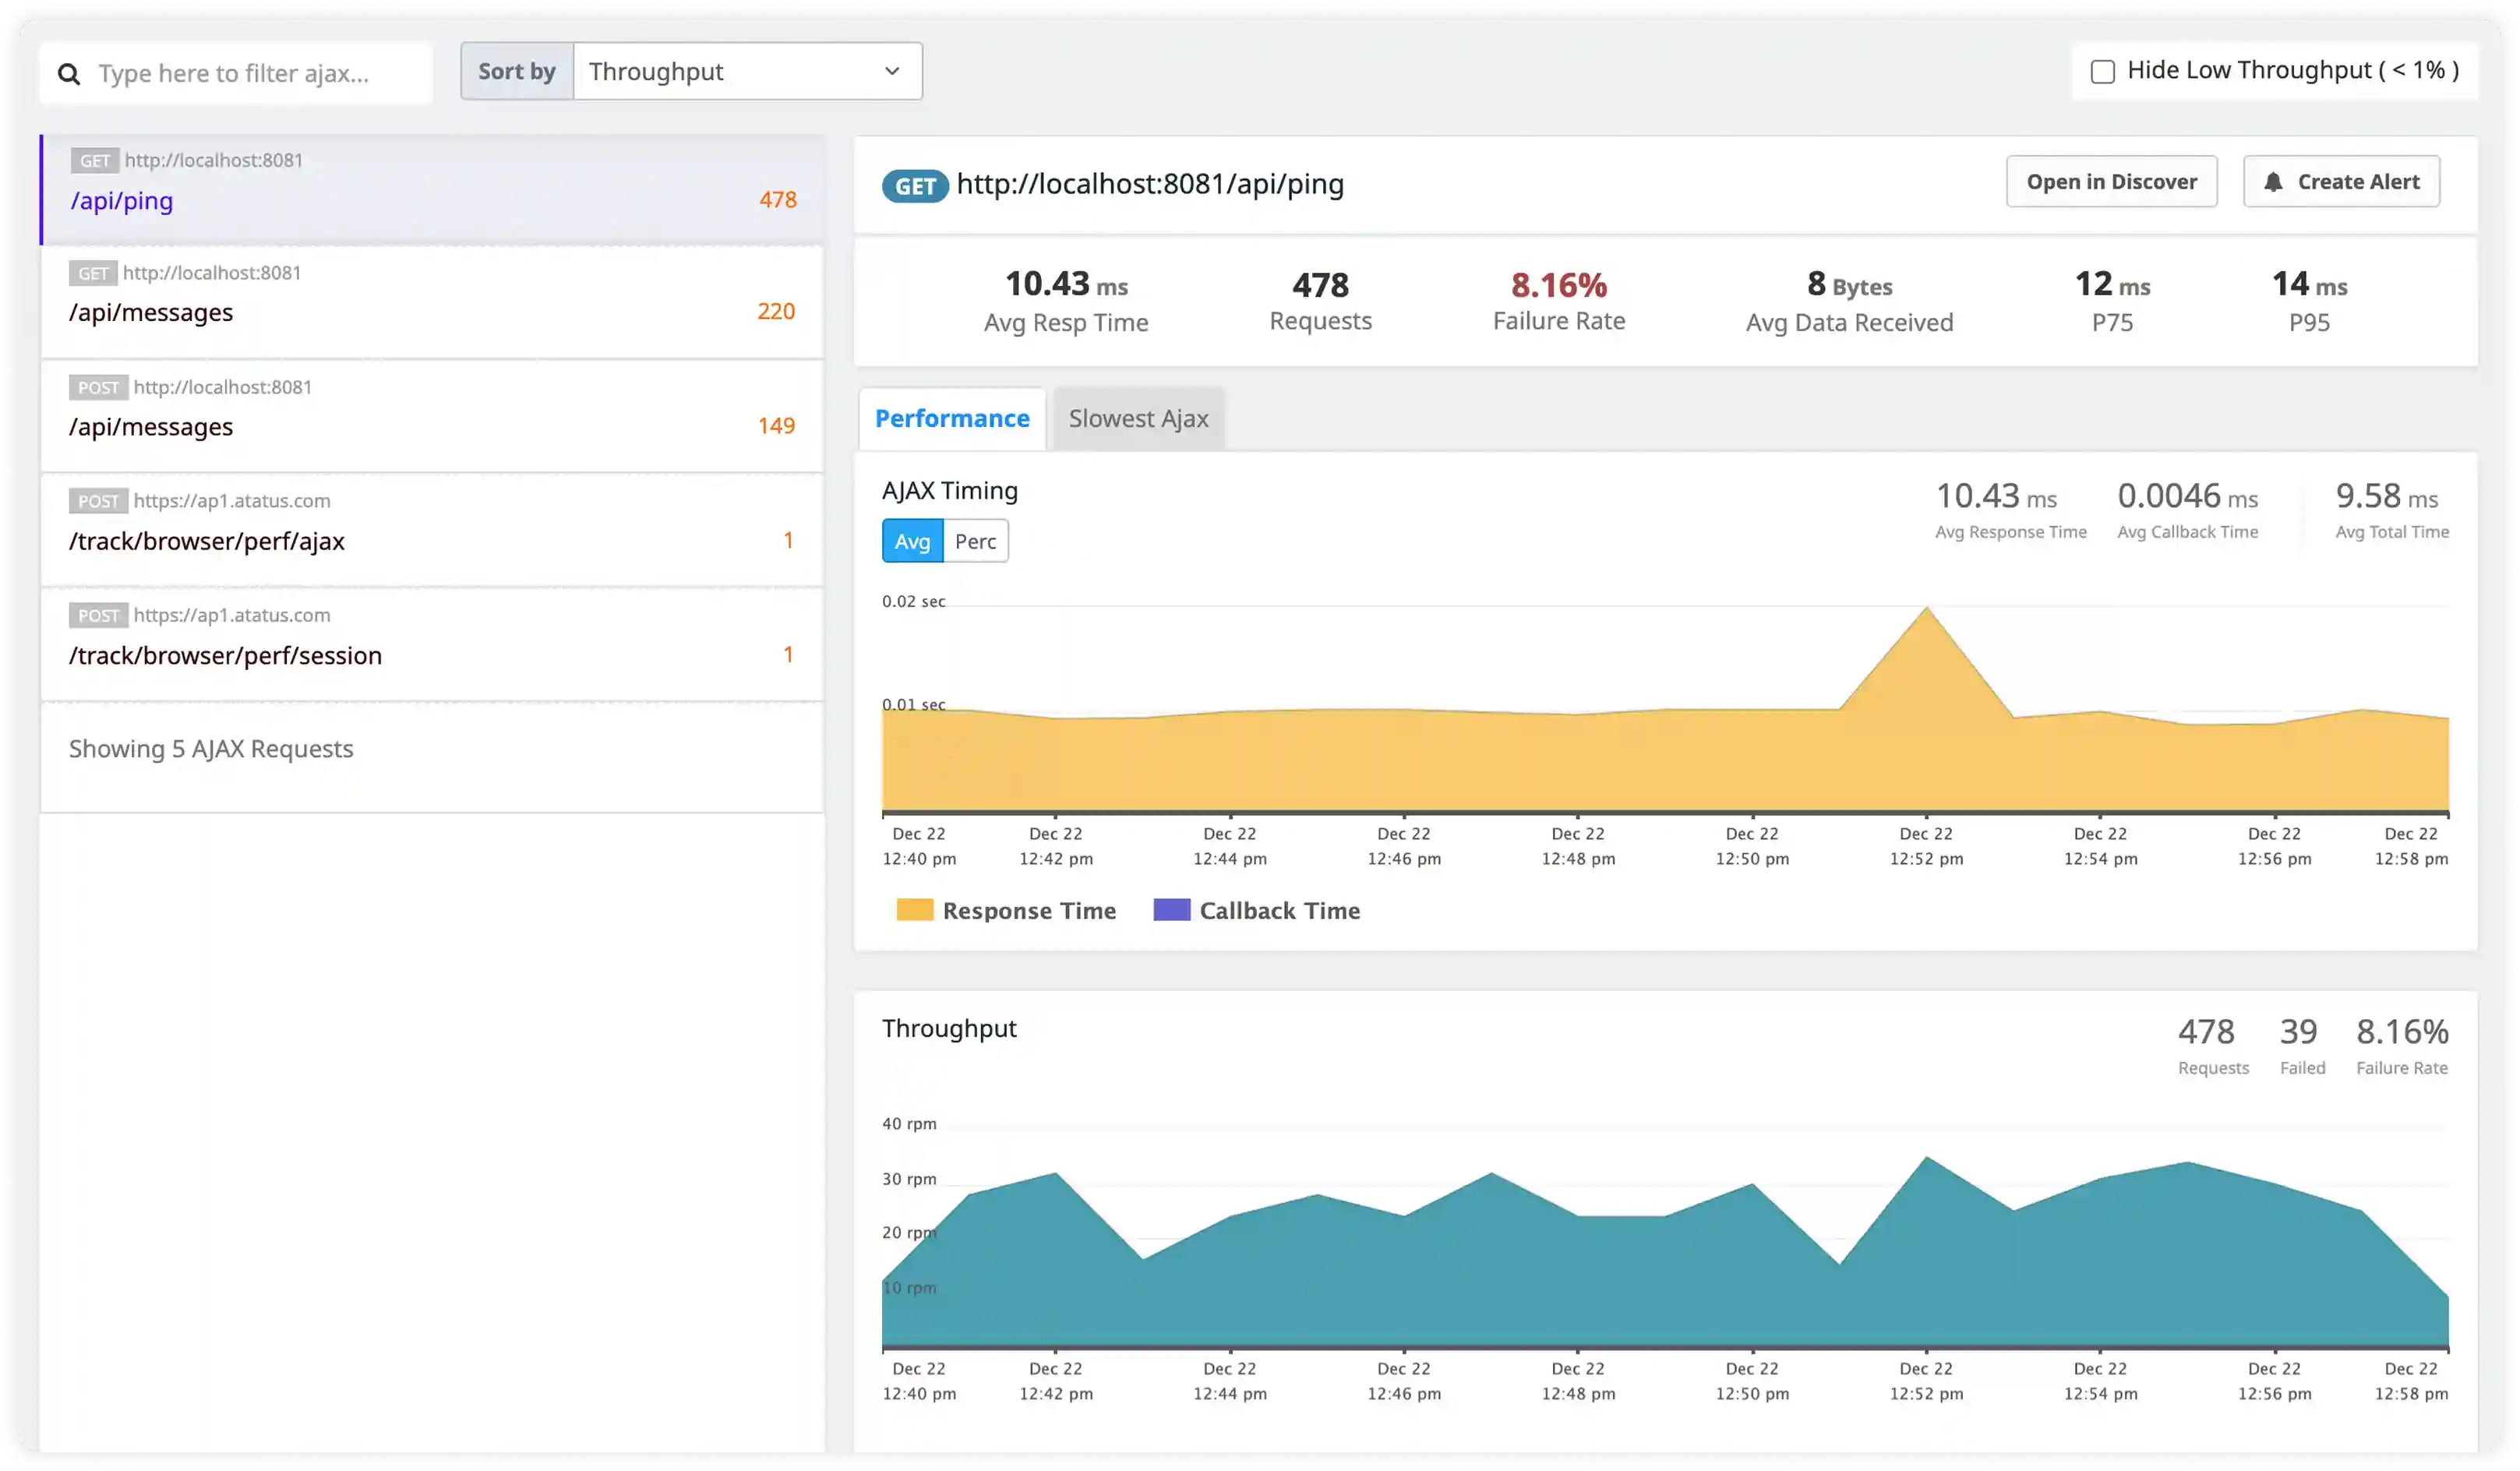
Real-time PostgreSQL operational behavior and durability signals
Track WAL activity, locking behavior, query execution signals, and replication events across PostgreSQL workloads in real time.
Monitor PostgreSQL logs and database activity in production environments
Collect PostgreSQL server logs
Ingest PostgreSQL server log output including errors, warnings, checkpoints, and background writer activity from production databases.
Analyze slow and expensive queries
Inspect PostgreSQL log entries generated by duration thresholds to identify long-running queries and inefficient execution paths.
Track database startup and shutdown
Monitor PostgreSQL startup, recovery, and shutdown logs to diagnose configuration issues and unexpected restarts.
Observe vacuum and autovacuum activity
Capture PostgreSQL vacuum and autovacuum log messages to understand table bloat, cleanup behavior, and maintenance impact.
Detect replication and WAL issues
Analyze PostgreSQL replication and write-ahead logging related messages to identify replication lag and streaming issues.
Monitor connection and authentication failures
Surface PostgreSQL connection attempts, authentication errors, and role permission issues recorded in server logs.
Correlate logs with performance metrics
Link PostgreSQL log events with query timing, connection counts, and resource usage metrics for deeper performance analysis.
Support clustered PostgreSQL setups
Aggregate logs from primary servers, replicas, and high-availability PostgreSQL deployments into a unified view.
Transaction and WAL Activity Visibility
- Track log generation across transaction commits, rollbacks, and WAL activity to understand durability and data consistency behavior in PostgreSQL systems.
- Correlate transaction logs with application requests and session context to trace write-heavy workload patterns.
- Identify transaction aborts, checkpoint delays, and WAL write issues affecting database reliability.
- Detect disruptions in durability workflows impacting recovery and replication readiness.

Locking, Deadlock, and Concurrency Diagnostics
- Capture lock wait logs, deadlock reports, and concurrency-related messages generated during multi-session workloads.
- Correlate blocking queries with affected sessions, transactions, and application operations to identify contention sources.
- Identify recurring deadlocks triggered by schema design, long-running transactions, or workload spikes.
- Detect hidden concurrency failures affecting throughput and query execution stability.

Query Planner and Execution Behavior
- Analyze execution plan logs, slow query activity, and optimization-related messages affecting PostgreSQL performance.
- Correlate planner decisions with indexing strategy, table statistics, and workload patterns across queries.
- Identify inefficient execution paths, sequential scans, and misconfigured planner parameters increasing latency.
- Detect performance degradation through abnormal execution timing and query planning anomalies.

Replication, Failover, and Operational Signals
- Track replication logs, standby synchronization activity, and failover-related events across PostgreSQL clusters.
- Correlate replication lag, streaming interruptions, and node failures with infrastructure and network conditions.
- Identify recurring replication breakdowns caused by configuration issues or workload pressure.
- Detect operational risks affecting high availability, failover readiness, and data synchronization.

Why choose Atatus for PostgreSQL logs monitoring?
PostgreSQL-native insights
Atatus ingests and interprets PostgreSQL logs including query duration, autovacuum activity, and replication messages.
Query performance visibility
Atatus helps teams detect slow queries and execution inefficiencies using log-driven analysis.
Maintenance health signals
Atatus surfaces vacuum, checkpoint, and recovery events to support stable database operations.
Faster incident diagnosis
Atatus centralizes PostgreSQL logs across environments to reduce troubleshooting time.
High-volume ready
Atatus handles heavy PostgreSQL log output without impacting database performance.
Modern deployment coverage
Atatus aggregates PostgreSQL logs from VMs, bare-metal, and cloud-hosted environments.
Unified Observability for Every Engineering Team
Atatus adapts to how engineering teams work across development, operations, and reliability.
Developers
Trace requests, debug errors, and identify performance issues at the code level with clear context.
DevOps
Track deployments, monitor infrastructure impact, and understand how releases affect application stability.
Release Engineer
Measure service health, latency, and error rates to maintain reliability and reduce production risk.