Ruby Logs Monitoring & Observability
Effortlessly track Ruby logs, gaining instant insights into errors and refining logging for a more efficient and reliable application.
Monitor Ruby application logs and runtime metrics in production environments
Centralize Ruby application logs
Collect logs emitted by Ruby applications running on Rails, Sinatra, or custom frameworks, including request handling, middleware execution, and application-level warnings.
Inspect Rails request lifecycle
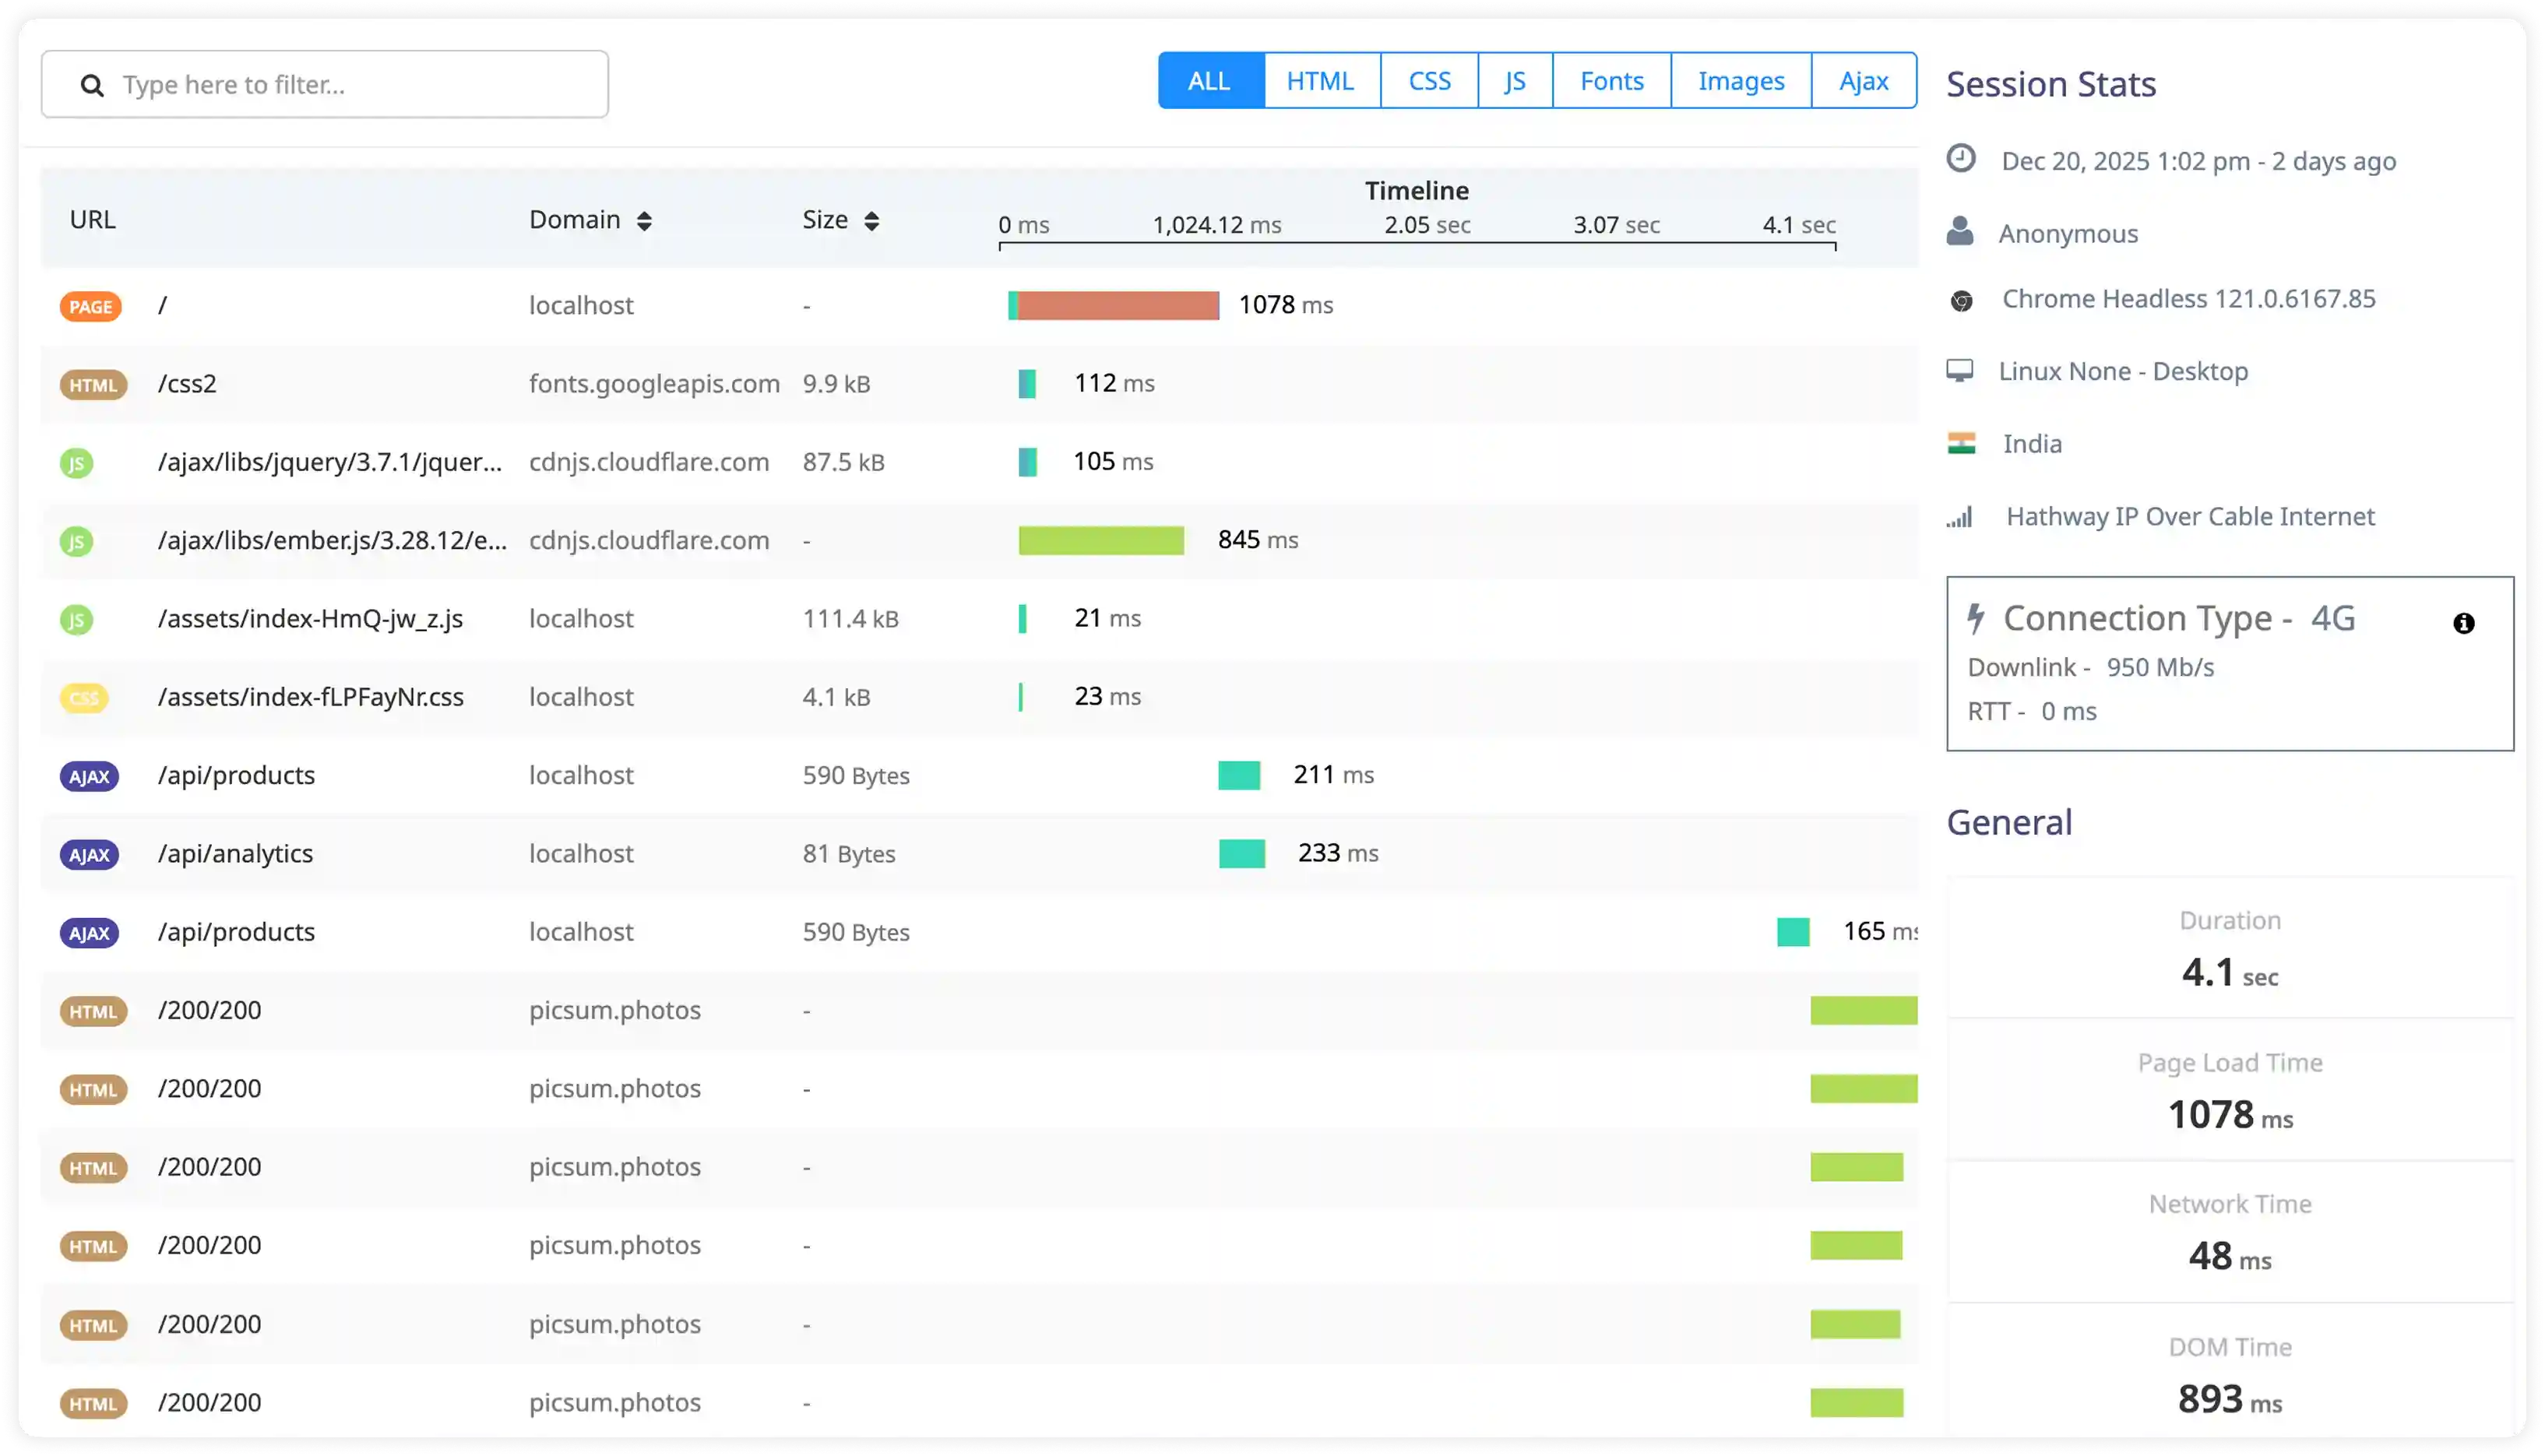
Analyze Rails controller and middleware logs to understand request routing, view rendering time, and database interaction timing.
Track background job execution
Capture logs generated by background workers such as Sidekiq, Resque, and Delayed Job to investigate retries, failures, and long-running jobs.
Observe Ruby process behavior
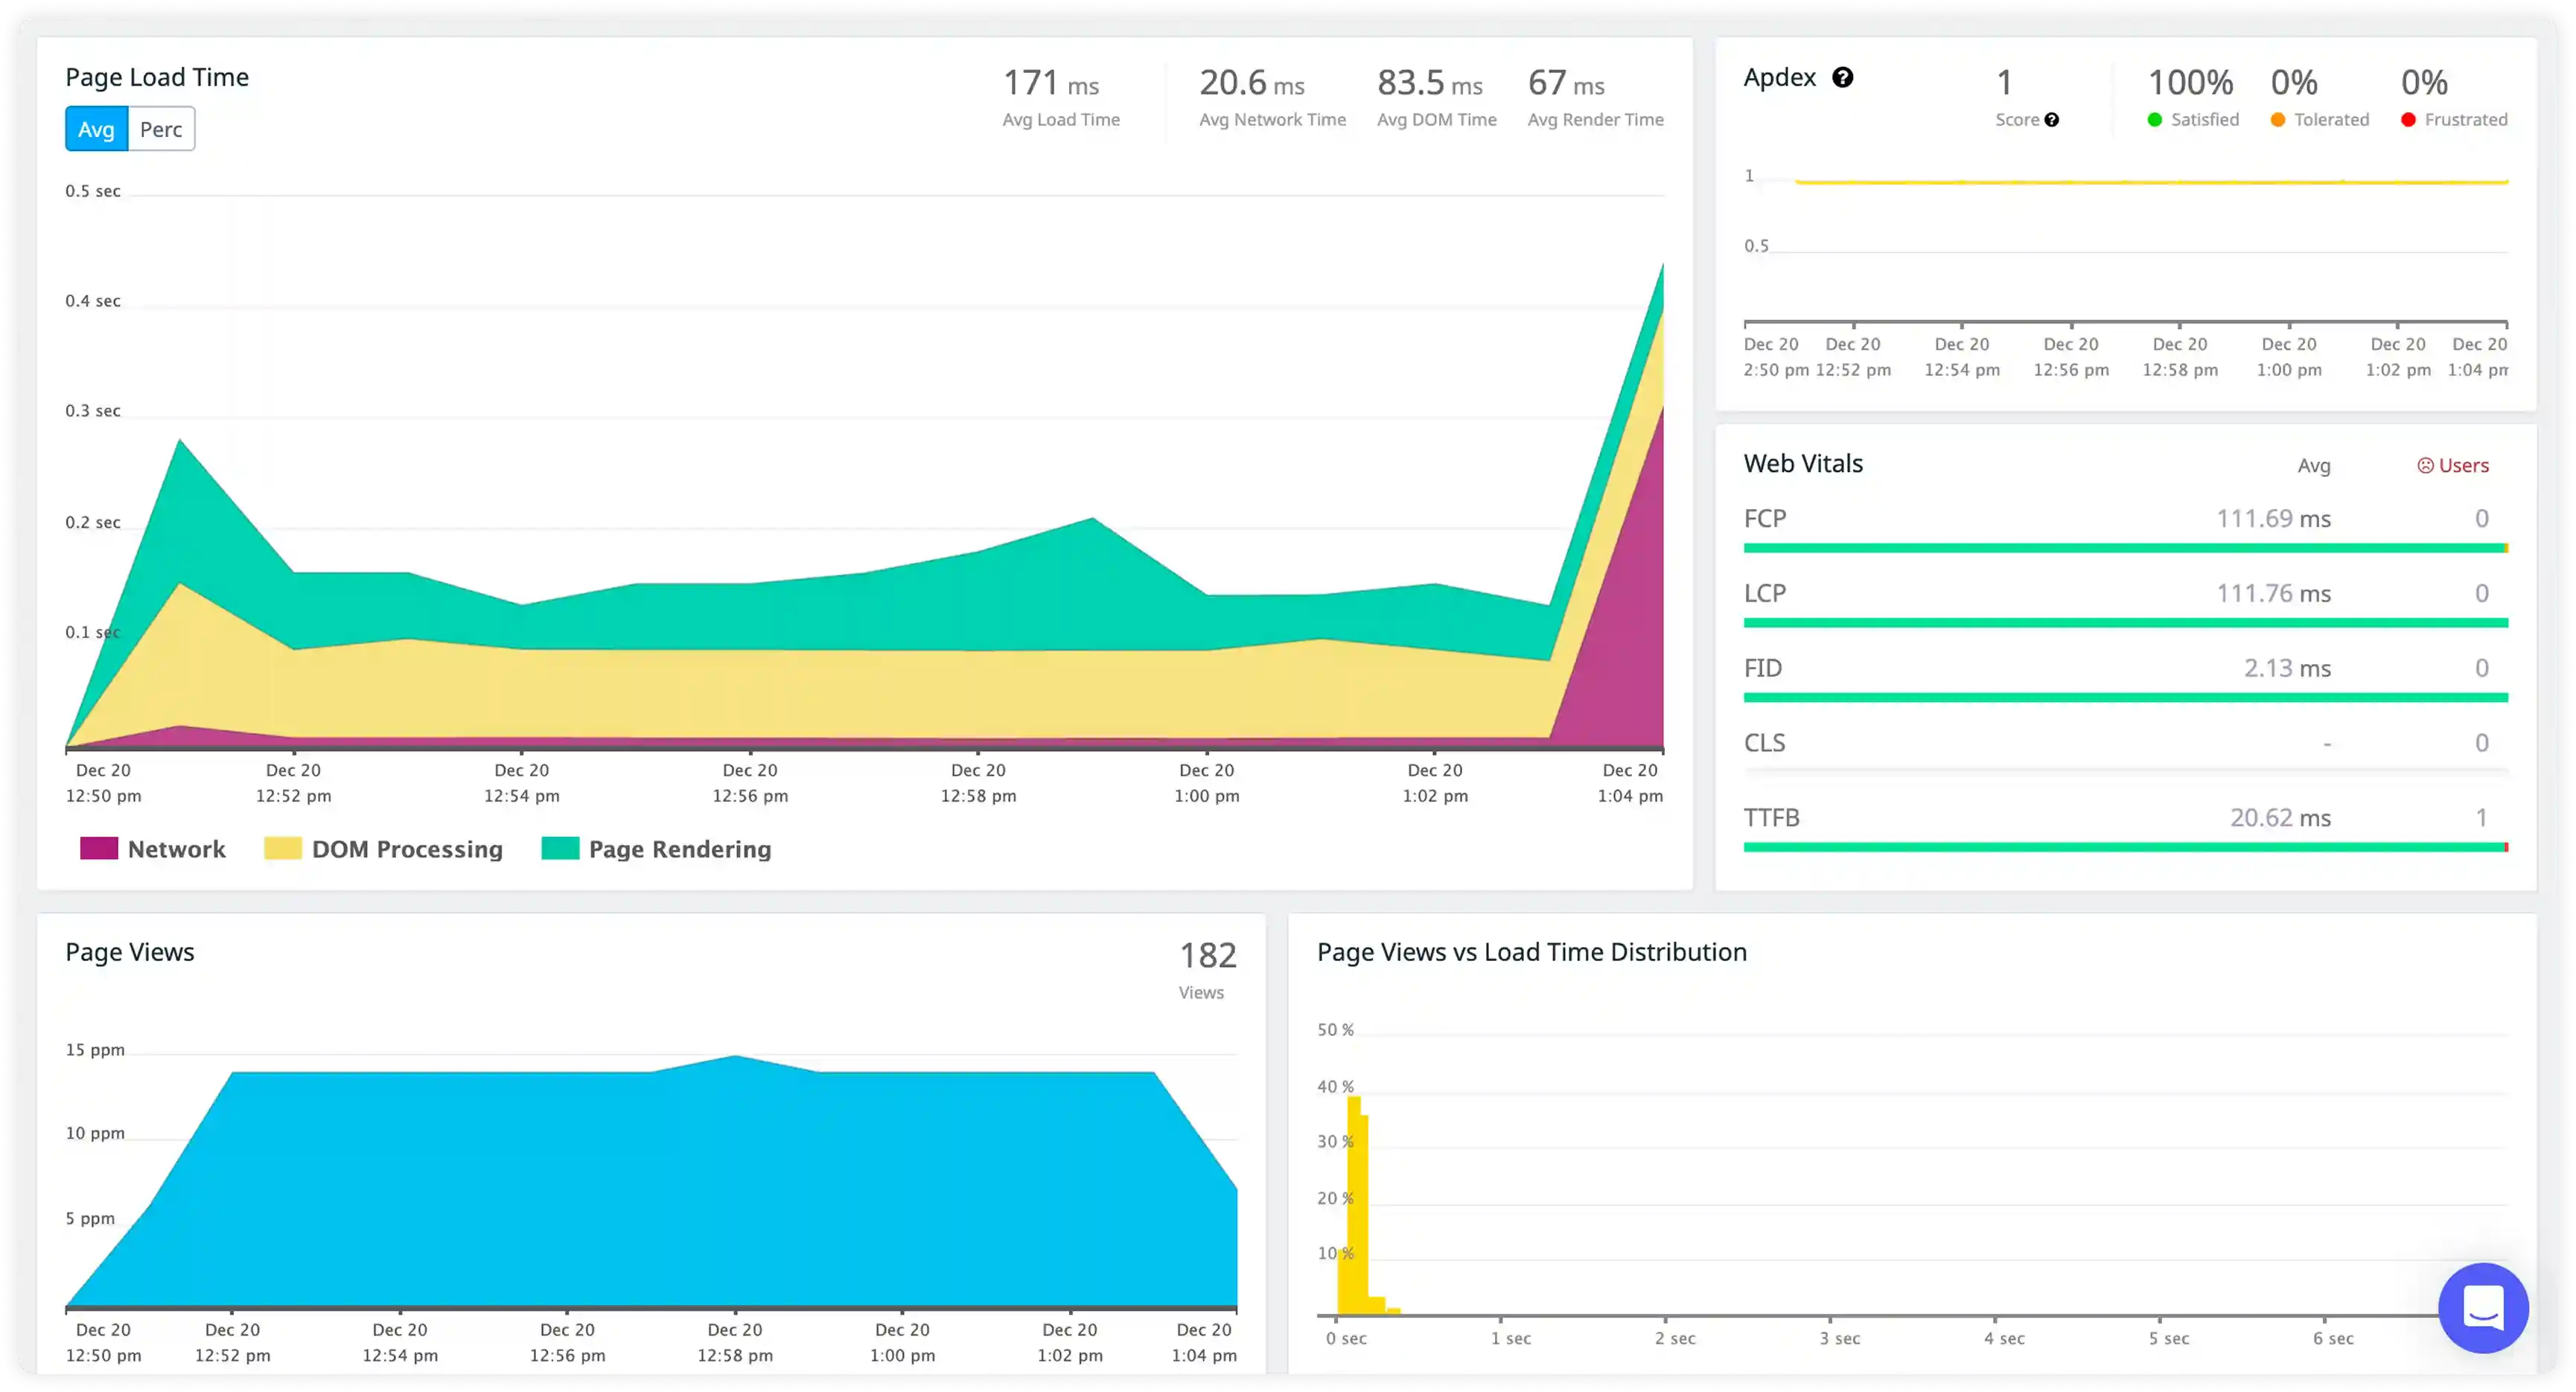
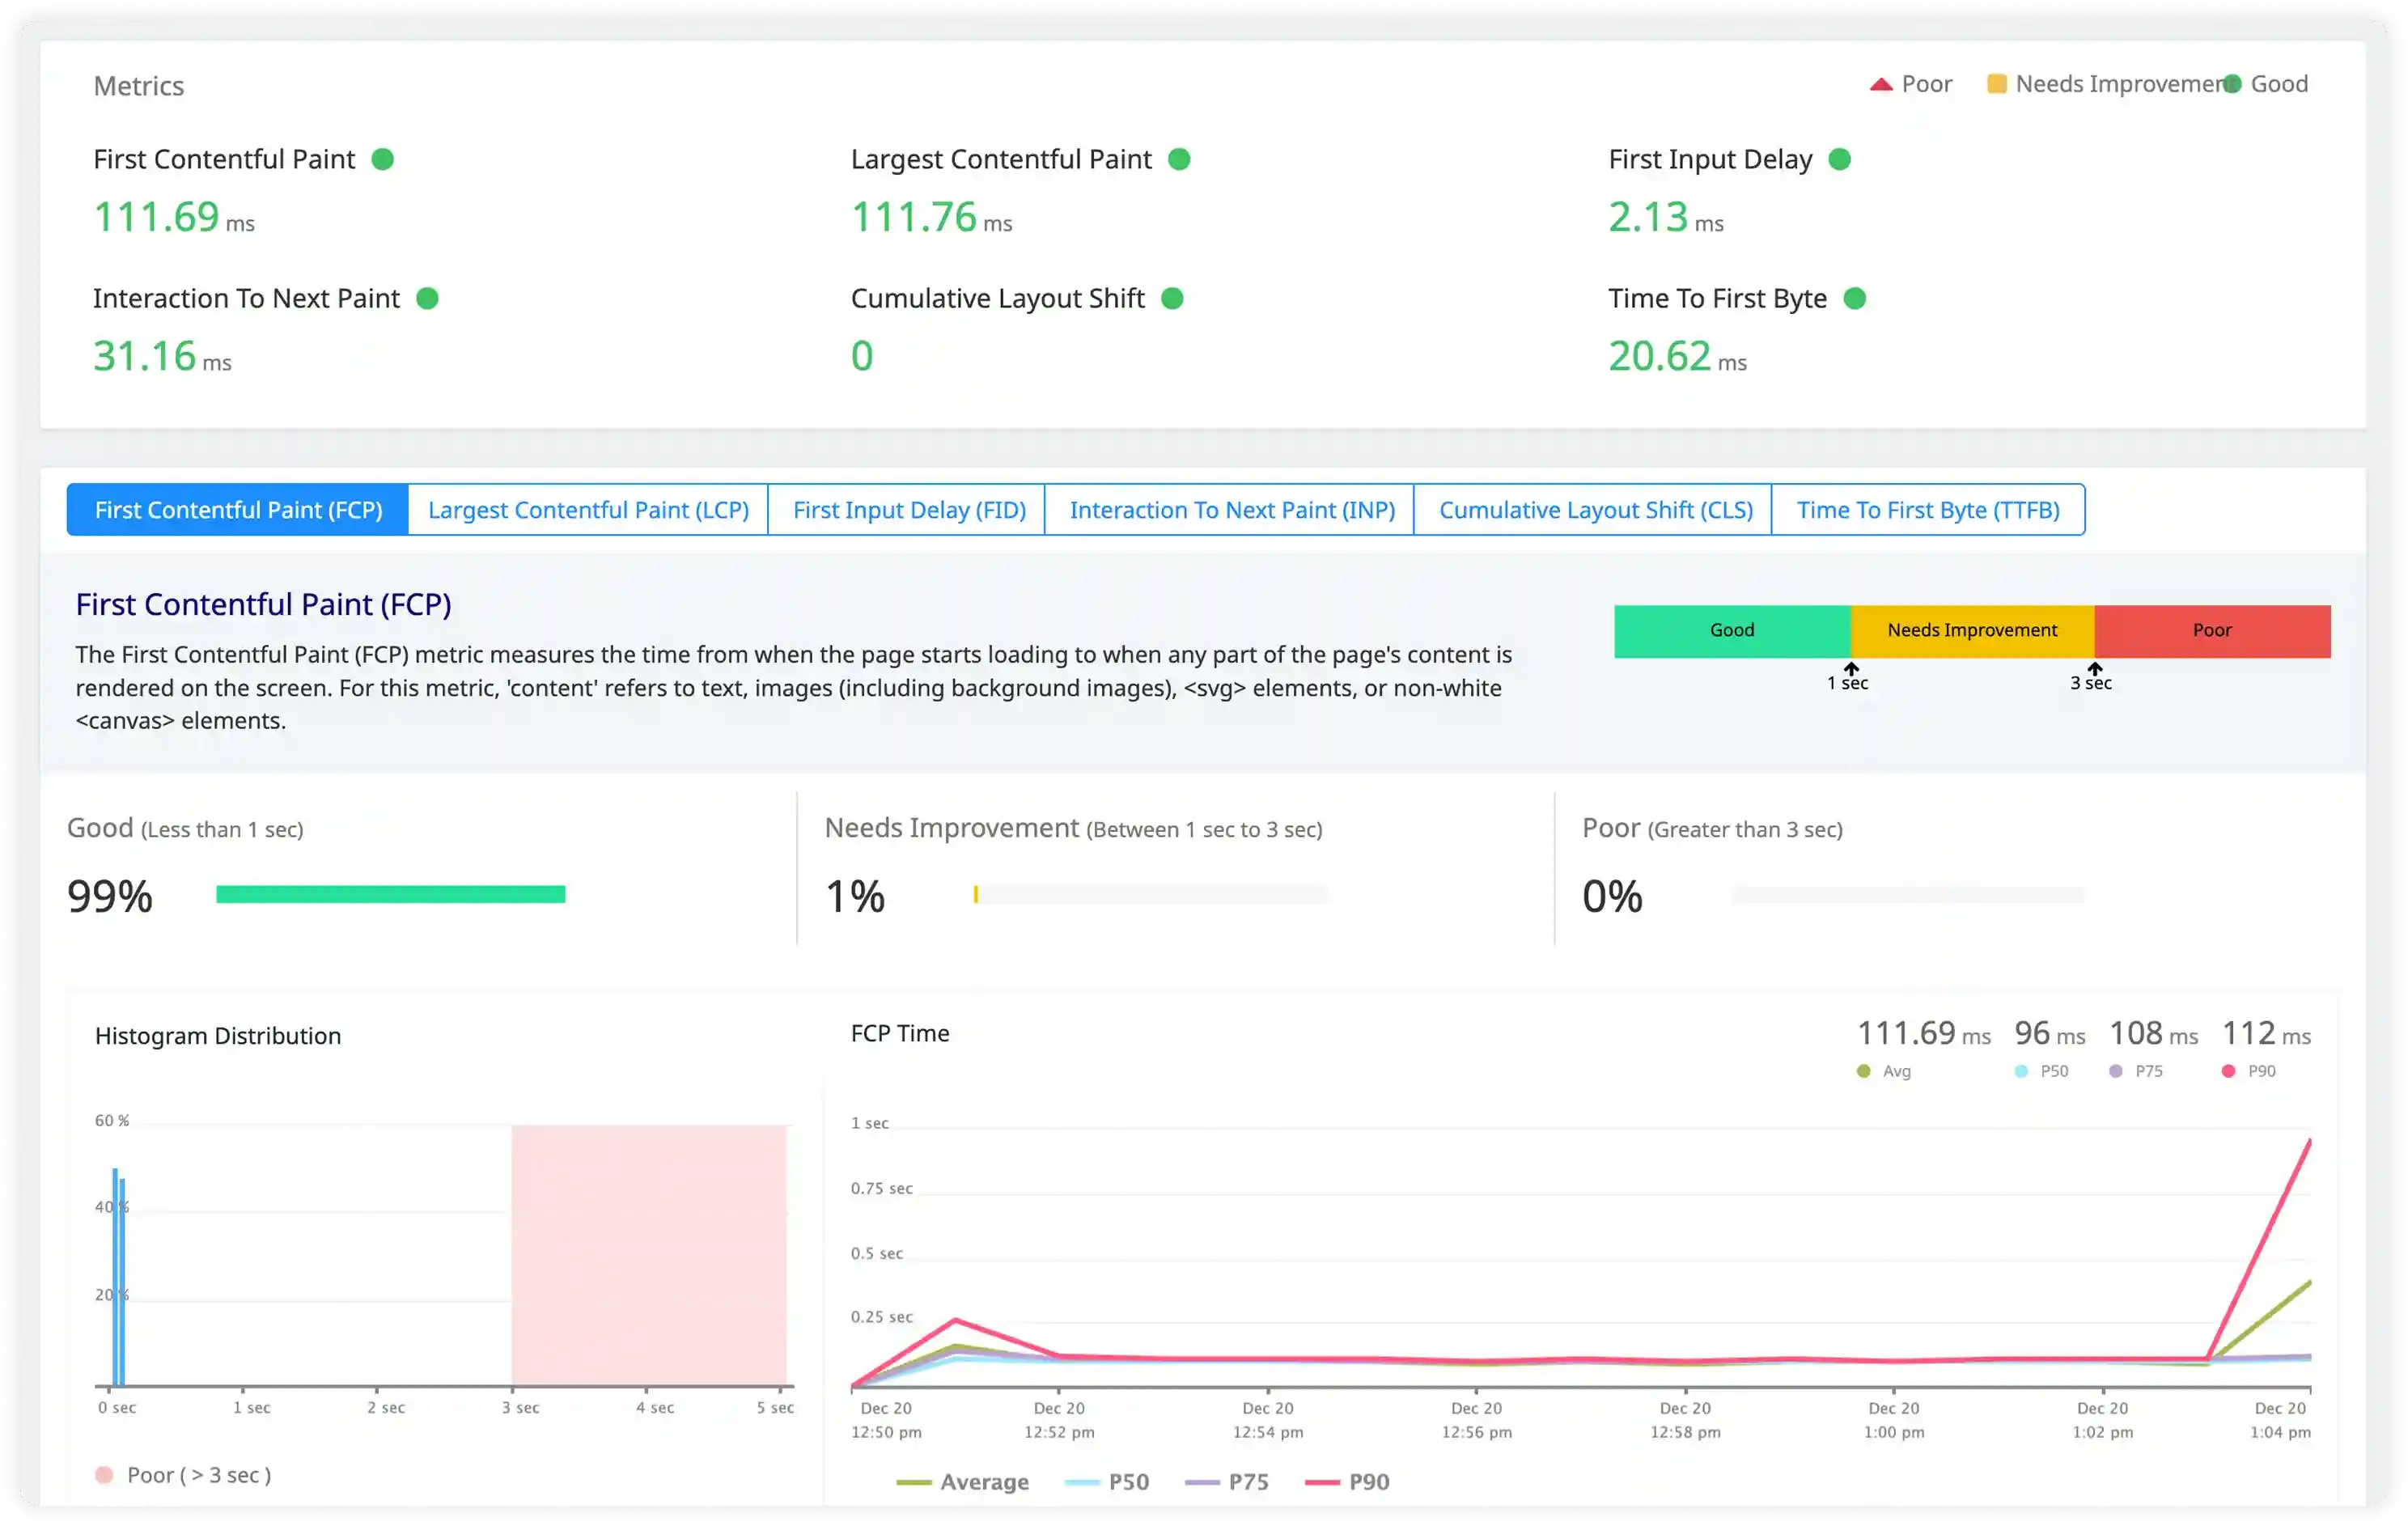
Monitor Ruby process metrics including memory usage, object allocation pressure, and garbage collection activity to identify runtime bottlenecks.
Detect memory and exception issues
Surface Ruby exceptions, segmentation faults, and memory growth patterns visible in logs before they impact application availability.
Correlate logs with runtime metrics
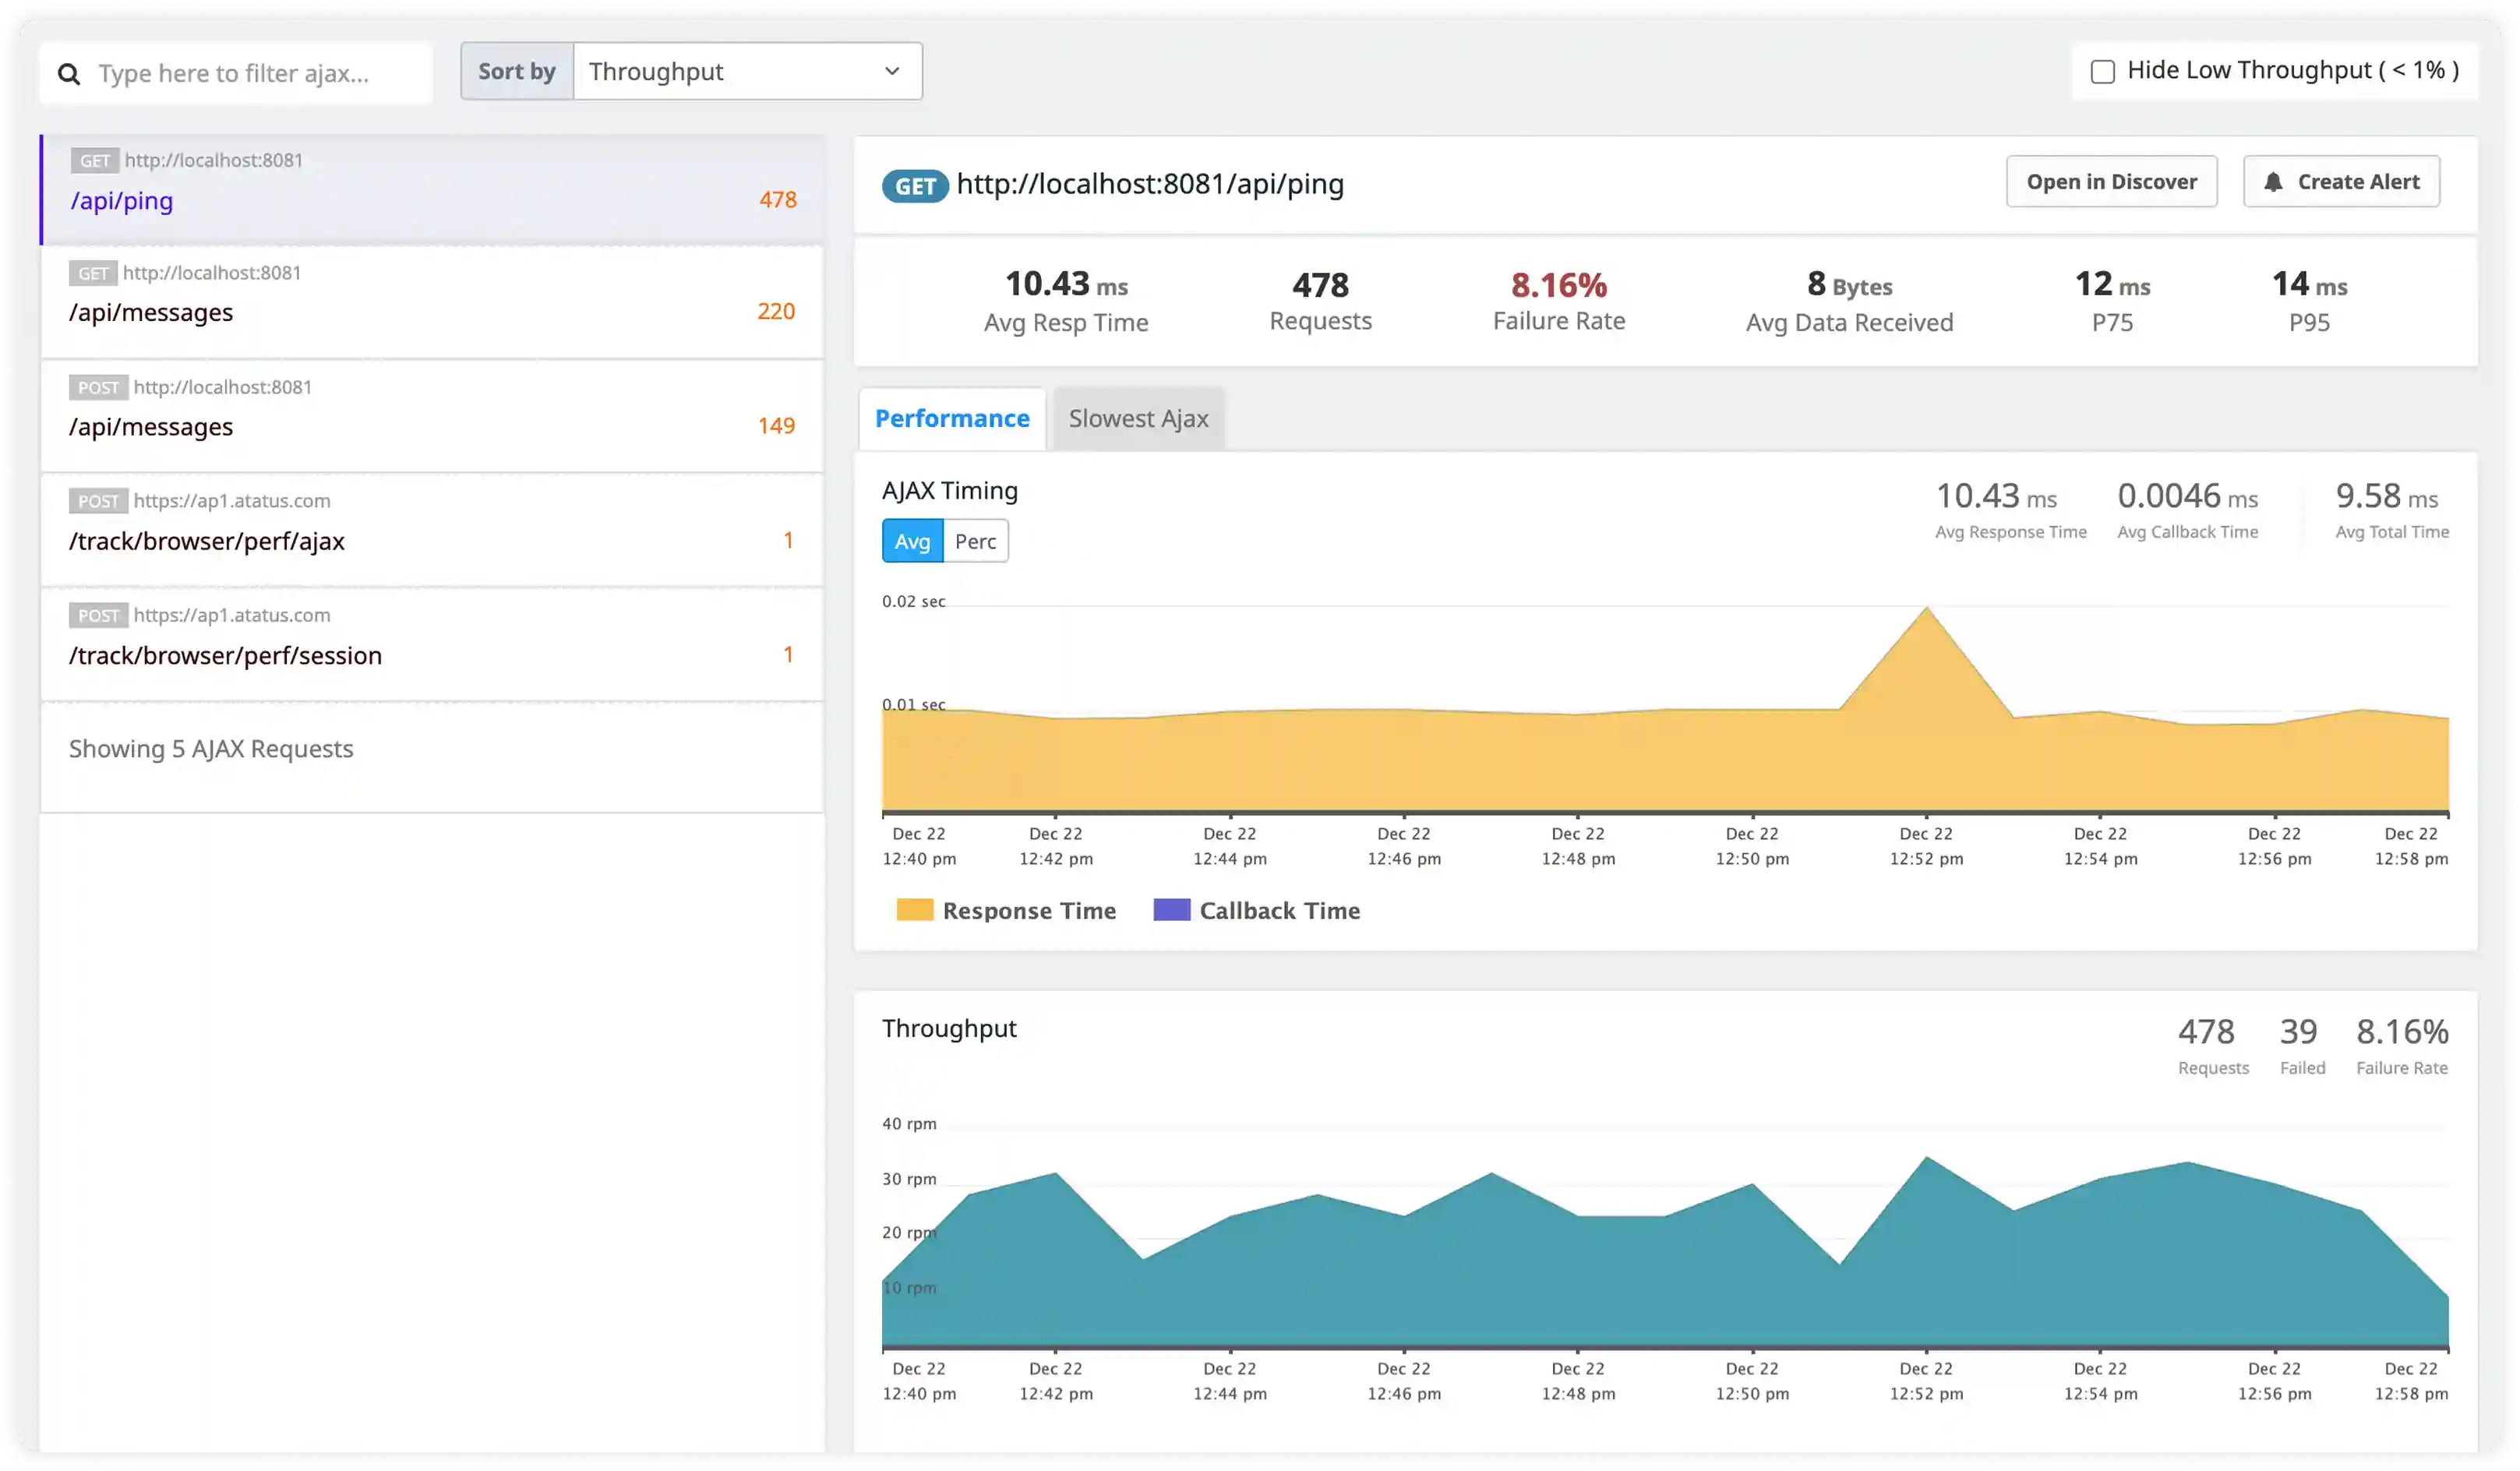
Link Ruby log events with request duration, job execution time, and process-level metrics to understand performance degradation under load.
Monitor application server logs
Ingest logs from Puma, Unicorn, and Passenger to analyze worker restarts, request queuing, and concurrency limits.
Debug production traffic patterns
Use Ruby logs and metrics together to investigate traffic spikes, slow responses, and backend saturation in live environments.
Request Handling and Application Flow
- Track log generation across web requests, controllers, background jobs, and scheduled tasks to understand Ruby application execution flow.
- Correlate log entries with request context, routing paths, and service interactions to trace application behavior.
- Identify failures in controller execution, job processing, and service workflows affecting request completion.
- Detect disruptions in background processing and task scheduling impacting system reliability.

Exception and Runtime Diagnostics
- Capture Ruby exceptions, stack traces, and runtime errors generated during application execution.
- Correlate exception logs with impacted services, endpoints, and deployment changes to identify root causes.
- Identify recurring failures caused by dependency conflicts, configuration issues, and code regressions.
- Detect hidden runtime failures affecting application stability and workflow continuity.

Performance and Execution Signals
- Analyze slow request logs, job execution warnings, and runtime timing messages affecting performance.
- Correlate execution behavior with database latency, external API calls, and service dependencies.
- Identify excessive logging from background jobs and application components increasing runtime overhead.
- Detect performance degradation through abnormal execution timing and irregular log volume patterns.

Security and Operational Monitoring
- Track authentication failures, access violations, and suspicious request activity captured in Ruby logs.
- Identify abnormal usage behavior, misuse patterns, and unauthorized interactions affecting services.
- Correlate application logs with infrastructure activity for incident investigation and visibility.
- Detect operational and security incidents impacting Ruby workloads using centralized log insights.

Why choose Atatus for Ruby logs and metrics monitoring?
Production-grade visibility into Ruby application behavior, background jobs, and runtime performance
Built for Ruby production workloads
Designed to ingest Ruby and Rails logs generated in real-world production environments without requiring invasive code changes.
Rails and job system awareness
Understands log patterns emitted by Rails controllers, ActiveRecord operations, and background job processors such as Sidekiq.
Application and runtime context
Combines Ruby log data with process-level metrics to provide context around memory usage, garbage collection, and request handling.
Faster root cause analysis
Correlates errors, slow requests, and worker restarts across logs and metrics to reduce investigation time during incidents.
Handles high-concurrency servers
Scales with multi-worker Ruby application servers and background job systems without impacting application throughput.
Works across modern deployments
Aggregates Ruby logs and metrics from virtual machines, containerized services, and cloud-hosted production environments.
Unified Observability for Every Engineering Team
Atatus adapts to how engineering teams work across development, operations, and reliability.
Developers
Trace requests, debug errors, and identify performance issues at the code level with clear context.
DevOps
Track deployments, monitor infrastructure impact, and understand how releases affect application stability.
Release Engineer
Measure service health, latency, and error rates to maintain reliability and reduce production risk.