OpenTelemetry - Making Visibility Easy
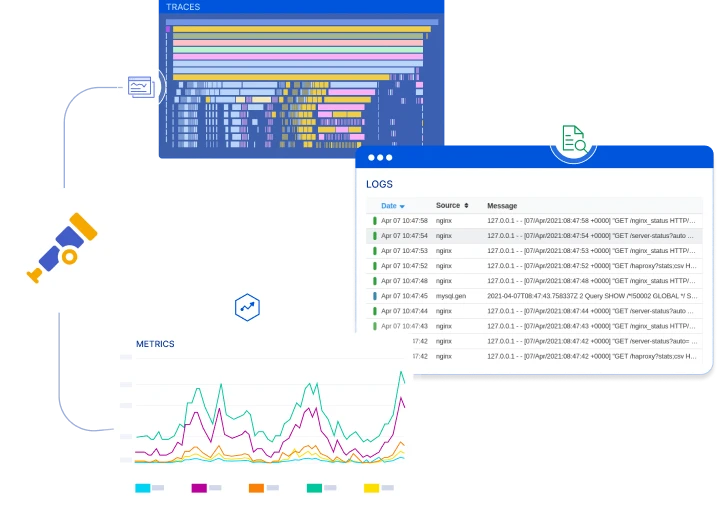
Effortlessly integrate telemetry data from metrics, logs, and traces to simplify data aggregation across your entire stack, enabling holistic insights into system performance and behavior.
Proprietary Instrumentation Challenges
Without OpenTelemetry, teams face these critical observability challenges:
Vendor Lock-In with Proprietary Agents
Proprietary monitoring agents tie you to specific vendors, making it expensive and time-consuming to switch providers or use multiple backends.
"As a staff engineer, we spent 6 months rewriting instrumentation when switching monitoring vendors because everything was tied to their proprietary SDK."
Inconsistent Instrumentation Across Languages
Each language and framework has different instrumentation libraries with varying features and APIs, creating maintenance headaches in polyglot environments.
"As a platform team lead, our Node.js and Java services are instrumented completely differently, making it impossible to create unified observability standards."
Manual Instrumentation Overhead
Adding detailed observability requires manually instrumenting code with spans, logs, and metrics, slowing down development and creating inconsistencies.
"As a backend developer, I spend 20% of my time adding manual tracing spans instead of building features, and still miss critical instrumentation points."
Lack of Standardized Telemetry
Different services emit telemetry in different formats, making it difficult to correlate data and build unified dashboards across your entire stack.
"As an observability engineer, correlating traces from our frontend (vendor A), backend (vendor B), and databases (vendor C) is nearly impossible due to format differences."
Sampling and Data Loss
Proprietary agents use inconsistent sampling strategies, leading to lost traces during incidents and incomplete visibility into rare but critical errors.
"As an incident commander, the exact trace I need to debug the incident was sampled away, leaving me with incomplete information during our worst outage."
Collector Configuration and Deployment Overhead
Deploying and configuring OpenTelemetry Collectors across environments requires significant DevOps effort and ongoing maintenance.
"As a DevOps engineer, managing OpenTelemetry Collector configs across 50 services and 3 environments is time-consuming and error-prone."
OpenTelemetry Native,
Future-Proof Observability
Built on open standards, not proprietary formats. Avoid vendor lock-in and future-proof your observability strategy with OpenTelemetry.
Vendor-Neutral Observability
Avoid vendor lock-in with OpenTelemetry's open standard. Send telemetry data to any backend, switch providers easily, and maintain full control over your observability stack.
Unified Telemetry Collection
Three pillars of observability—logs, metrics, and traces—integrated into a single platform. Seamlessly correlate data types for faster root cause analysis and more effective problem resolution.
Auto-Instrumentation & Standards
Automatically instrument applications with OTel SDKs. Standardized instrumentation streamlines collaboration, simplifies onboarding, and ensures consistent monitoring across diverse microservices architectures.
How Atatus OpenTelemetry Provides Vendor-Neutral Observability
Future-proof your observability with the industry standard
Vendor-Neutral Observability
OpenTelemetry standard ensures you're never locked into a vendor. Switch backends or use multiple simultaneously without changing instrumentation.
Auto-Instrumentation
Automatic instrumentation for popular frameworks and libraries across all languages. Get distributed traces, metrics, and logs without code changes.
Unified Instrumentation Standard
Single API and SDK across all languages. Consistent semantic conventions make it easy to build polyglot observability with standardized telemetry.
Complete Telemetry Correlation
Automatic correlation of traces, logs, and metrics using standardized context propagation. Jump from any signal to any other instantly.
Flexible Sampling Control
Configure sampling at the collector level with head-based, tail-based, or intelligent sampling. Never lose critical traces during incidents.
Future-Proof Observability
OpenTelemetry is the CNCF standard backed by industry leaders. Your instrumentation investment is protected as the ecosystem evolves.
Everything You Need for
OpenTelemetry Observability
Production-ready RUM features that help you deliver exceptional user experiences
Standardized Telemetry Without Lock-In
- Collect metrics, traces, and logs natively using OpenTelemetry without custom agents or proprietary formats
- Instrument applications once and reuse the same setup across teams and environments
- Support diverse services, languages, and deployment models with consistent telemetry
- Keep observability flexible and portable by avoiding vendor lock-in
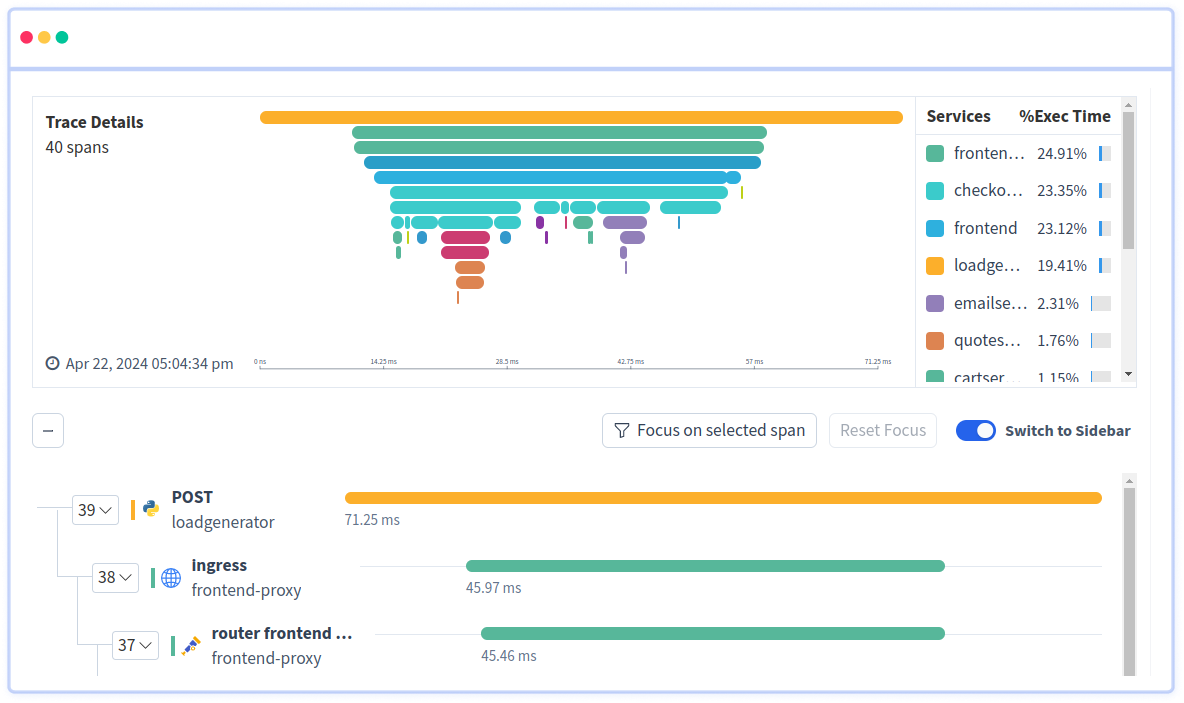
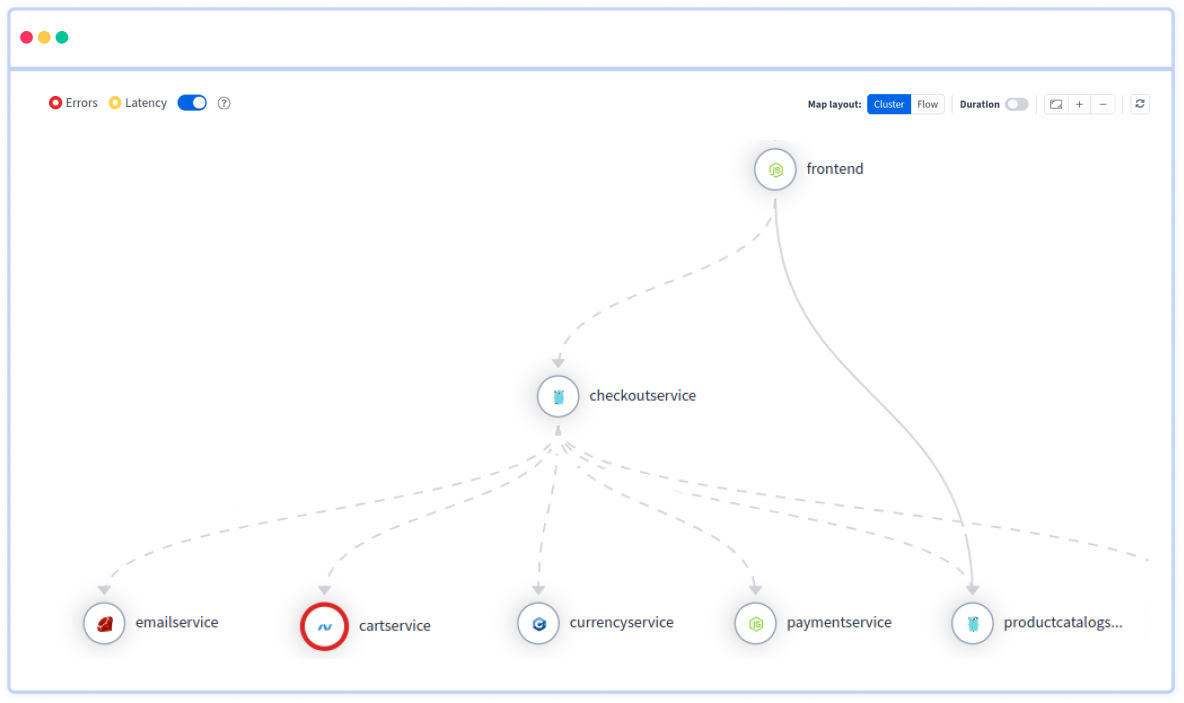
Automatic Context Propagation Across Requests
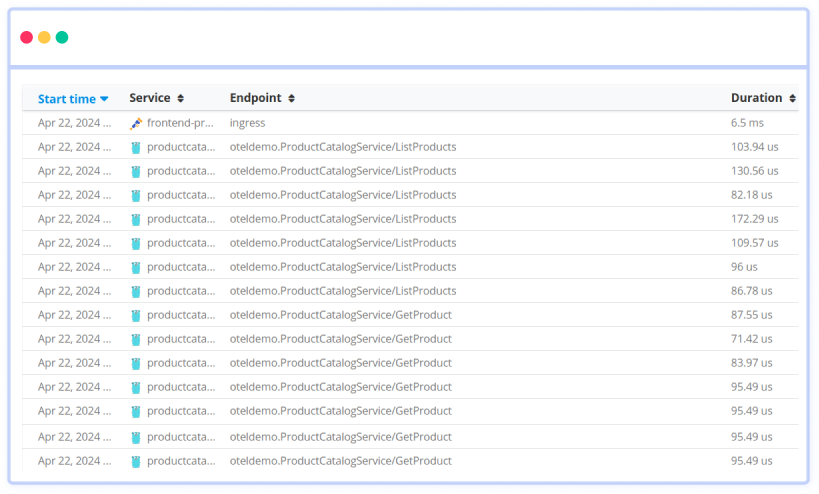
- Capture distributed traces with full context across services, queues, and backend systems
- Follow request flow end to end to understand how dependencies interact
- Correlate traces with metrics and logs for unified troubleshooting
- Gain deeper visibility into system behavior without manual trace stitching
Flexible SDKs and Integrations for Every Stack
- Use OpenTelemetry SDKs across popular languages and frameworks with native support
- Instrument Node.js, Python, Java, .NET, and more with a consistent approach
- Add custom attributes and tags to enrich telemetry with application context
- Route telemetry seamlessly into dashboards and alerts without extra configuration
Start with OpenTelemetry in 3 Simple Steps
Open standard instrumentation with enterprise-grade observability. No vendor lock-in.
Install OpenTelemetry SDK
Add the OpenTelemetry SDK to your application with a simple package install. Choose from auto-instrumentation libraries or manually instrument your code—both work seamlessly with Atatus.
Configure OTel Exporter
Point your OpenTelemetry exporter to Atatus with a simple configuration. Atatus automatically ingests traces, metrics, and logs from any OTel-compatible source without proprietary agents.
Analyze with Unified Visibility
Access pre-built dashboards showing traces, metrics, and logs in one unified view. Correlate signals across your entire stack to quickly identify root causes and optimize performance.