Deliver Better Experiences with Real User Monitoring (RUM)
Get complete visibility into how real users experience your site. Atatus Real User Monitoring captures performance metrics, JavaScript errors, user journeys in real time and delivers seamless digital experiences that keep users coming back.
Frontend Performance Challenges
Without Real User Monitoring, teams struggle with these critical frontend issues:
Poor Core Web Vitals Hurting SEO
Website ranking dropping in Google search results due to poor Core Web Vitals (LCP, FID, CLS), but no visibility into what's causing the issues.
"As a marketing manager, our organic traffic is declining because our Core Web Vitals scores are poor, but I don't know which pages or elements are the problem."
JavaScript Errors Breaking User Experience
Users experiencing broken features and frustrating errors, but developers can't reproduce the issues in their testing environments.
"As a frontend developer, users report issues that I can't reproduce because I don't have visibility into real user environments and browser configurations."
No Visibility into Actual User Experience
Synthetic tests show the site is fast, but real users report slow load times and poor performance on their devices.
"As a product manager, our synthetic monitoring shows good performance, but users complain about slow pages. We need real user data."
High Bounce Rates and Cart Abandonment
Users leaving the site before completing purchases, but no data on which pages are slow or causing frustration.
"As an e-commerce manager, our cart abandonment rate is 70%, but we don't know which performance issues are driving users away."
Mobile Performance Issues
Mobile users experiencing significantly slower performance than desktop users, impacting conversion rates and user satisfaction.
"As a mobile product lead, 60% of our traffic is mobile, but our mobile performance is terrible and we can't pinpoint the bottlenecks."
Third-Party Scripts Slowing Down Your Site
External scripts (analytics, ads, chat widgets) blocking page rendering and degrading user experience, but no visibility into their impact.
"As a web developer, third-party scripts are slowing down our pages, but I can't tell which ones are worth keeping and which ones to remove."
Built for Real Users,
Optimized for Performance
Get complete visibility into how real users experience your site. Start monitoring in minutes and optimize effortlessly.
Real User Visibility
See exactly how real users experience your site across browsers, devices, and locations. Capture Web Vitals, session data, and user behavior in real time.
Root-Cause Detection
Quickly identify what's causing slowdowns or errors. Drill into sessions, AJAX calls, and JavaScript issues to resolve problems before they impact users.
Zero Maintenance
Lightweight, easy-to-install script with no ongoing upkeep. Runs silently in the background without affecting site performance. Set it and forget it.
How Atatus RUM Improves User Experience
Deliver measurable improvements in frontend performance and user satisfaction
Improve SEO Rankings
Monitor and optimize Core Web Vitals to boost Google search rankings. See exactly which pages need improvement and track progress over time.
Fix JavaScript Errors Instantly
Capture every JavaScript error with full stack traces, browser info, and user session context. Reproduce and fix issues quickly.
Understand Real User Experience
See actual page load times, render performance, and user interactions from real users on real devices across the globe.
Reduce Bounce Rate by 40%
Identify slow pages causing user frustration. Optimize performance to keep users engaged and improve conversion rates.
Optimize Mobile Experience
Track mobile-specific metrics, identify device performance issues, and optimize for mobile users to boost mobile conversion.
Increase Conversion Rates
Faster pages lead to more conversions. Every 100ms improvement in page load time increases conversion by 1%.
Everything You Need to
Monitor Real Users
Production-ready RUM features that help you deliver exceptional user experiences
End-User Performance Visibility
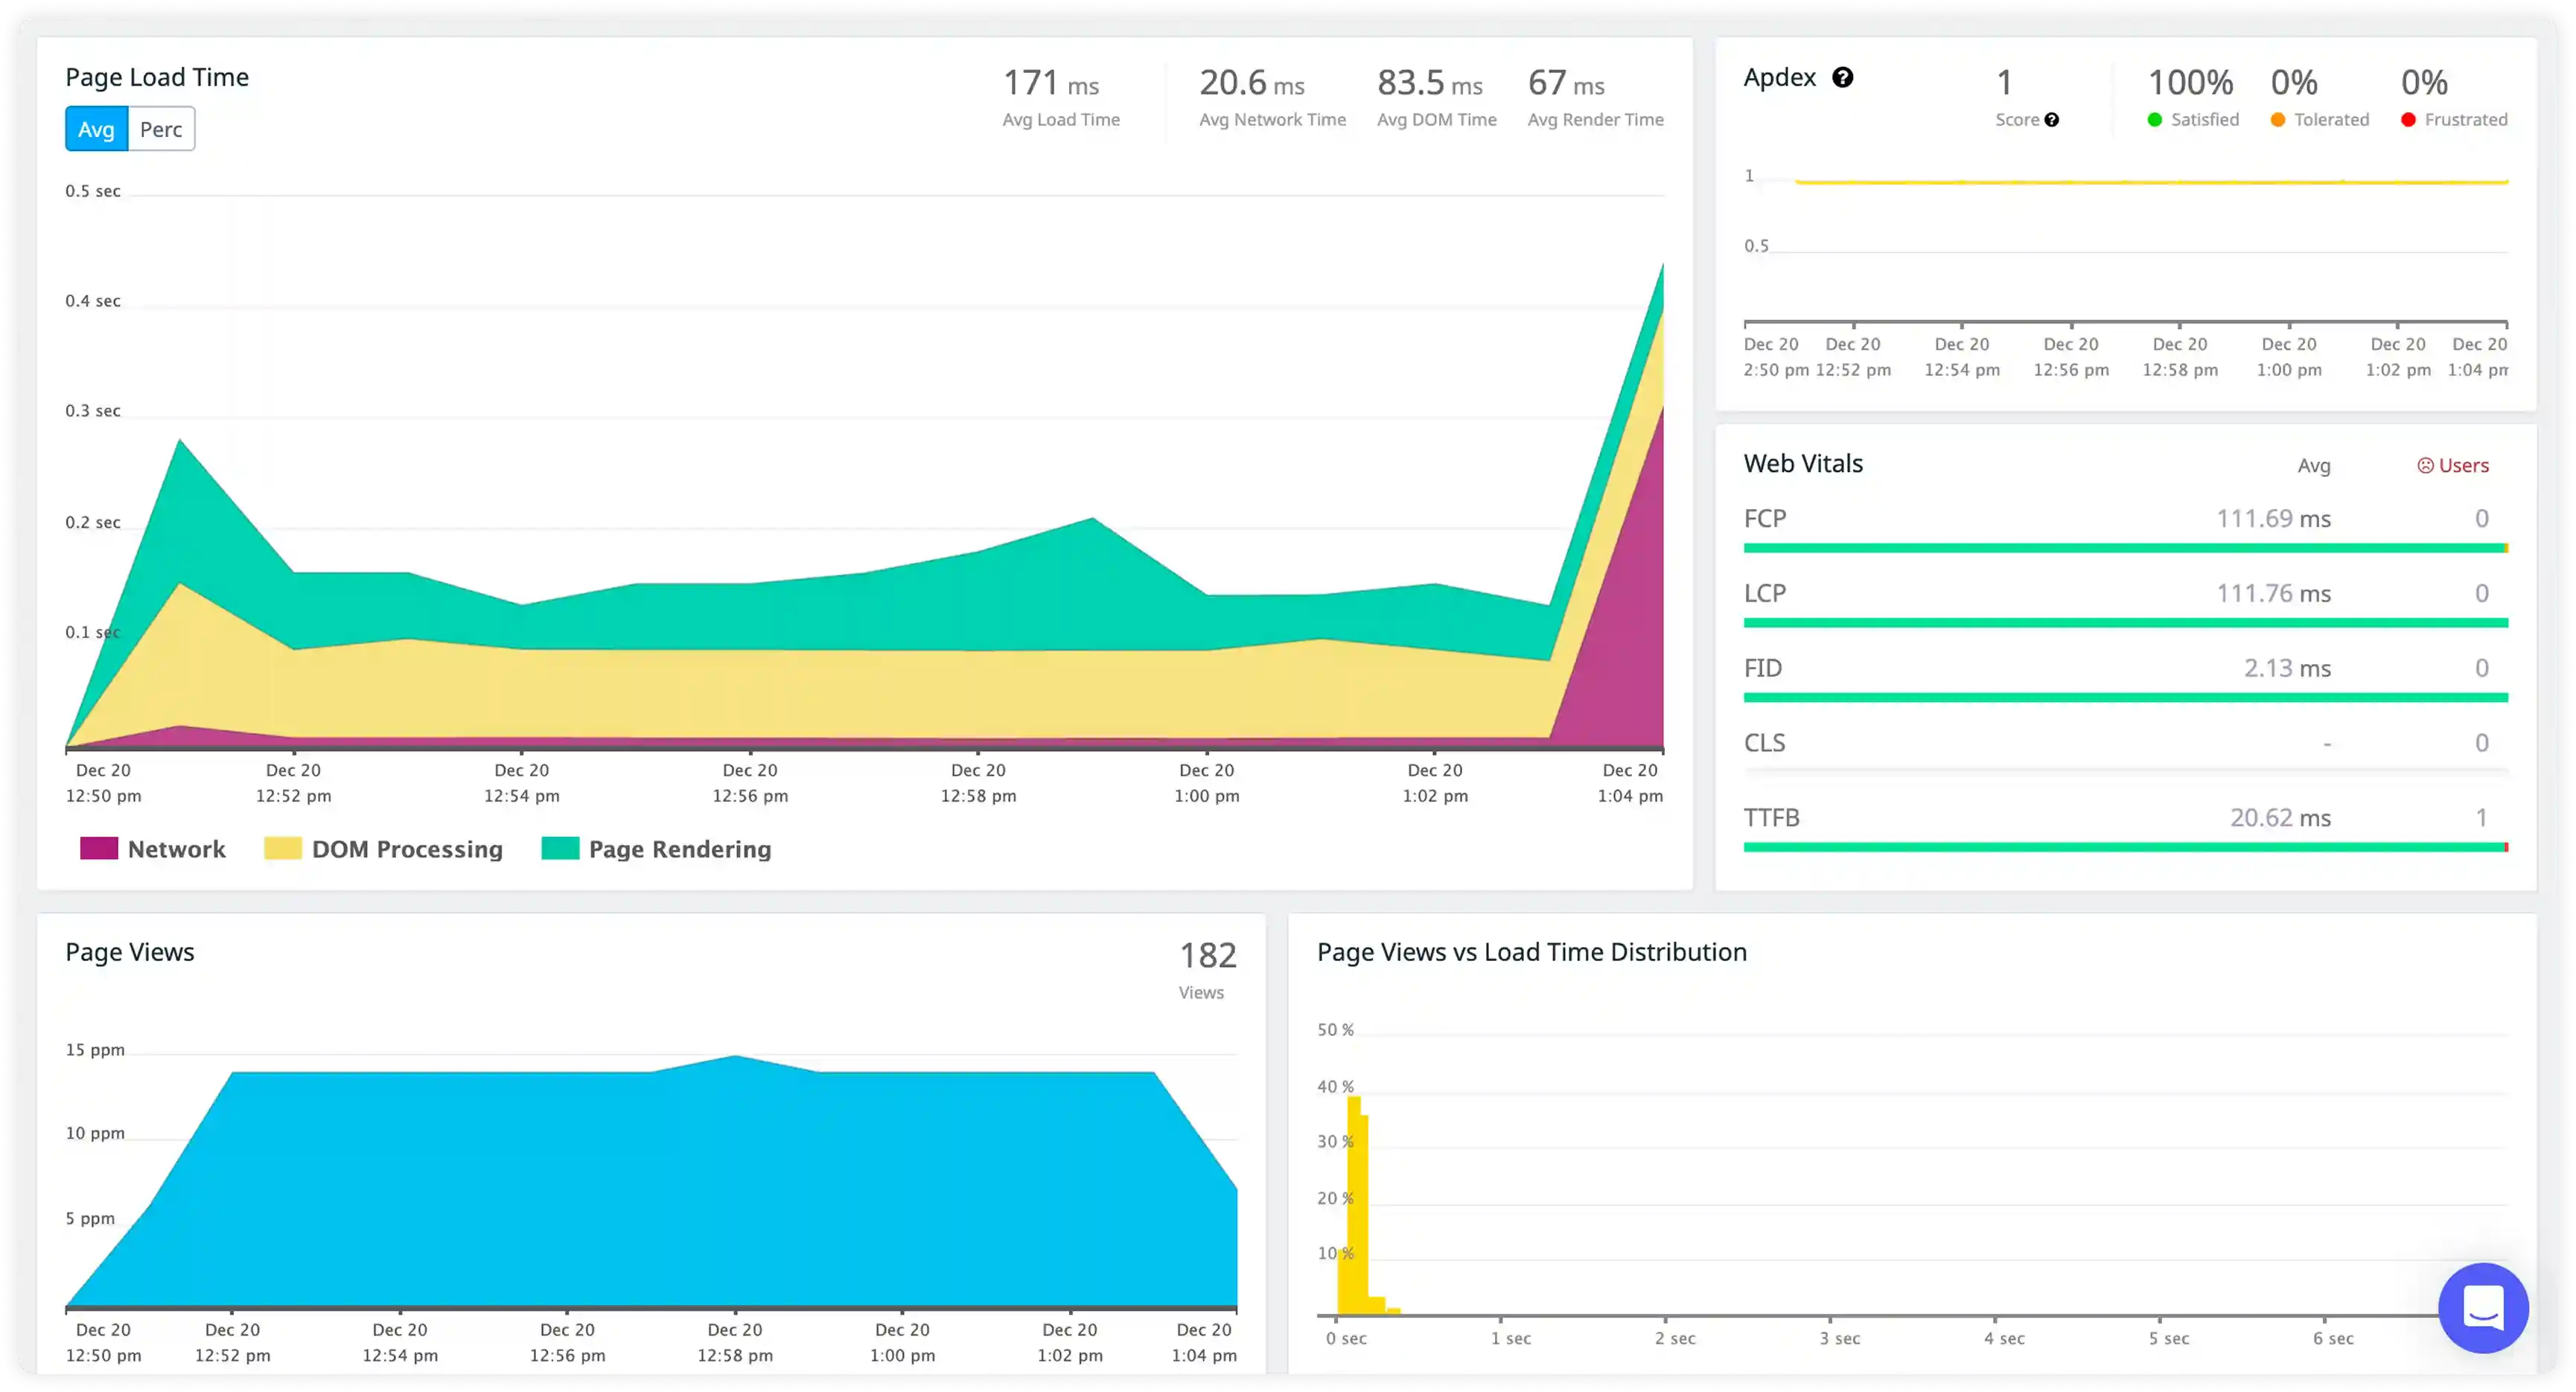
- Track real user page load times across devices, browsers, and geographies to see how performance behaves in production, not in test environments.
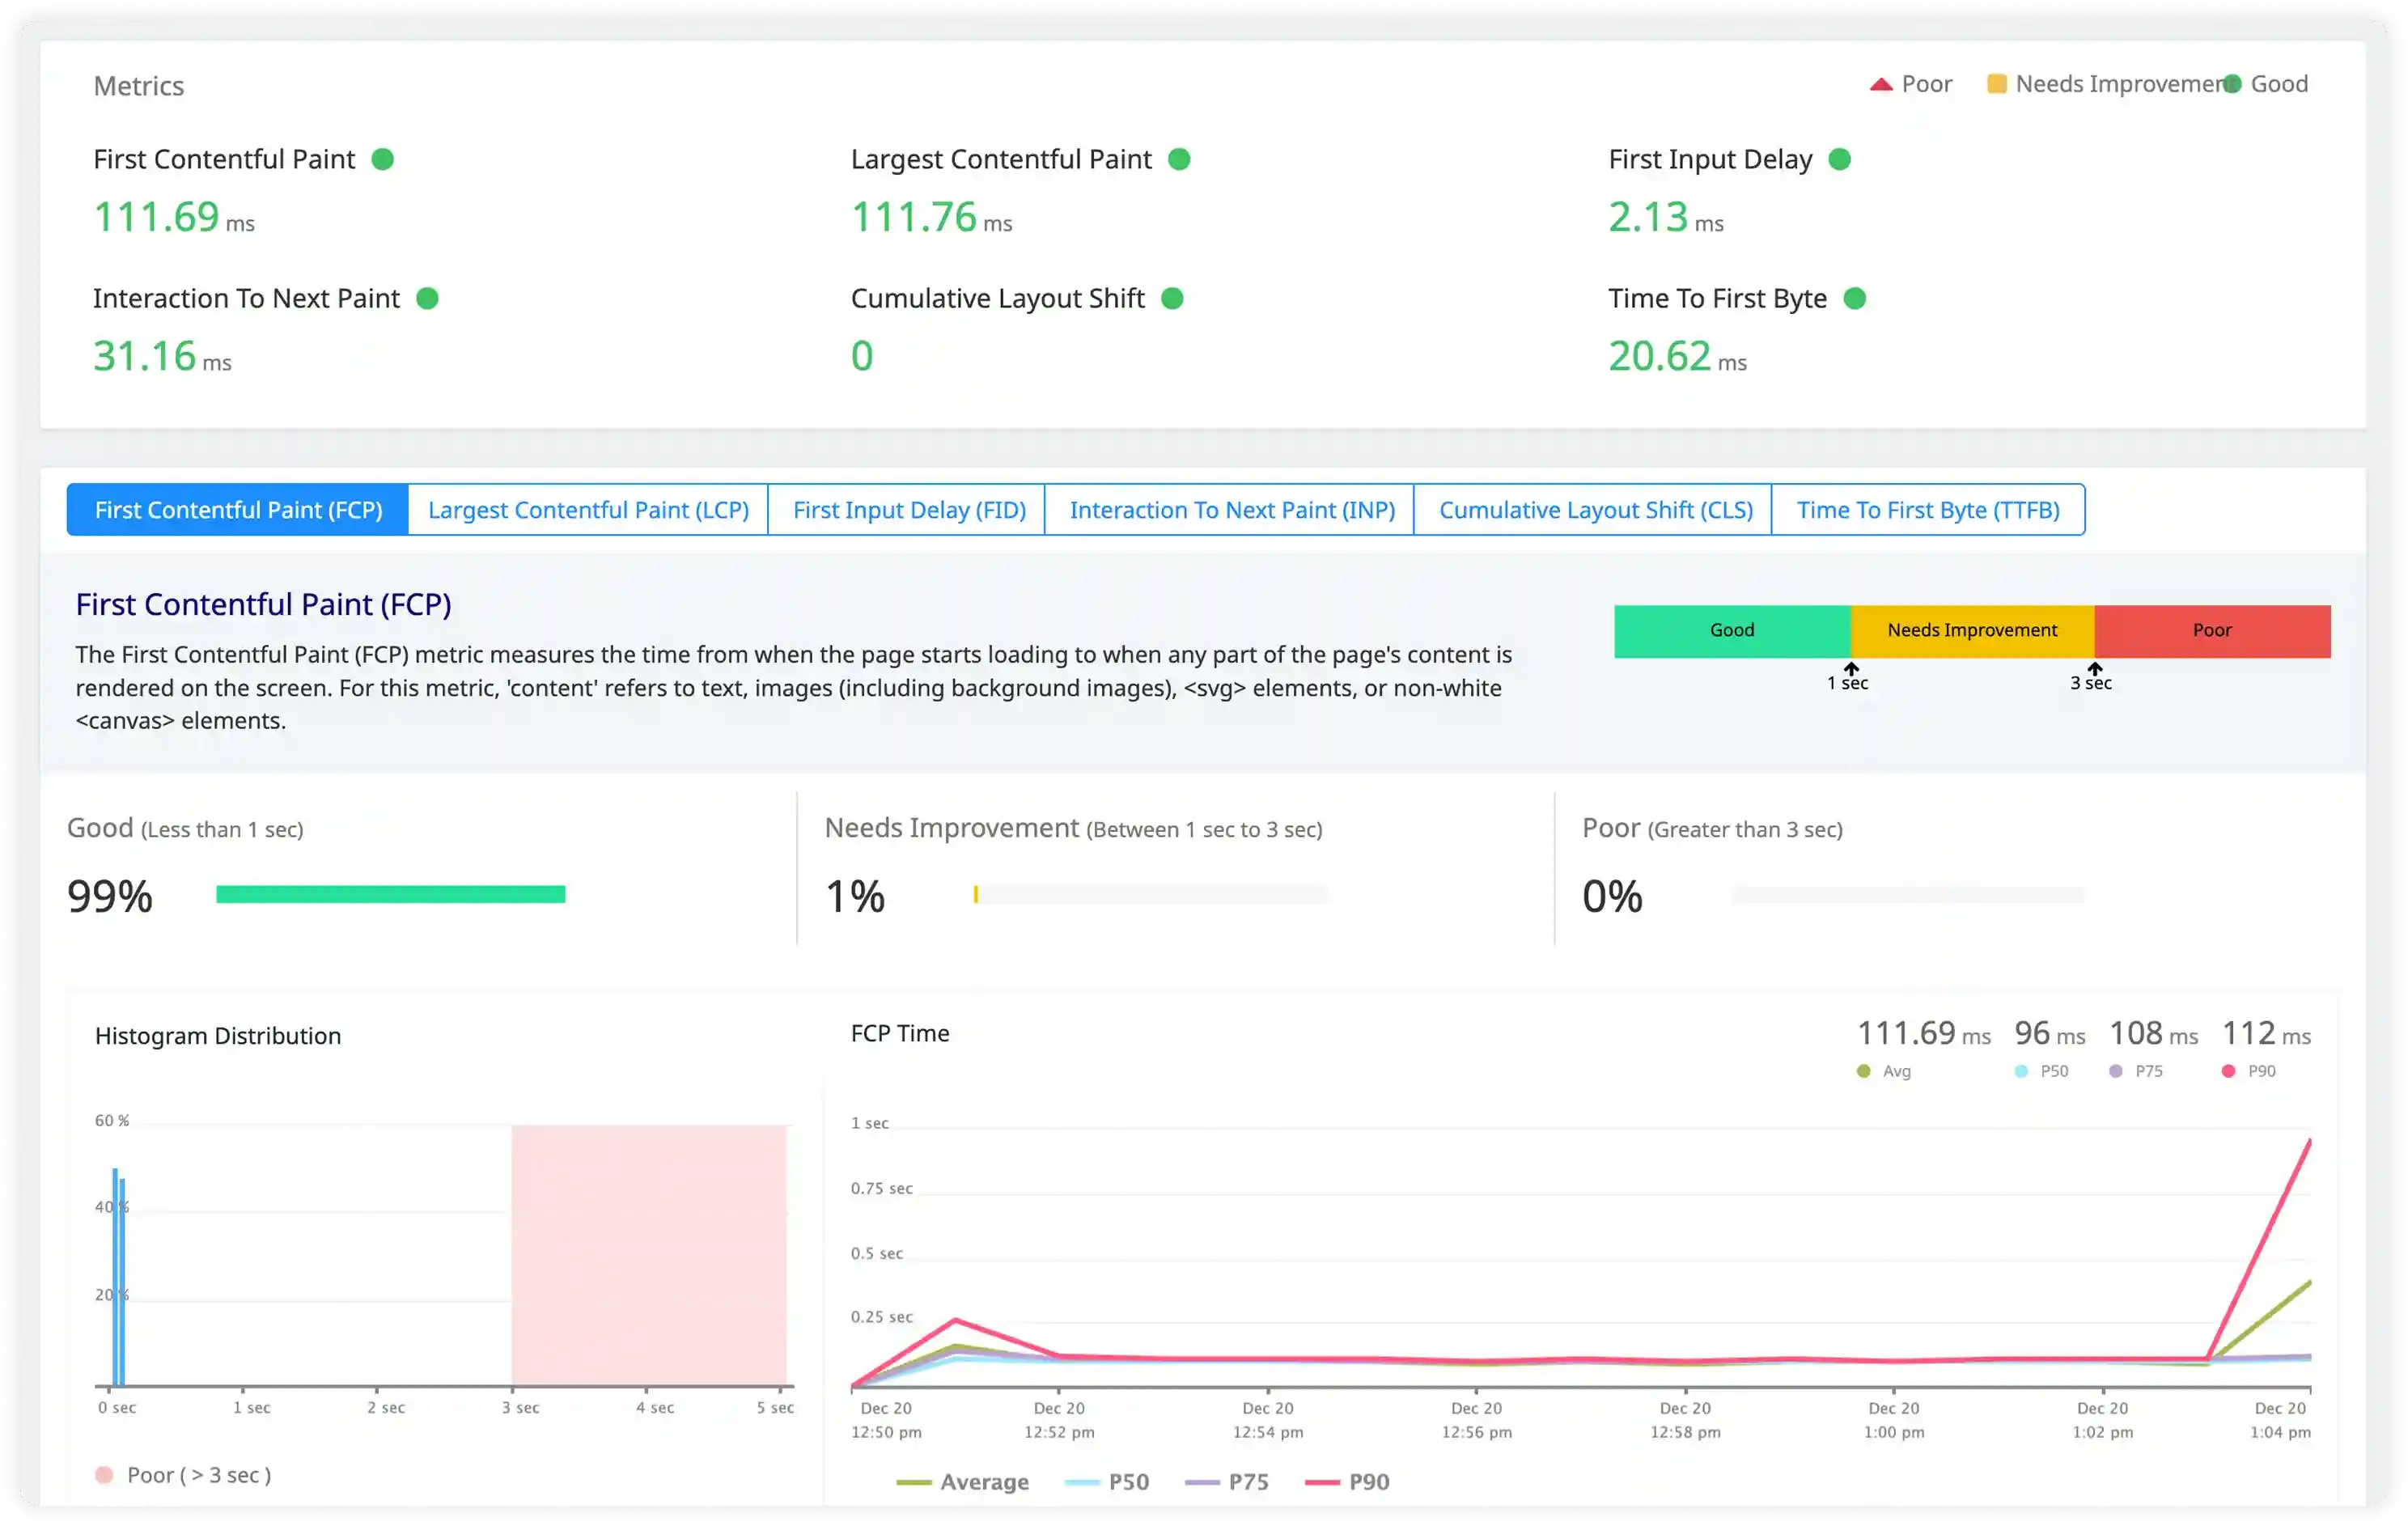
- Measure Core Web Vitals in real time, including LCP, INP, and CLS, to clearly understand what impacts user experience and search visibility.
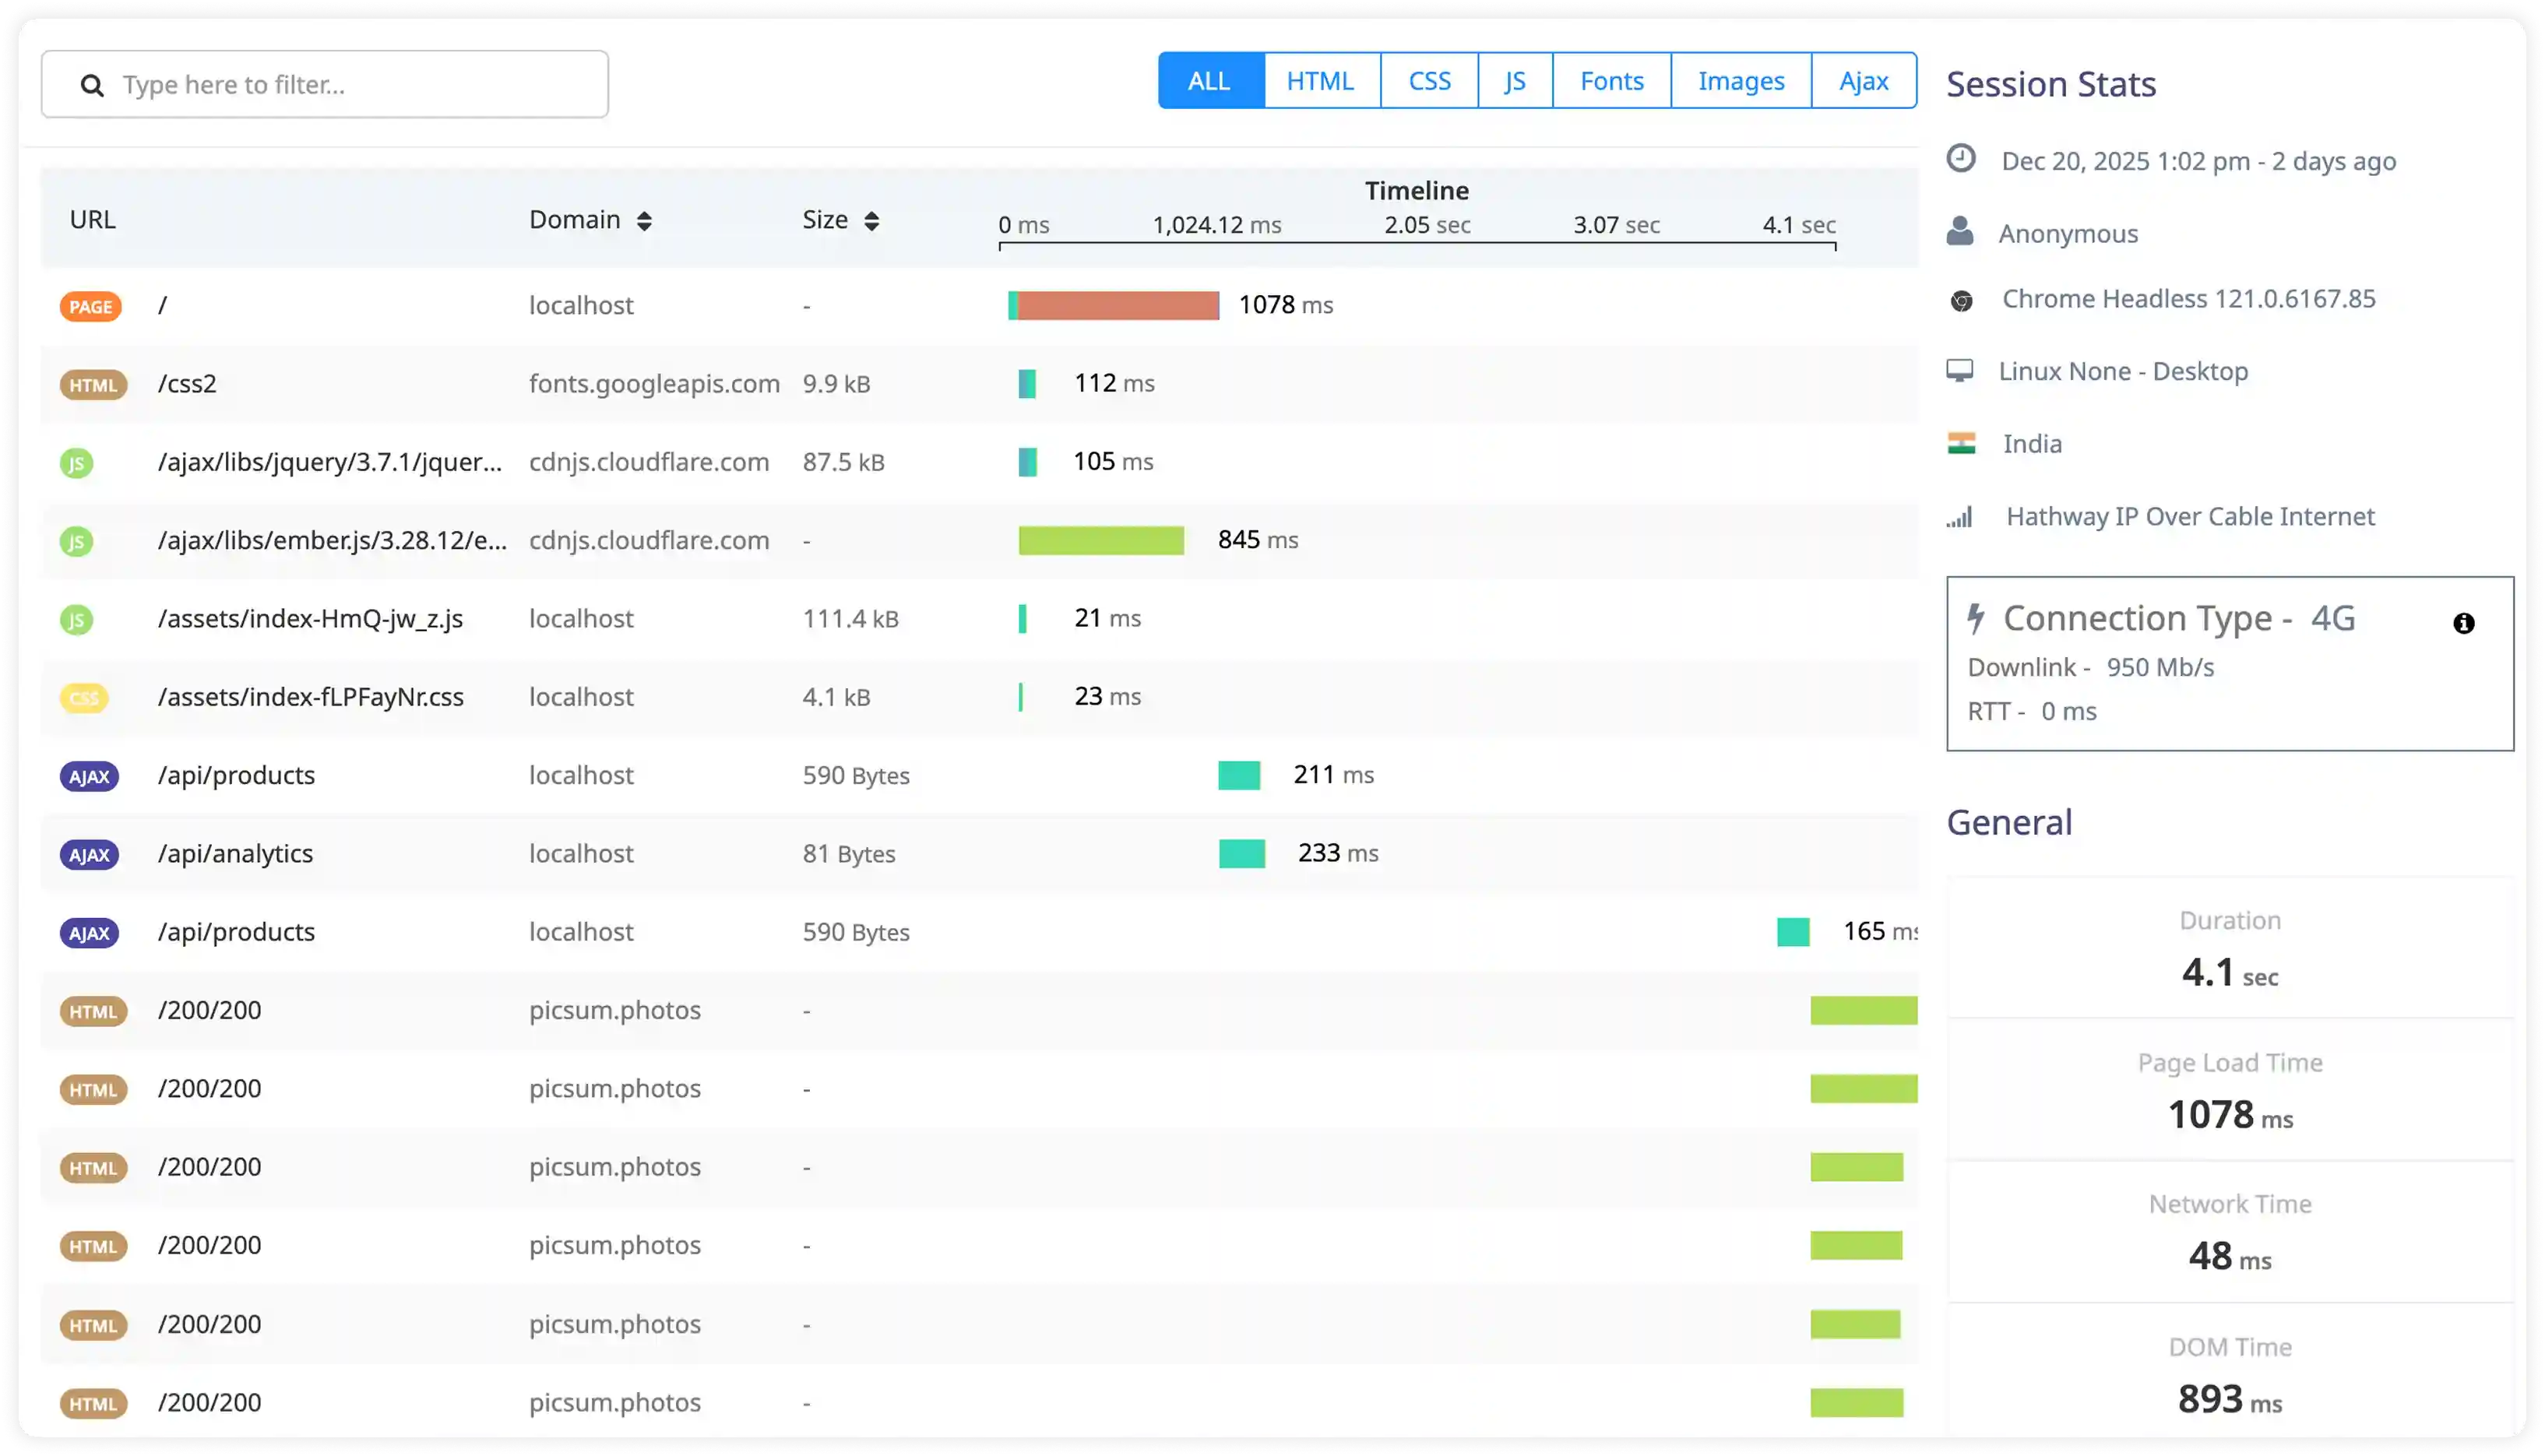
- Capture detailed resource timing data for scripts, APIs, and third-party assets to pinpoint what slows down real user sessions.
- Correlate frontend performance metrics with user actions and session flows to identify where slow experiences lead to drop-offs or reduced engagement.
Real User Session and Journey Insights
- Capture real user sessions with full context, including device type, browser, operating system, and geographic location, to understand performance variations in real environments.
- Track complete user interaction paths and navigation flows to identify slow routes and high-friction moments across the application.
- Analyze session-level performance metrics to see how load times and delays affect real user behavior and task completion.
- Prioritize optimizations based on real usage patterns, focusing engineering effort where it delivers measurable experience improvements.
Frontend Errors and AJAX Performance Monitoring
- Capture JavaScript errors from real user sessions with full context, including browser, device, and user actions leading up to the error.
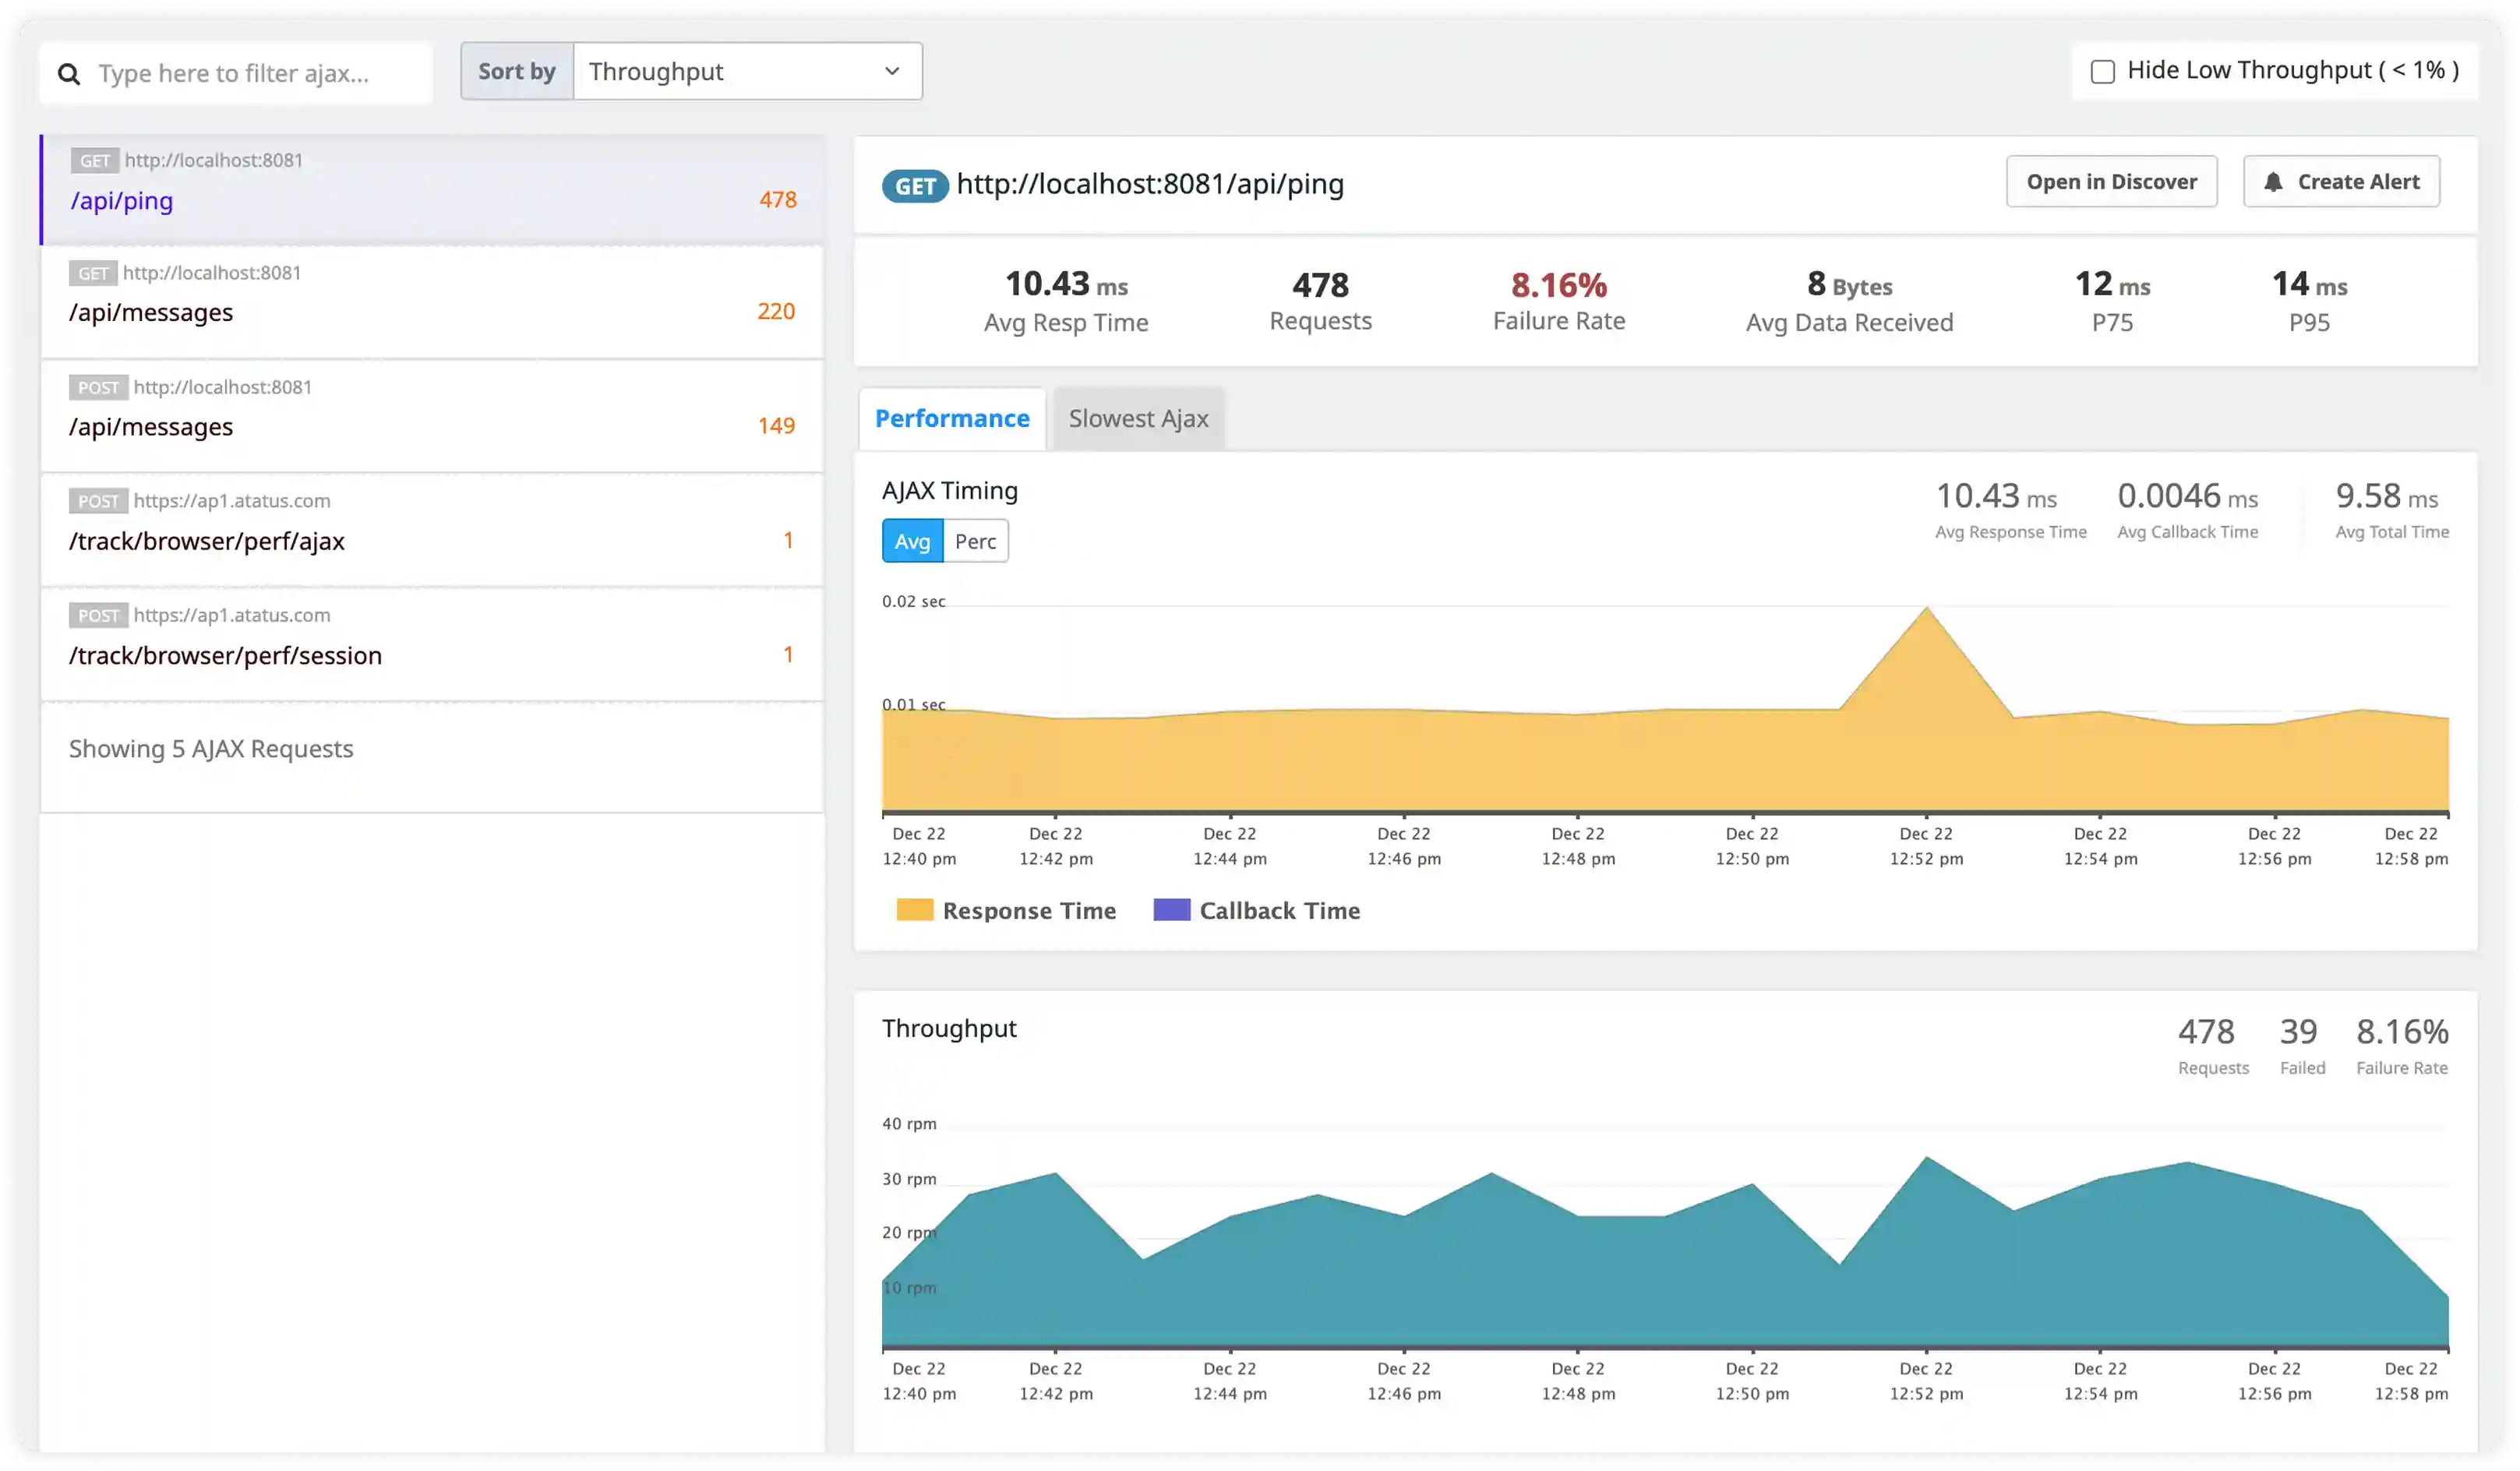
- Monitor AJAX and fetch request performance to see latency, failures, and slow responses impacting frontend interactions.
- Correlate client-side errors with specific pages, routes, and user flows to quickly isolate where experiences break.
- Prioritize fixes based on real user impact, focusing on errors and slow calls that affect the highest number of sessions.
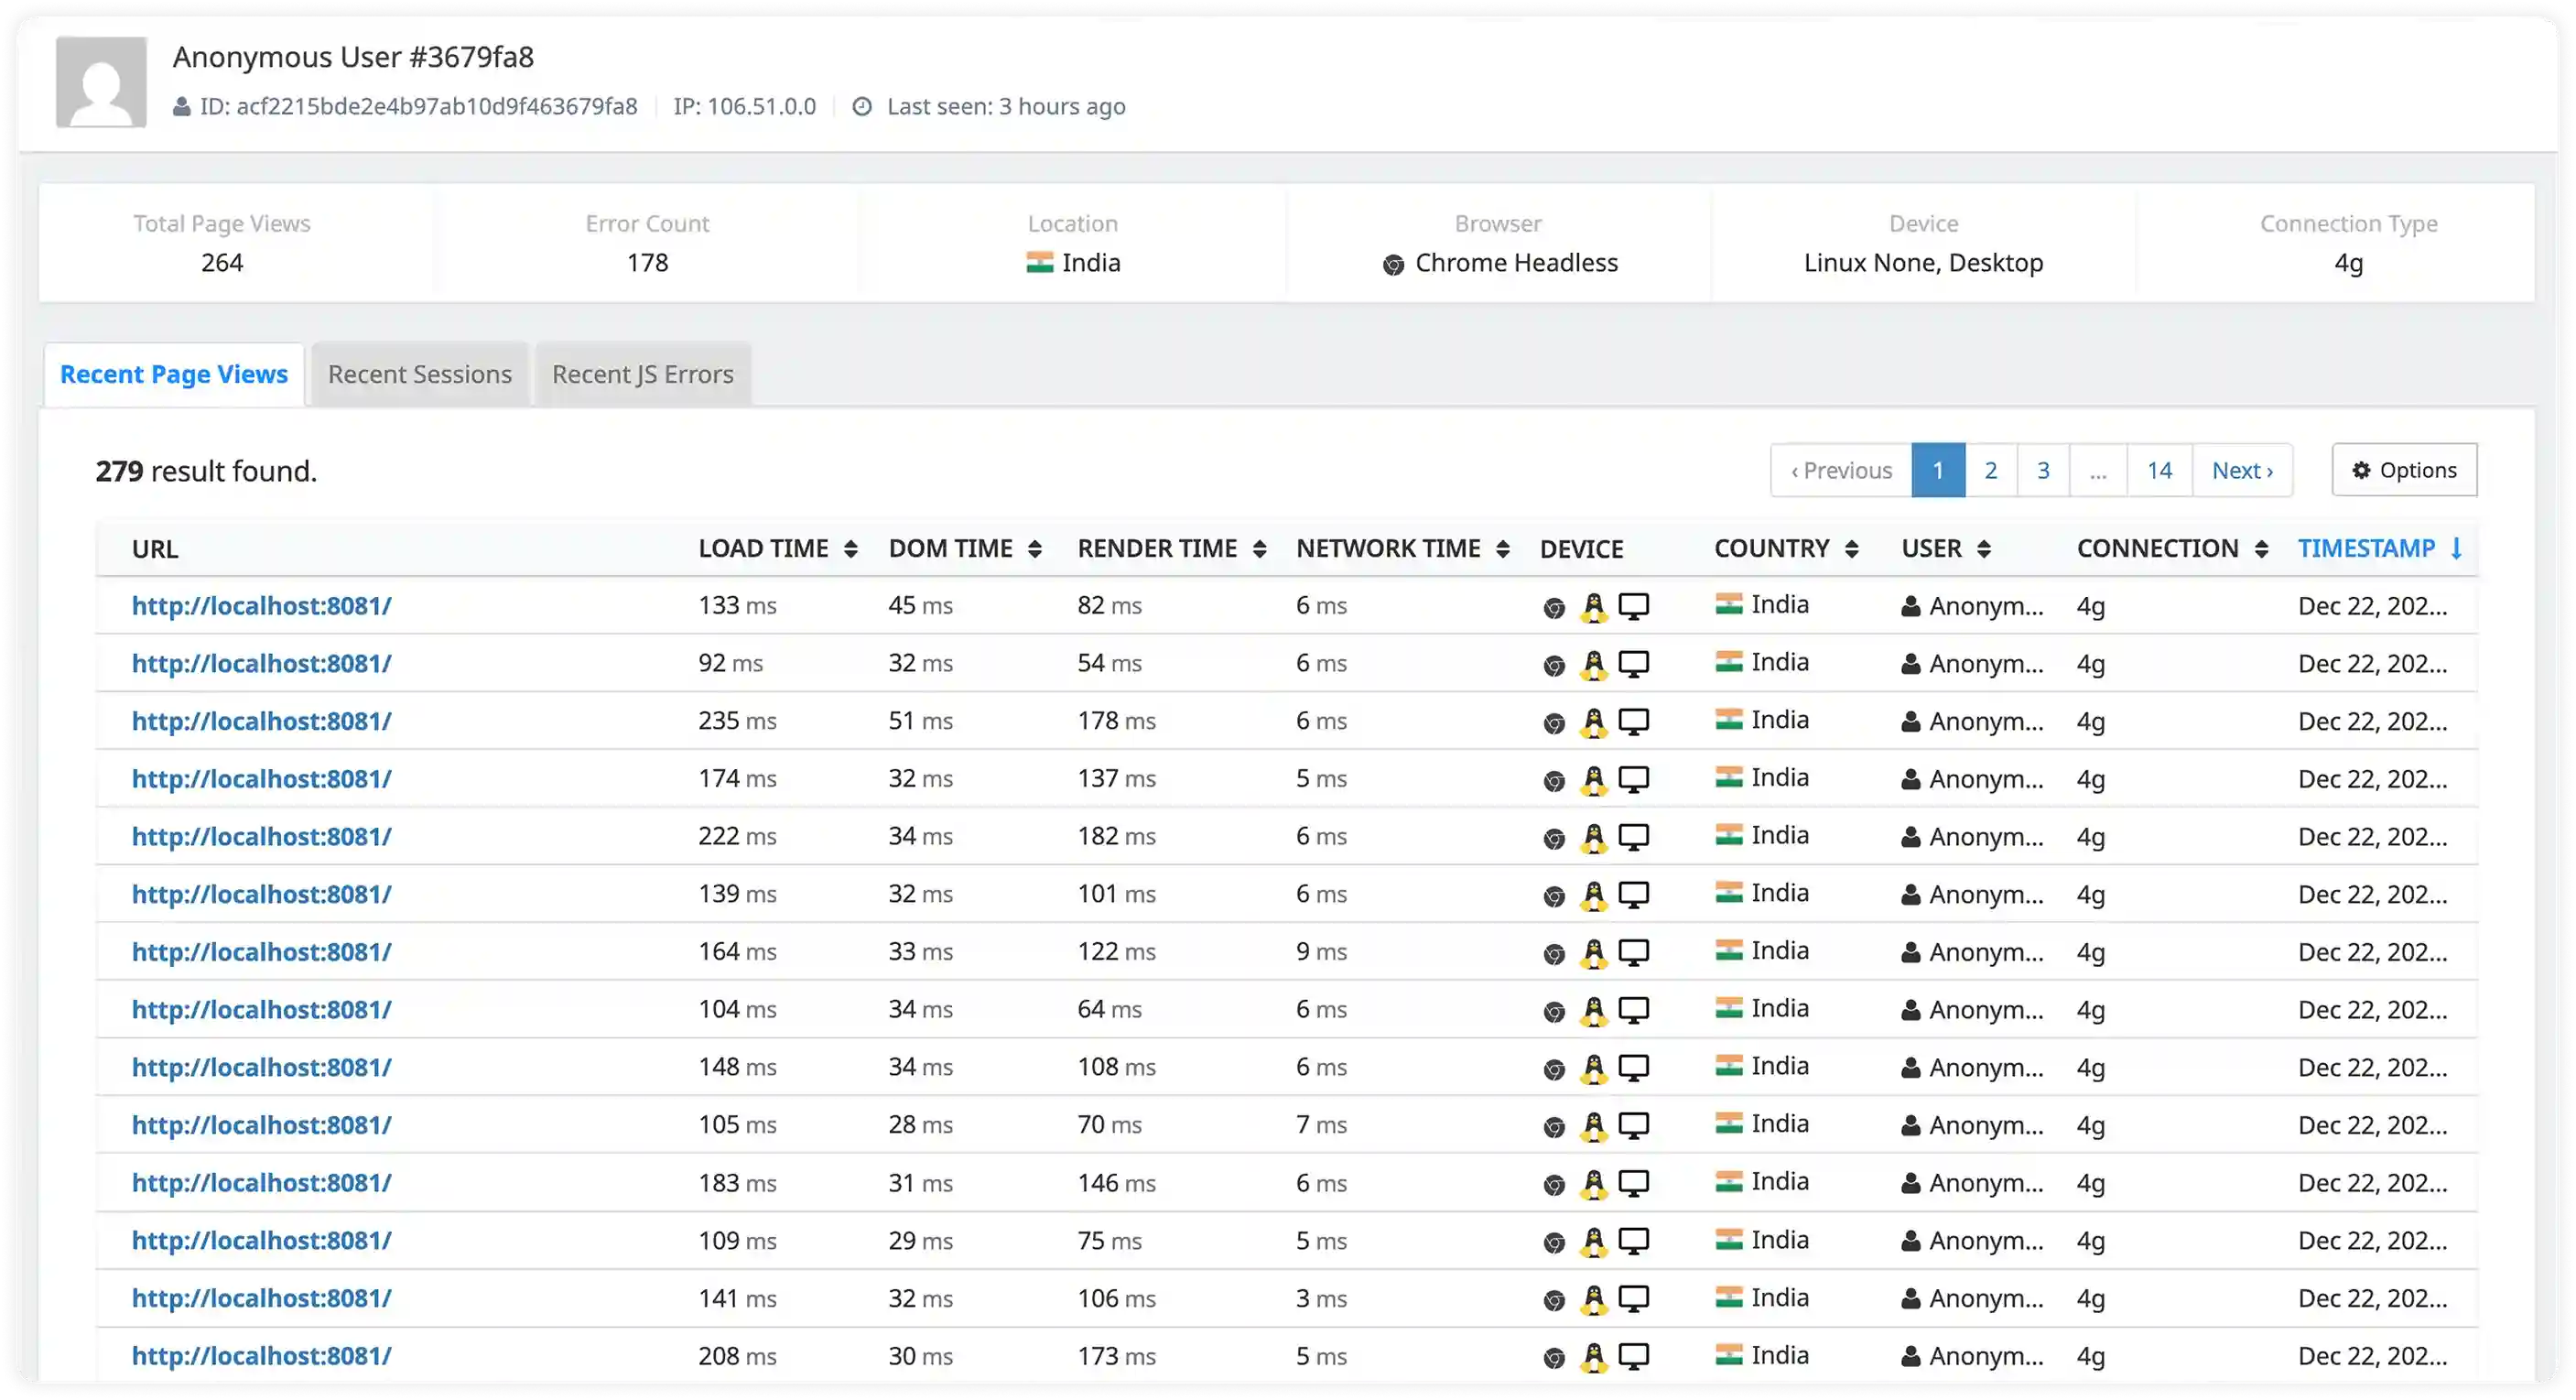
Single Page App and Route Change Tracking
- Track SPA route changes and virtual page views to understand performance beyond traditional full page reloads.
- Measure load times and delays for each route transition to identify slow views and interaction bottlenecks.
- Correlate route-level performance with user actions to see how clicks, state changes, and navigation impact responsiveness.
- Gain clear visibility into dynamic application behavior so teams can optimize real user flows in modern frontend frameworks.
Start Monitoring in Under 5 Minutes
Three simple steps to complete observability. No credit card required.
Embed Atatus RUM Snippet
Insert a small, lightweight JavaScript snippet into your website's HTML. It takes just a few lines of code and works with any web stack.
Start Capturing Real User Data
As visitors interact with your site, Atatus automatically collects performance metrics including page load times, Core Web Vitals, errors, AJAX requests, user sessions, and more.
Visualize Your RUM Dashboard
Log in to your Atatus dashboard to explore real-time insights across geography, browser, device, and user behavior with built-in reports and alerts to help you take action fast.
Milestones that spark performance excellence
Reflections from clients who've achieved unmatched excellence through innovative strategies.
Read customer stories


