Angular Error and Performance Monitoring
Get complete visibility into your Angular errors and performance issues that are impacting your end user experience. Fix critical issues sooner with in depth data points that helps you in analyzing and resolving issues with great speed.
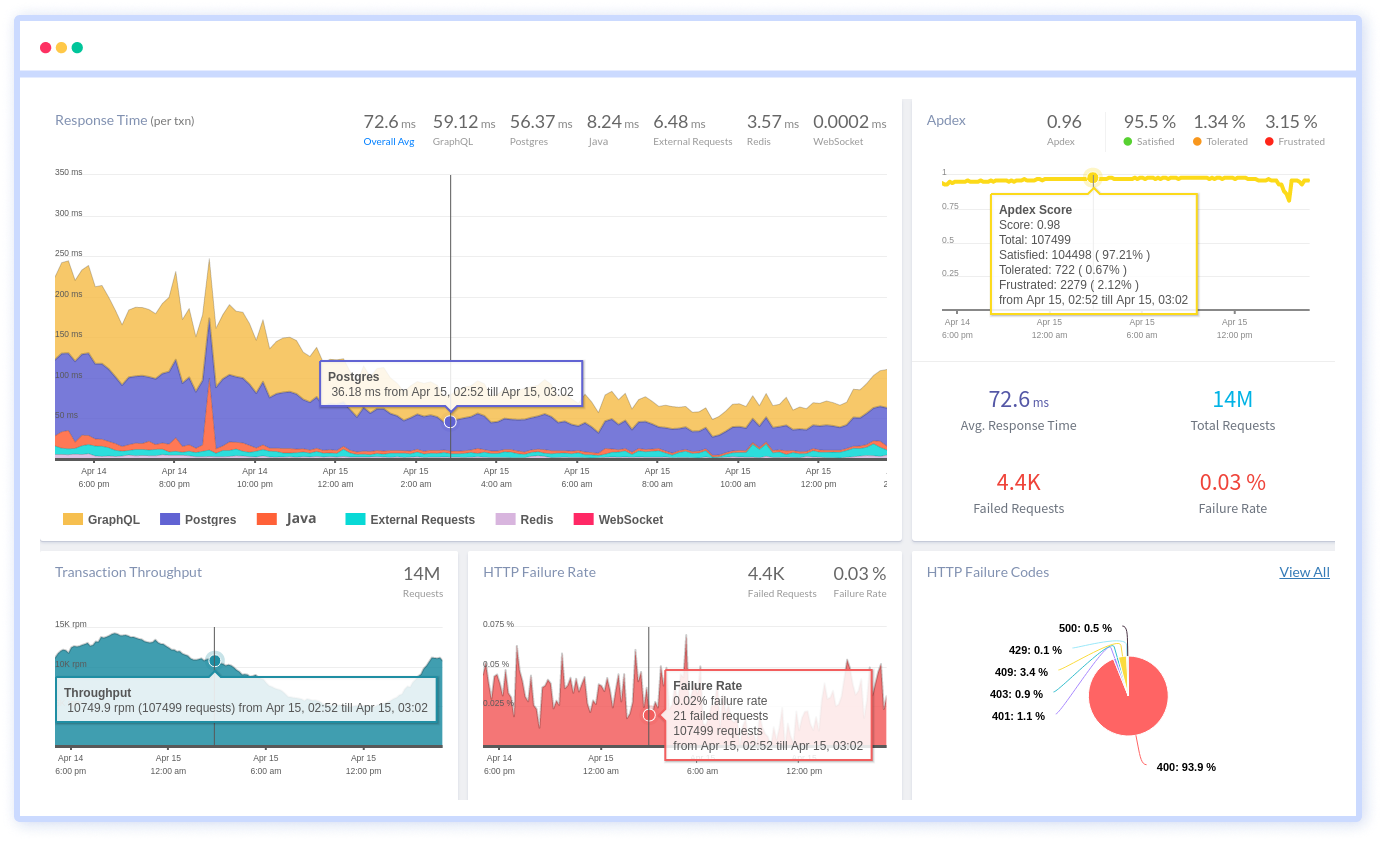
Get deep visibility into how real users experience your Angular app
Real user session visibility
Understand how real users navigate, interact, and experience your Angular application under live traffic. Track full user sessions to identify friction points that backend monitoring cannot reveal.
Angular route performance insights
Monitor Angular Router navigation and virtual page loads to see which routes are slow and why. Identify delays caused by JavaScript execution, API calls, or heavy component rendering.
Frontend performance metrics
Measure real-world frontend performance including load time, interaction latency, and Core Web Vitals (LCP, CLS, INP). See how Angular performance varies across devices, browsers, and networks.
Runtime javaScript & angular errors
Capture runtime JavaScript errors and Angular-specific failures that don’t crash the app but break user experience. View stack traces with route, browser, and release context.
User interaction issues
Detect slow or broken user interactions such as repeated clicks, unresponsive buttons, and stalled flows. Identify UX issues caused by frontend logic rather than backend failures.
Session-to-code correlation
Connect user sessions directly to frontend errors, slow routes, and backend APIs. Quickly trace issues from real user impact to the exact Angular code path responsible.
Browser & device-level insights
Analyze Angular performance across different browsers, devices, and operating systems. Identify environment-specific issues that affect only certain user segments.
Faster frontend debugging
Use real user context to prioritize and fix Angular issues faster. Reduce time spent guessing by focusing on problems that impact real users the most.
Change Detection Execution
- Measure change detection cycle frequency at component level during real user interaction and correlate execution cost with DOM update latency.
- Identify template bindings, @Input propagation, and event handlers that trigger repeated view checks without actual state changes.
- Analyze lifecycle hook execution timing during initialization and update phases to isolate rendering delay contributors.
- Detect propagation of state updates across component hierarchies that causes redundant change detection passes and UI instability.

Zone-Based Asynchronous Execution
- Track asynchronous task execution within Angular Zone context and measure delay between task scheduling and UI rendering.
- Analyze microtask and macrotask queue behavior during API calls, timers, and user-triggered workflows.
- Identify concurrent async execution paths that block rendering and delay interaction readiness.
- Correlate asynchronous execution timing with navigation latency and screen stability issues.

Router and Lazy Module Execution
- Break down route transition timing across guards, resolvers, lazy module loading, and component bootstrap execution.
- Identify blocking operations during route initialization that delay first render and user interaction.
- Measure lazy-loaded module download and initialization latency across devices and network conditions.
- Correlate navigation execution timing with workflow interruptions and interaction delays.

RxJS Stream and Subscription Execution
- Measure latency between Observable emission, operator execution, and DOM rendering during real user sessions.
- Identify RxJS operator chains that introduce processing overhead in navigation, search, and dynamic UI updates.
- Detect persistent subscriptions that continue triggering component updates after state stabilization.
- Analyze concurrent stream execution and its impact on rendering performance and interaction responsiveness.

Why Choose Atatus for Angular RUM?
Gain Real-time visibility into Angular component performance, SPA navigation, and Core Web Vitals without stack complexity
Built for Angular execution
Tailored insights into component load times, change detection, and SPA routing behavior in production environments.
Faster frontend diagnosis
Real-time error tracking with Angular-specific stack traces and repro steps accelerates issue resolution.
Low operational overhead
Lightweight agent with zero sampling ensures minimal performance impact on Angular applications.
Clear Core Web Vitals signals
Actionable LCP, FID, CLS metrics surfaced without overwhelming developers with noise.
Scales global SaaS workloads
Handles high-traffic Angular SPAs across geo-regions with enterprise-grade reliability.
Predictable usage pricing
Scalable pricing grows with your user base—no contracts or restrictive feature tiers.
Unified Observability for Every Engineering Team
Atatus adapts to how engineering teams work across development, operations, and reliability.
Developers
Trace requests, debug errors, and identify performance issues at the code level with clear context.
DevOps
Track deployments, monitor infrastructure impact, and understand how releases affect application stability.
Release Engineer
Measure service health, latency, and error rates to maintain reliability and reduce production risk.