Ember Error and Performance Monitoring
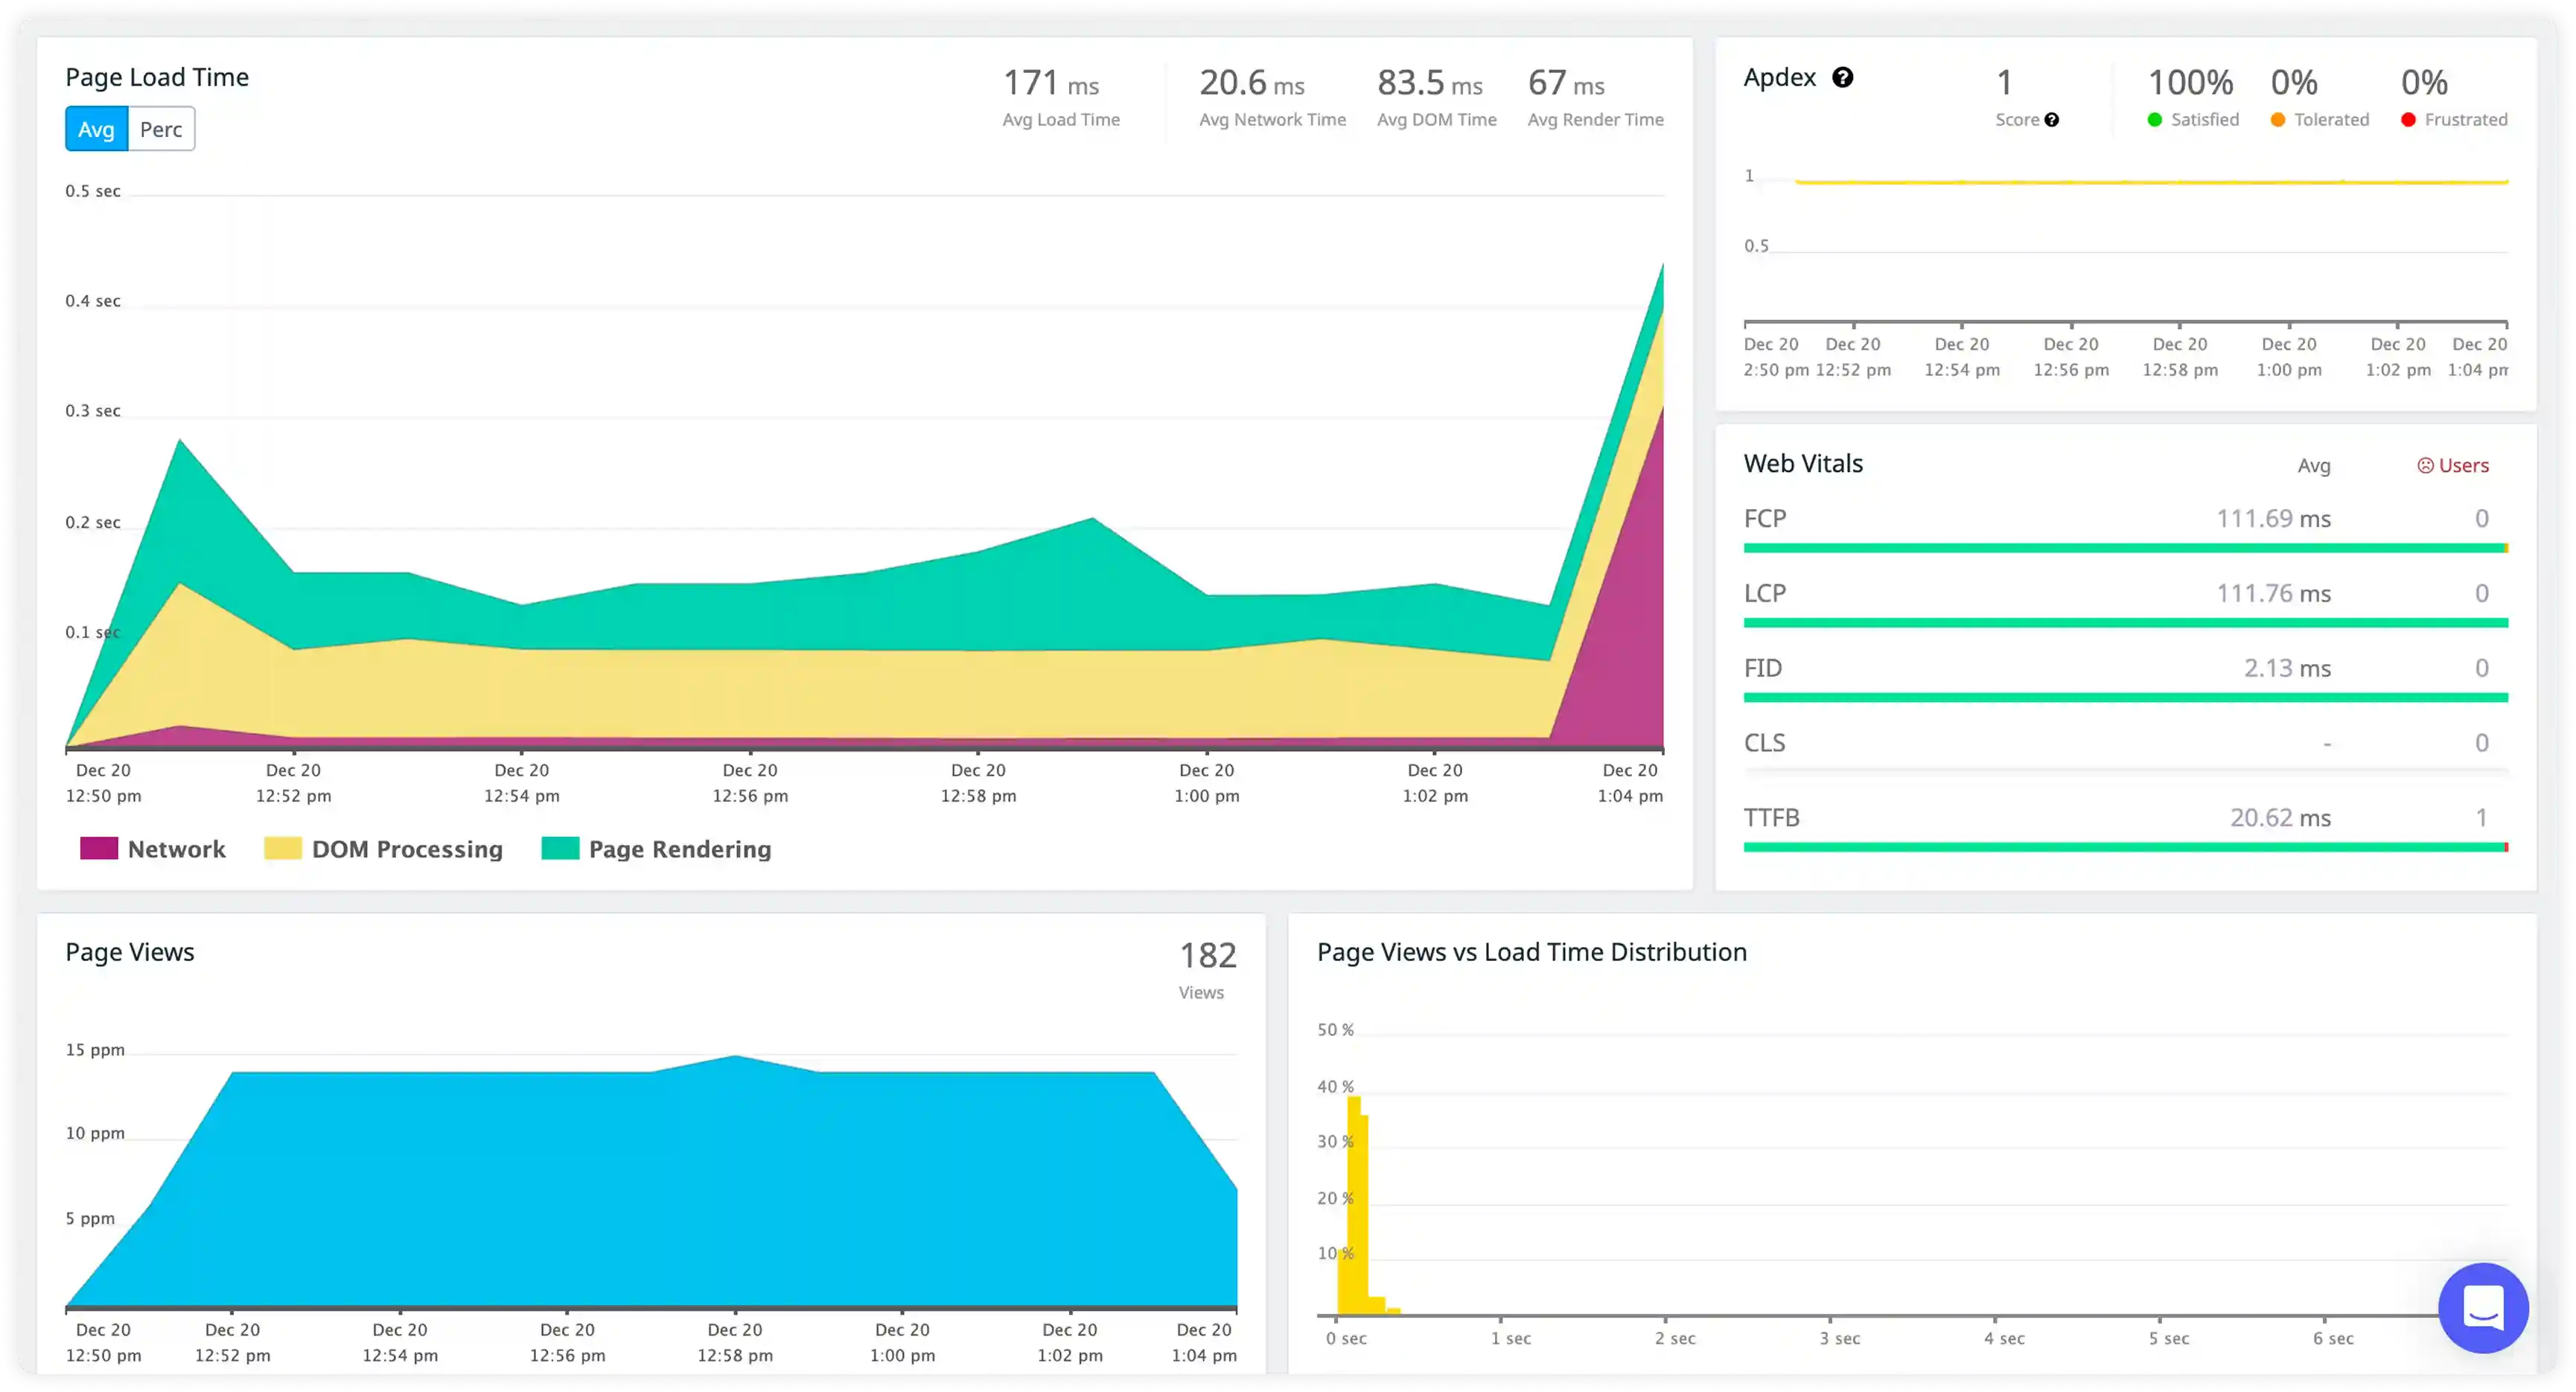
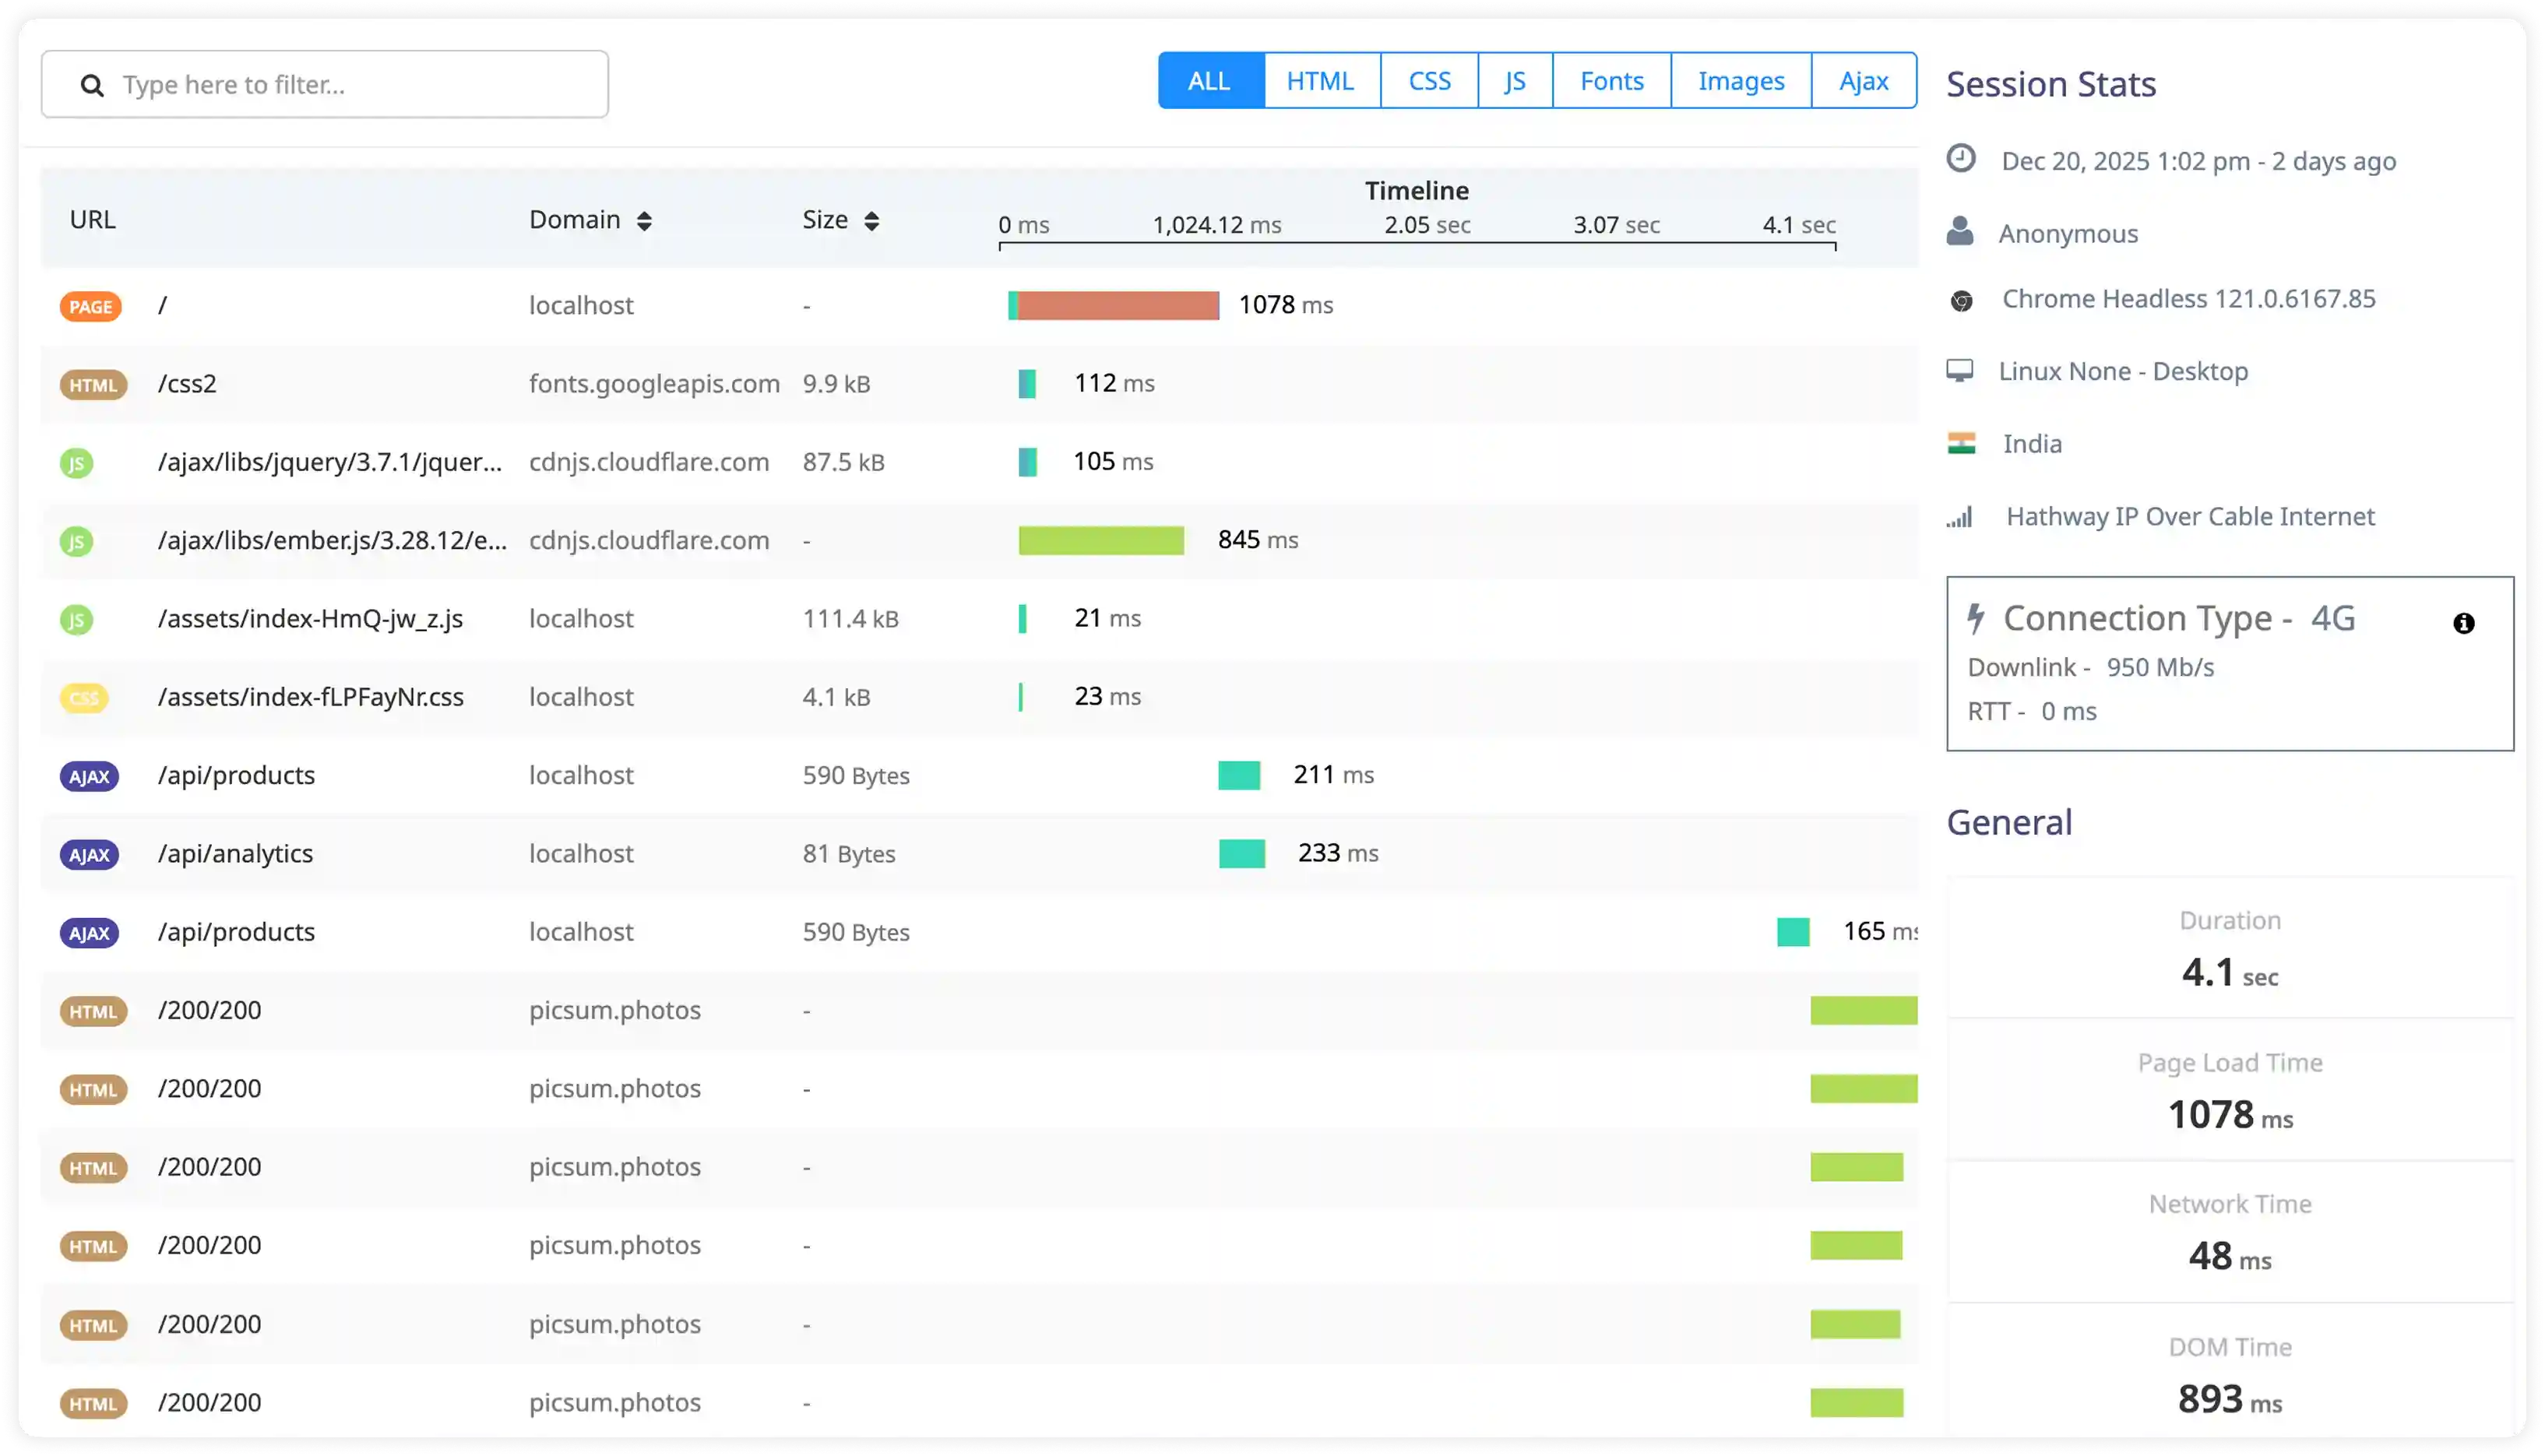
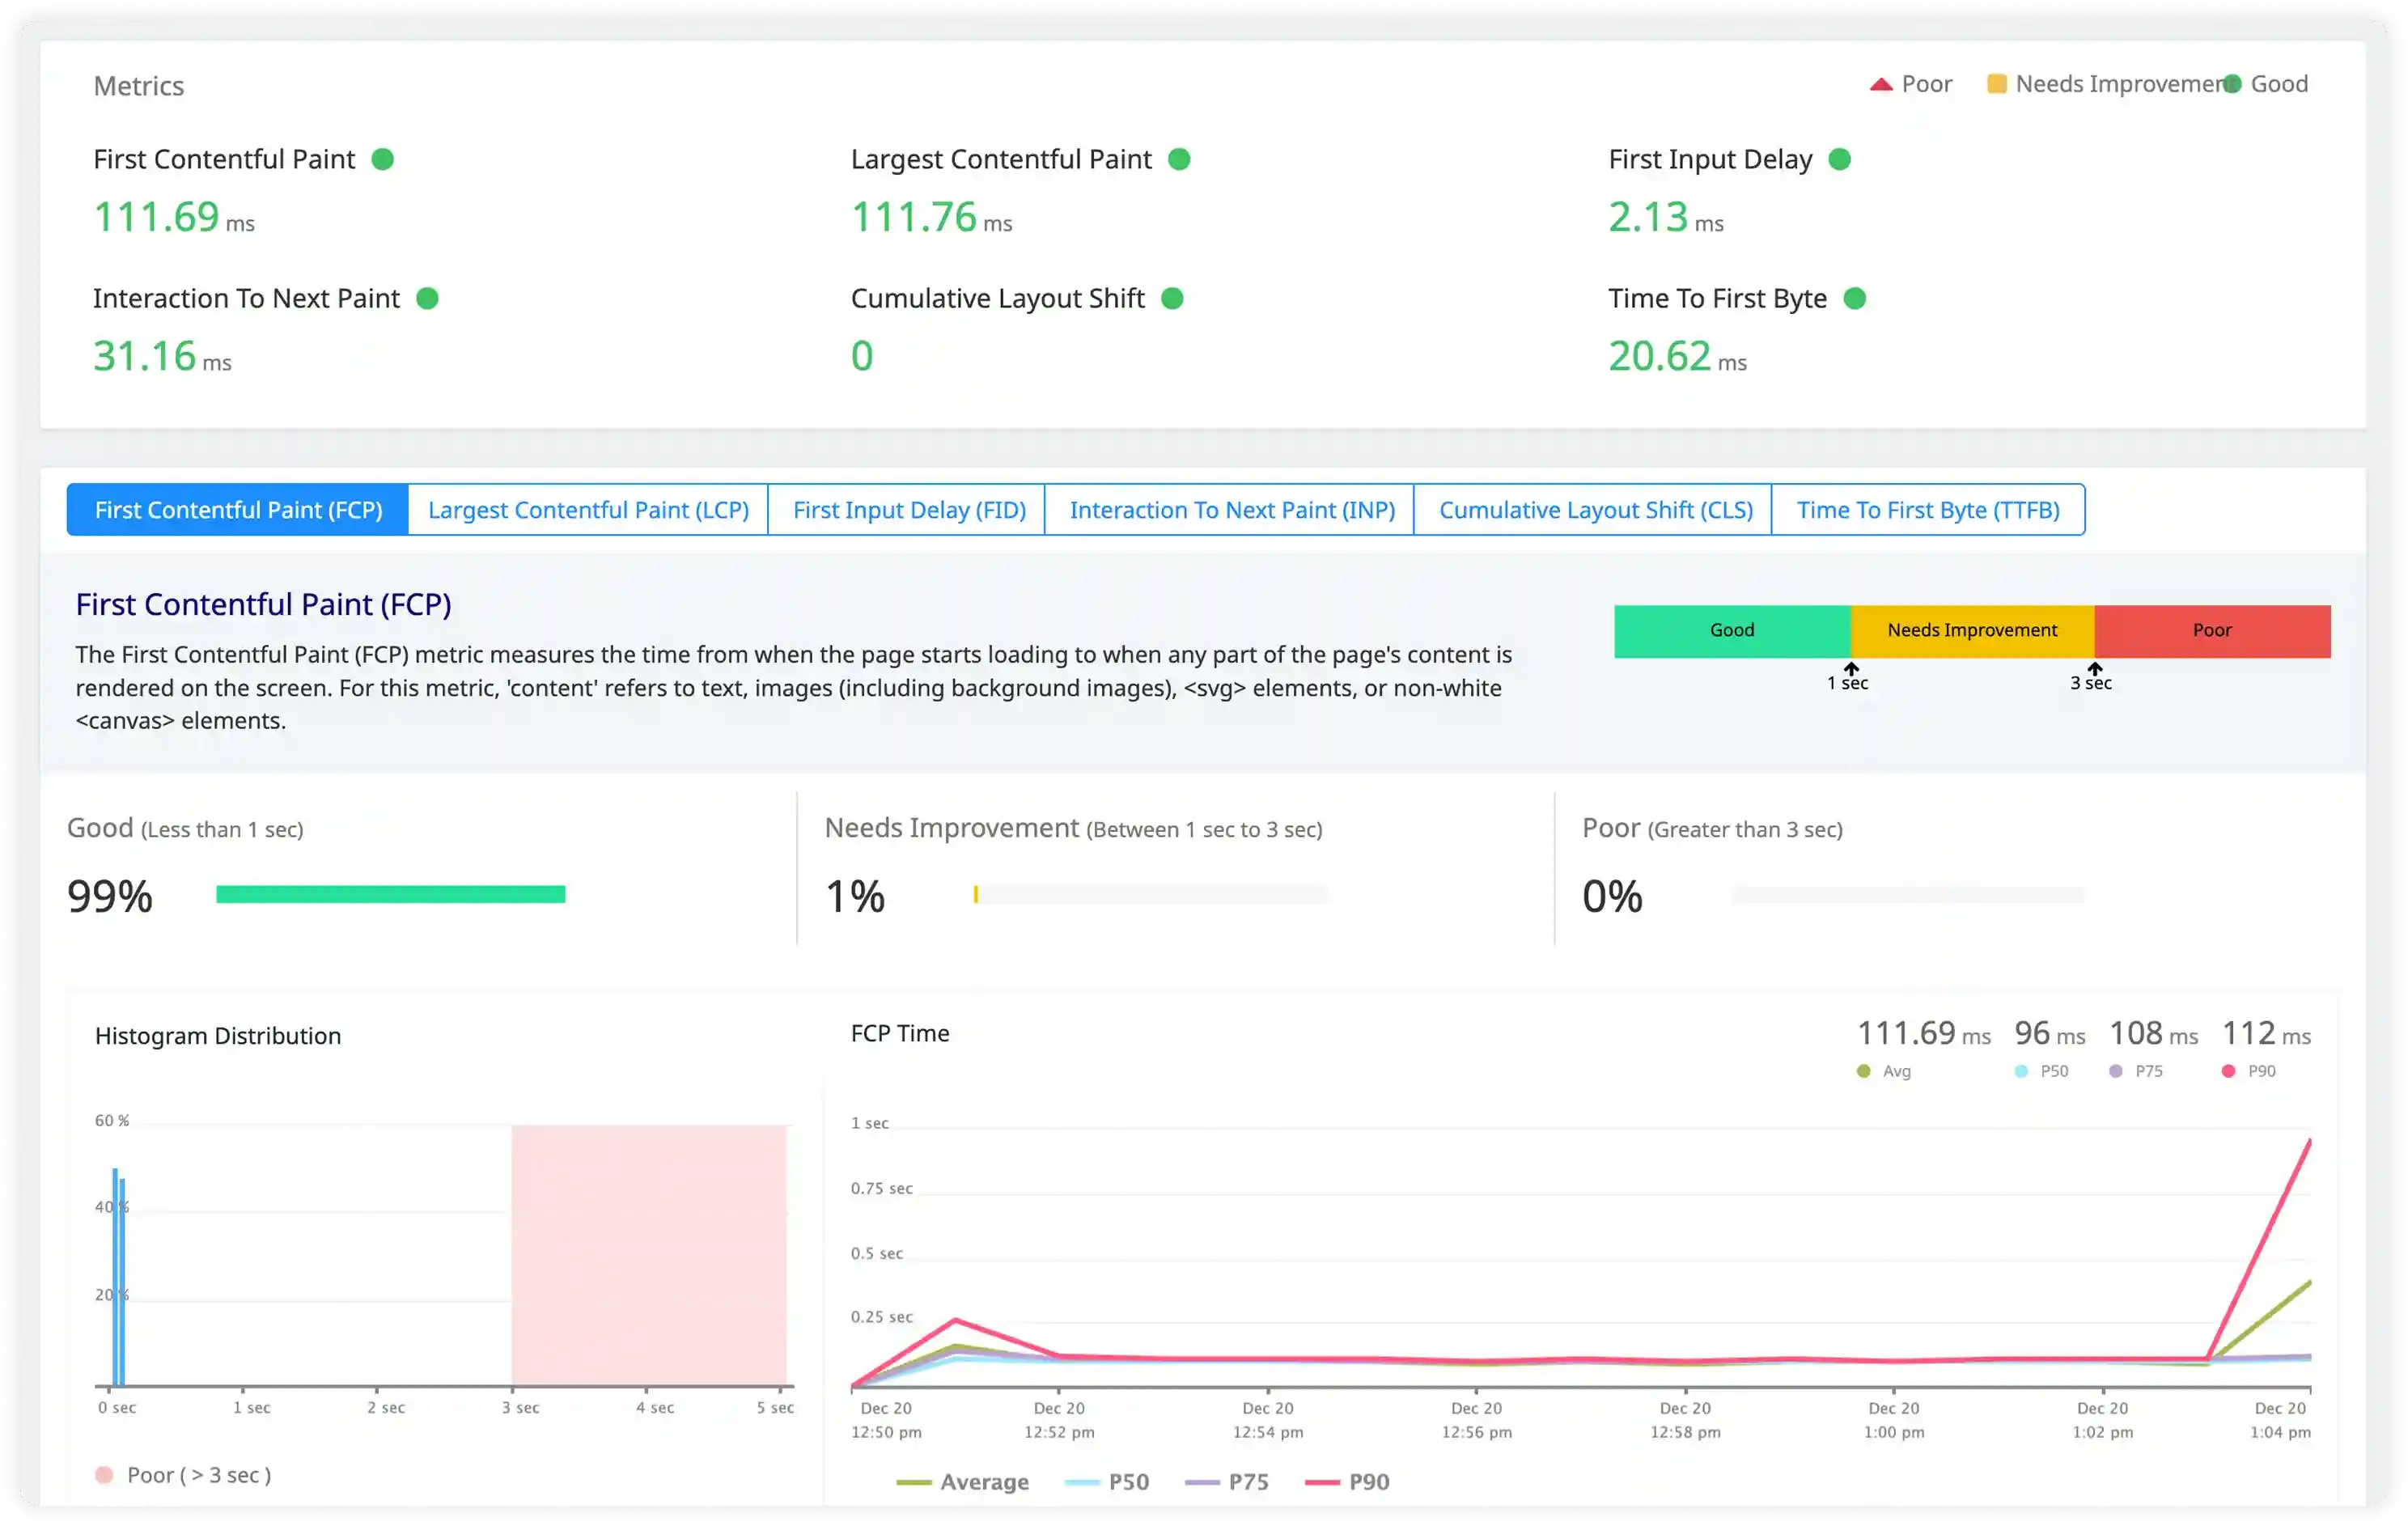
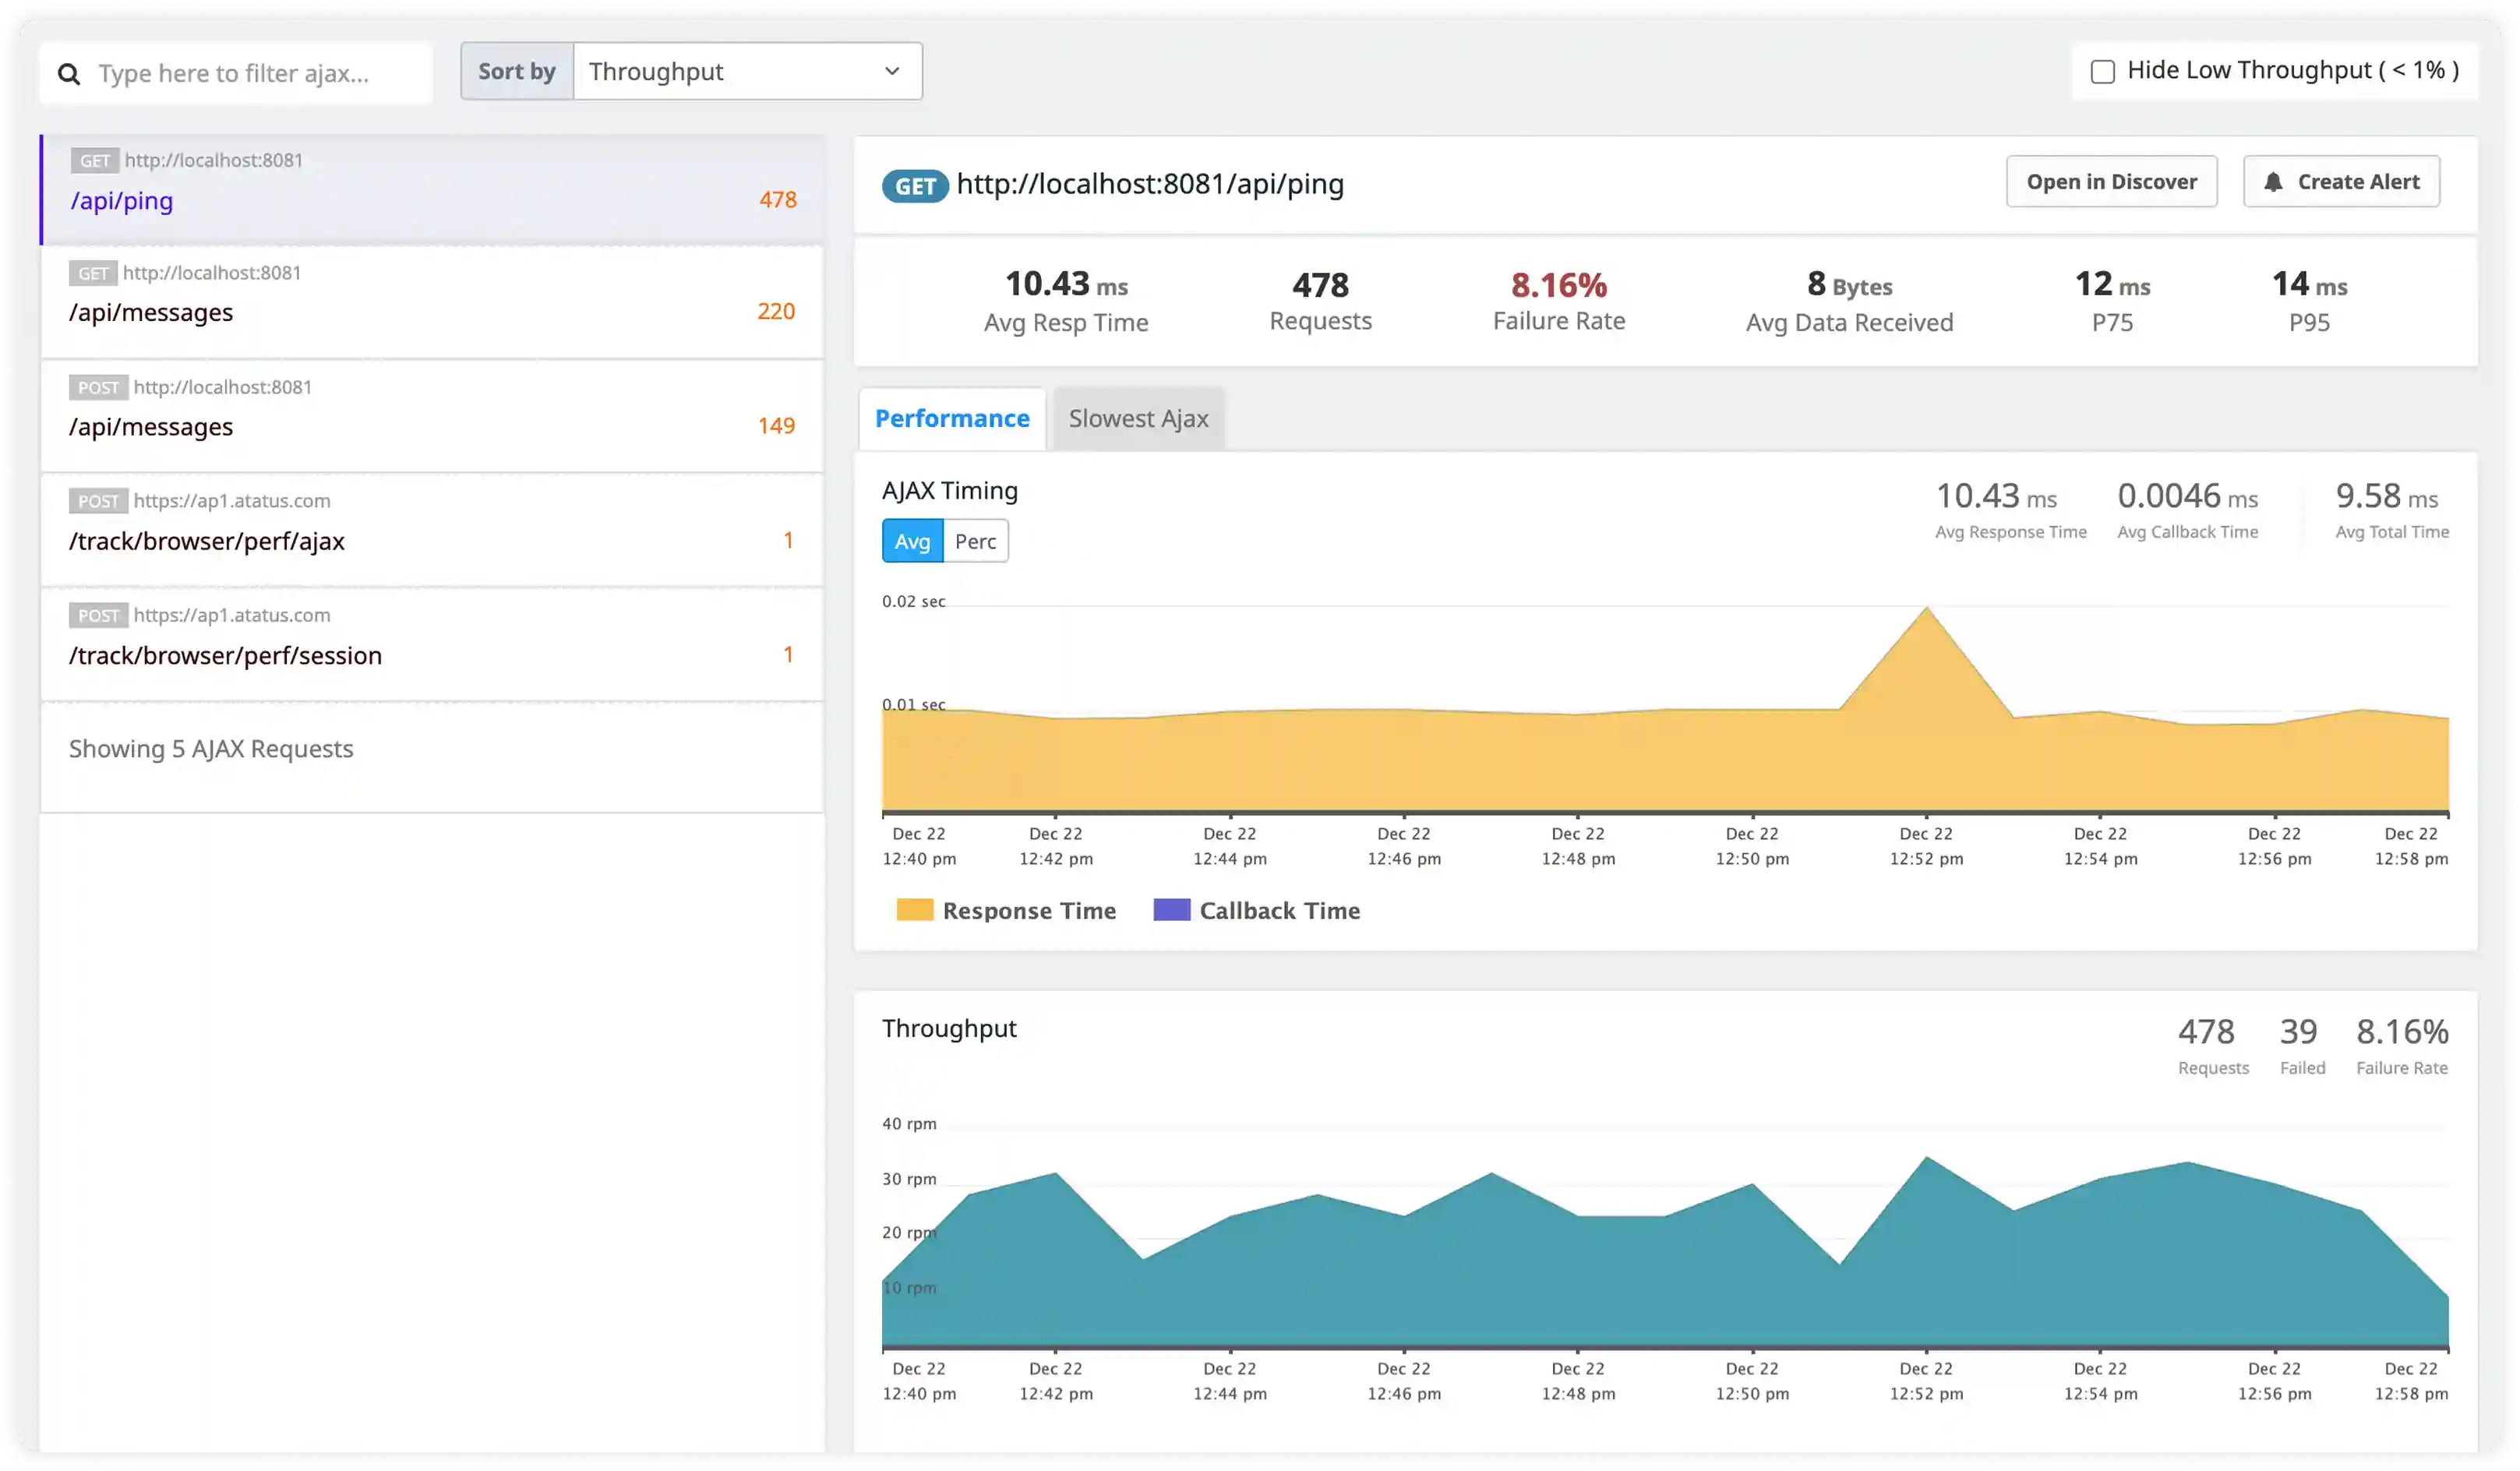
Get complete visibility into your Ember errors and performance issues that are impacting your end user experience. Fix critical issues sooner with in depth data points that helps you in analyzing and resolving issues with great speed.
Master Ember Glimmer rendering and routable component performance in enterprise SPAs
Full Ember route transition profiling
Track Ember router transitions, model hooks, and controller lifecycle timing to identify slow Ember.js single page application navigation.
Glimmer component render waterfalls
Monitor template compilation, Glimmer VM execution, and tracked property updates during real user interactions.
Ember Data request pipelines
Measure adapter serialization, model normalization, and relationship loading across production Ember Data workloads.
Ember runtime exception capture
Catch Glimmer assertion failures, route hook errors, and modifier exceptions with full template/component stack traces.
Routable component responsiveness
Detect delayed outlet rendering, loading substates, and error substates affecting Ember user experience.
Ember Inspector correlation
Link user sessions to Ember Inspector data—route hierarchy, component trees, and service injections.
Octane tracking performance
Analyze @tracked properties, actions, and modifiers under Ember Octane conventions across browsers.
Ember addon optimization
Validate ember-cli addon performance, broccoli pipeline efficiency, and fastboot SSR timing in production.
Rendering and Run Loop Execution
- Measure component render frequency during real user interactions and correlate execution cost with actual DOM update latency to understand rendering performance.
- Analyze Ember run loop scheduling phases and execution timing in detail to identify bottlenecks contributing to delayed rendering.
- Identify repeated re-renders triggered by tracked state changes that do not produce meaningful UI updates, creating unnecessary processing overhead.
- Detect propagation of updates across deep component hierarchies that causes redundant rendering cycles and UI instability.

Data Binding and State Update Execution
- Measure latency between tracked property changes and the resulting UI rendering updates across complex user workflows to understand state-to-UI propagation speed.
- Identify observers and computed properties that continue triggering repeated updates even after application state has stabilized, creating unnecessary processing overhead.
- Analyze state propagation across routes, controllers, services, and components in detail to surface inefficient update chains and cascading re-render patterns.
- Detect redundant data updates, circular bindings, and over-synchronization that negatively affect rendering performance and interaction responsiveness.

Asynchronous and Task Execution
- Track asynchronous execution from API requests, Ember Concurrency tasks, background sync operations, and scheduled workflows.
- Measure the delay between async task completion and subsequent UI update execution to detect slow response paths.
- Identify concurrent tasks that compete for main thread time, block rendering, and delay interaction readiness.
- Correlate async execution timing with navigation latency, perceived performance, and visual stability.

Routing and Transition Execution
- Break down route transition timing across model hooks, setup phases, data fetching, and final component rendering.
- Identify blocking operations during route initialization such as heavy computations or synchronous logic that delay UI updates.
- Measure lazy loading behavior and data fetch latency across different devices, browsers, and network conditions.
- Correlate navigation execution timing with workflow interruption, slow transitions, and interaction delays.

Why Choose Atatus for Ember RUM?
Optimize Ember.js Glimmer performance, route transitions, and Octane patterns without addon complexity
Built for Ember Glimmer engine
Native Glimmer VM tracing, tracked property monitoring, and template render optimization insights.
Ember Octane diagnostics
Route transition waterfalls, Ember Data normalization traces, and Glimmer assertion analysis.
Zero-config ember-cli integration
Automatic instrumentation for ember-cli apps, FastBoot SSR, and ember-data adapters—no build pipeline changes.
Ember-specific Core Web Vitals
LCP/INP/CLS metrics attributed to route model resolution, Glimmer renders, and outlet transitions.
Enterprise Ember scaling
Battle-tested for large Ember.js applications with complex nested routes and ember-data relationships.
Ember growth pricing
Predictable costs scale with Ember user sessions—no ember-addon development or migration overhead.
Unified Observability for Every Engineering Team
Atatus adapts to how engineering teams work across development, operations, and reliability.
Developers
Trace requests, debug errors, and identify performance issues at the code level with clear context.
DevOps
Track deployments, monitor infrastructure impact, and understand how releases affect application stability.
Release Engineer
Measure service health, latency, and error rates to maintain reliability and reduce production risk.