JavaScript Error and Performance Monitoring
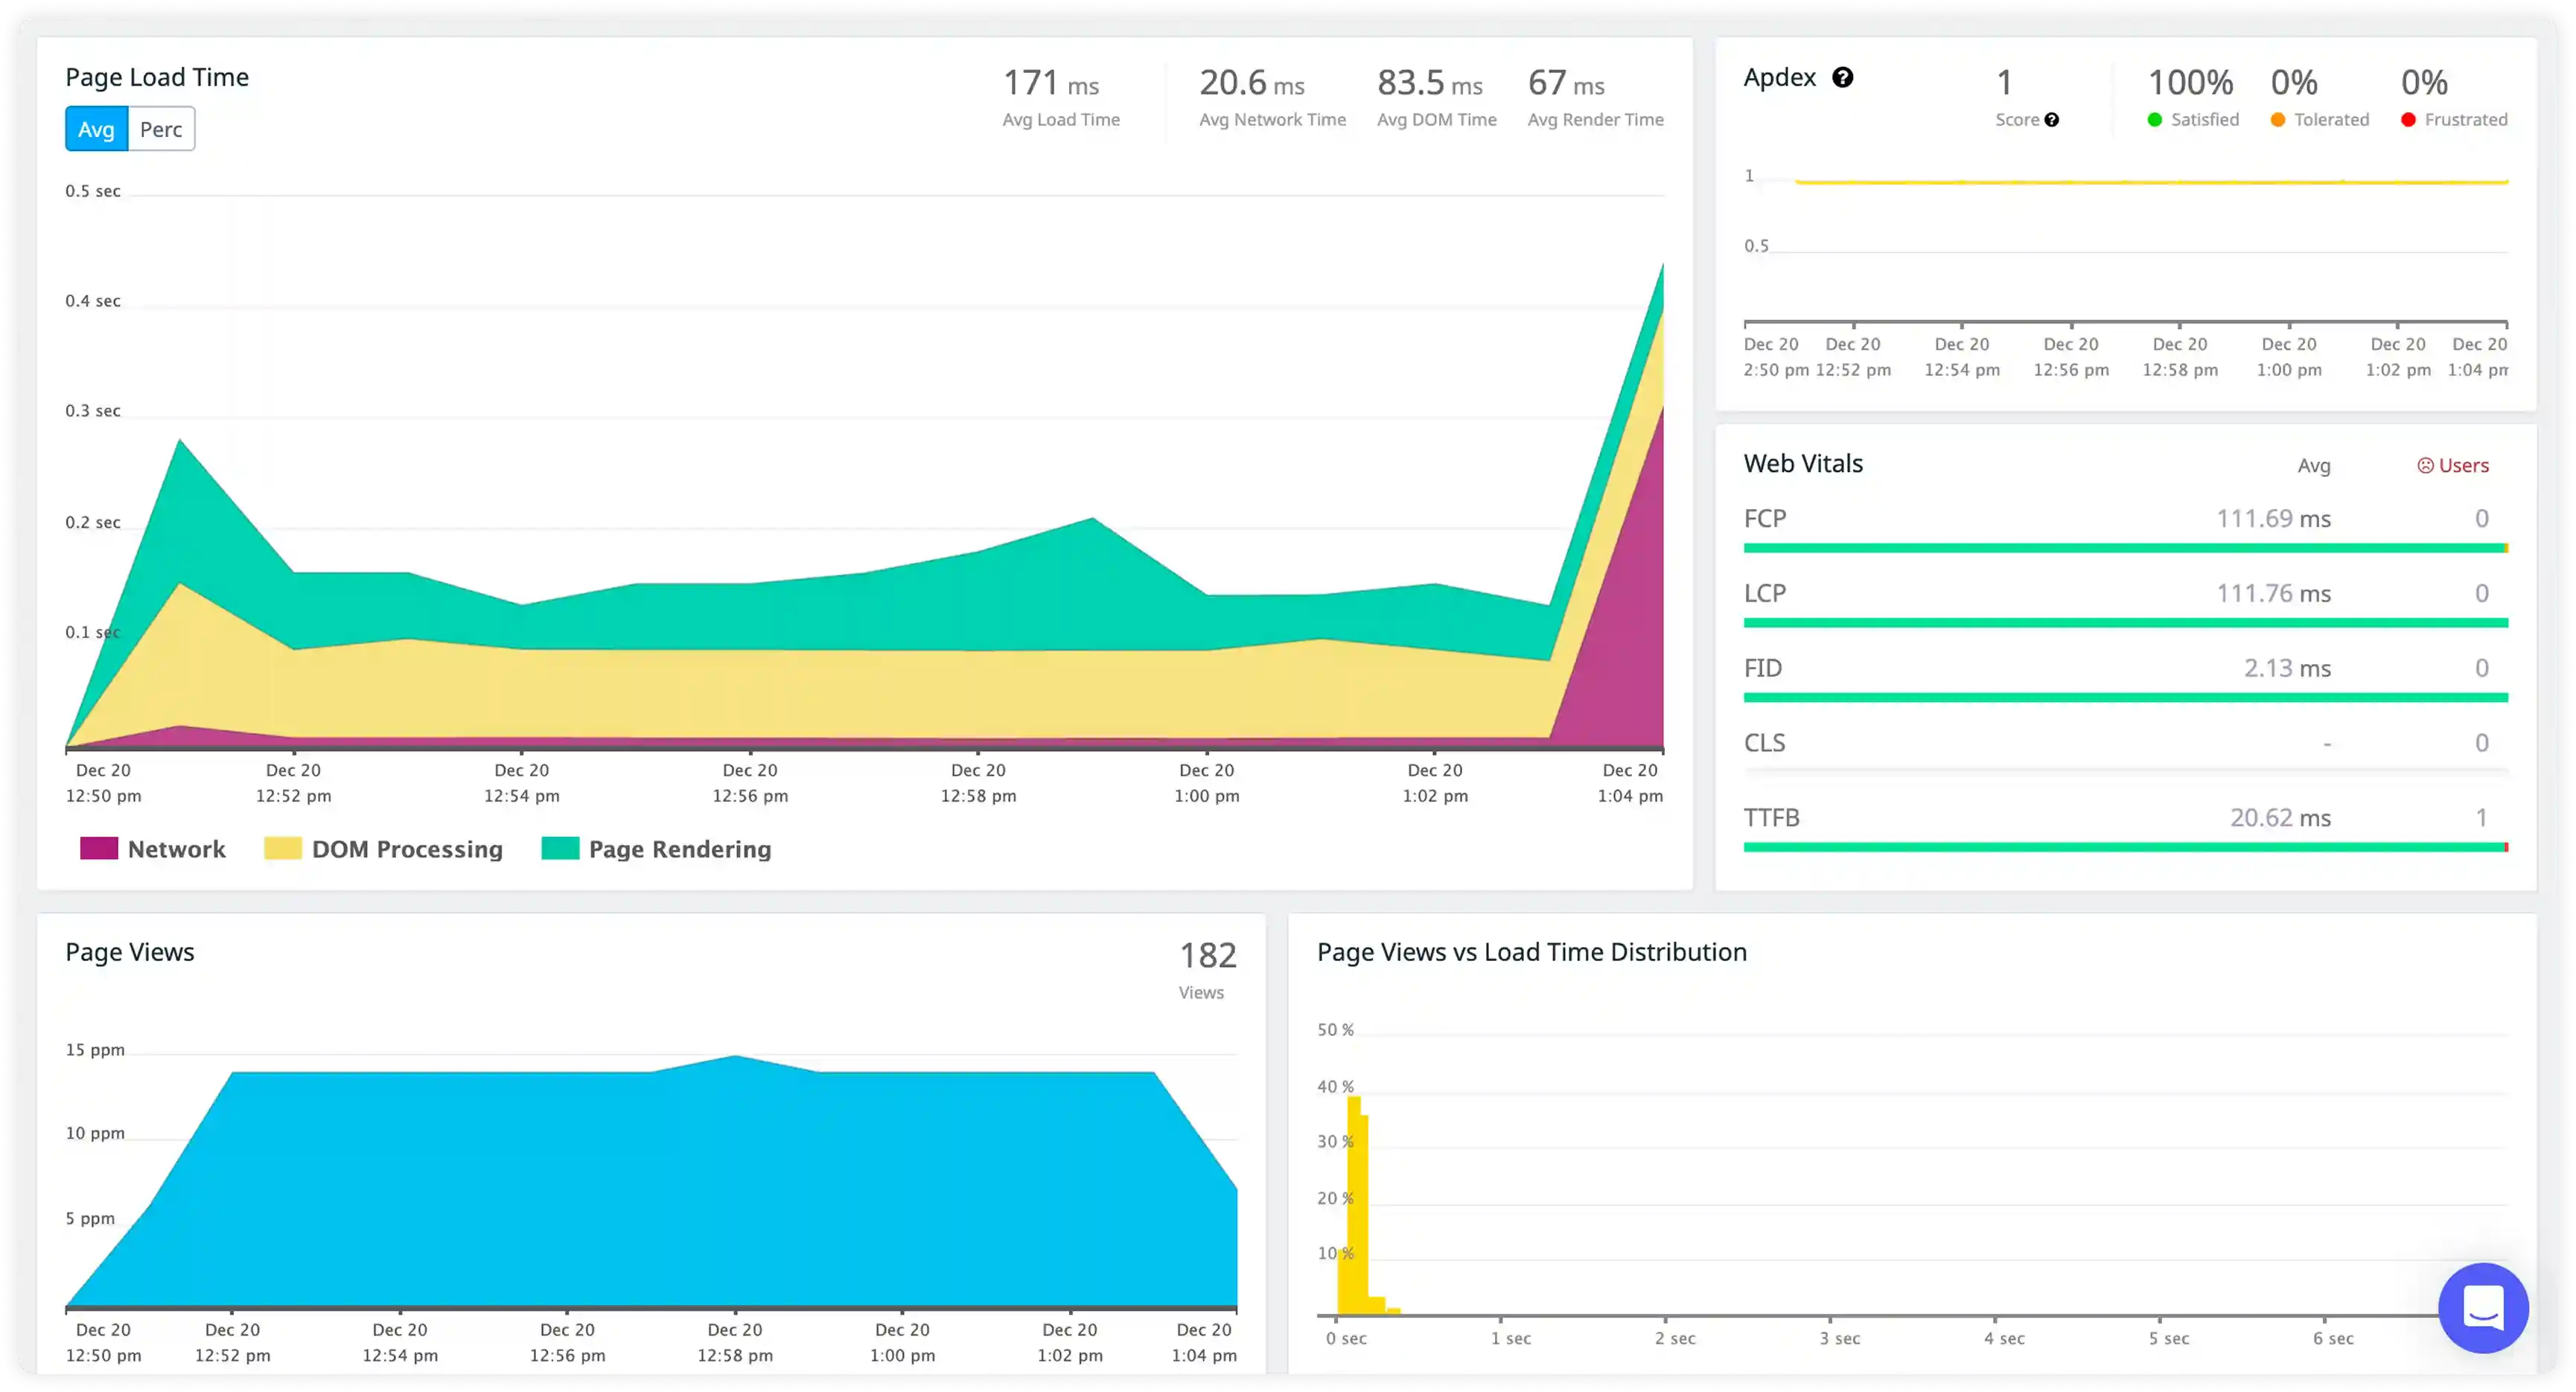
Get complete visibility into your JavaScript errors and performance issues that are impacting your end user experience. Fix critical issues sooner with in depth data points that helps you in analyzing and resolving issues with great speed.
Achieve comprehensive visibility into JavaScript execution and browser rendering pipelines
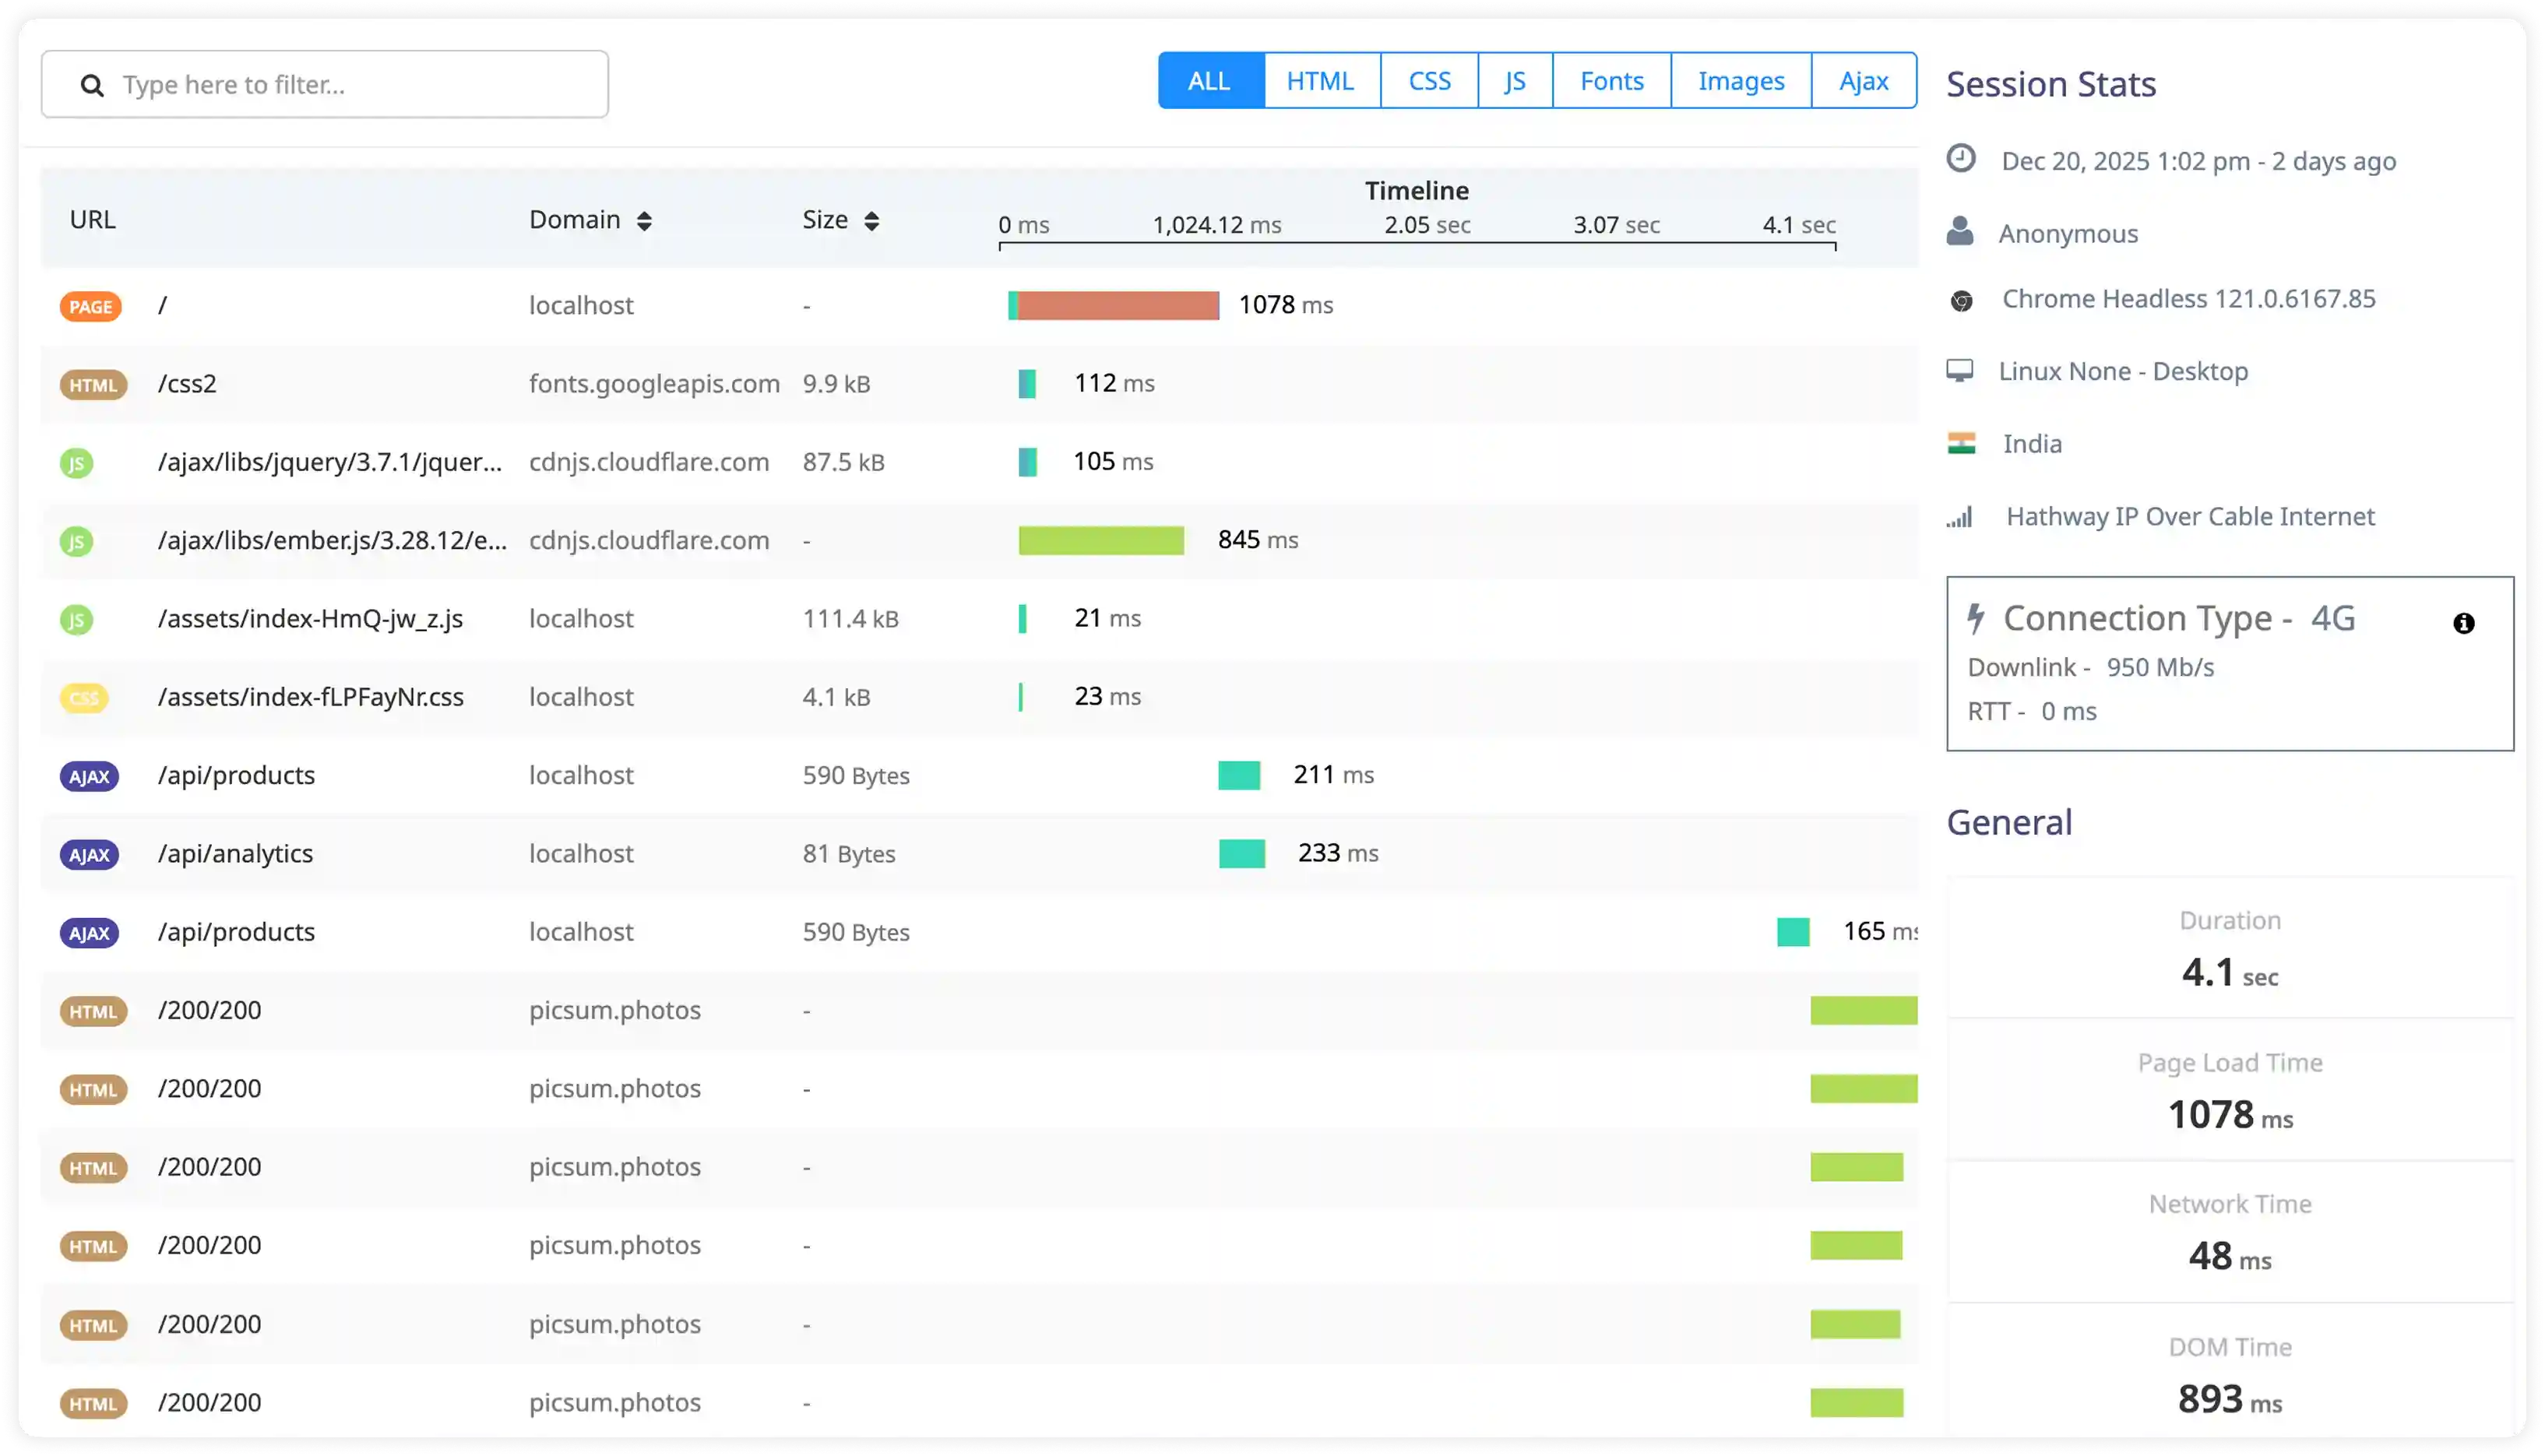
JavaScript execution waterfalls
Track script parsing, compilation, and execution timing across main thread bottlenecks in real user JavaScript application sessions.
Dynamic import & module loading
Monitor ES6 module imports, dynamic import() waterfalls, and code splitting performance in modern JavaScript single page applications.
Event loop blocking analysis
Measure long tasks, task queue delays, and microtask execution timing affecting JavaScript application responsiveness.
JavaScript runtime error capture
Capture unhandled promise rejections, async generator failures, and syntax errors with complete call stack traces.
Synthetic event performance
Profile addEventListener delays, event delegation overhead, and passive event listener effectiveness in web applications.
Main thread to user correlation
Connect JavaScript long tasks directly to input delays, layout thrashing, and Core Web Vitals impact.
Memory leak detection
Track closure leaks, detached DOM nodes, and growing WeakMap instances across JavaScript application lifecycles.
JavaScript bundle optimization
Validate tree shaking effectiveness, dead code elimination, and bundle duplication patterns in production deployments.
Execution and Event Loop Processing
- Measure script execution frequency during real user interactions and correlate execution cost with actual UI update latency to understand performance impact.
- Analyze event loop behavior across the call stack, microtasks, macrotasks, and scheduling phases to surface execution bottlenecks.
- Identify long-running scripts and heavy synchronous tasks that block rendering and delay interaction readiness.
- Detect repeated execution cycles triggered without meaningful state changes that create unnecessary CPU overhead.

DOM Manipulation and Rendering Execution
- Measure latency between DOM updates and final visual rendering across complex user interactions to clearly understand render pipeline performance.
- Identify excessive DOM reads, writes, and style recalculations that trigger layout thrashing, forced reflows, and UI instability.
- Analyze reflow and repaint timing during dynamic UI updates, animations, and responsive layout changes to pinpoint expensive rendering steps.
- Correlate DOM execution timing with interaction responsiveness, dropped frames, scrolling smoothness, and visual stability issues.

Asynchronous Execution and Network Handling
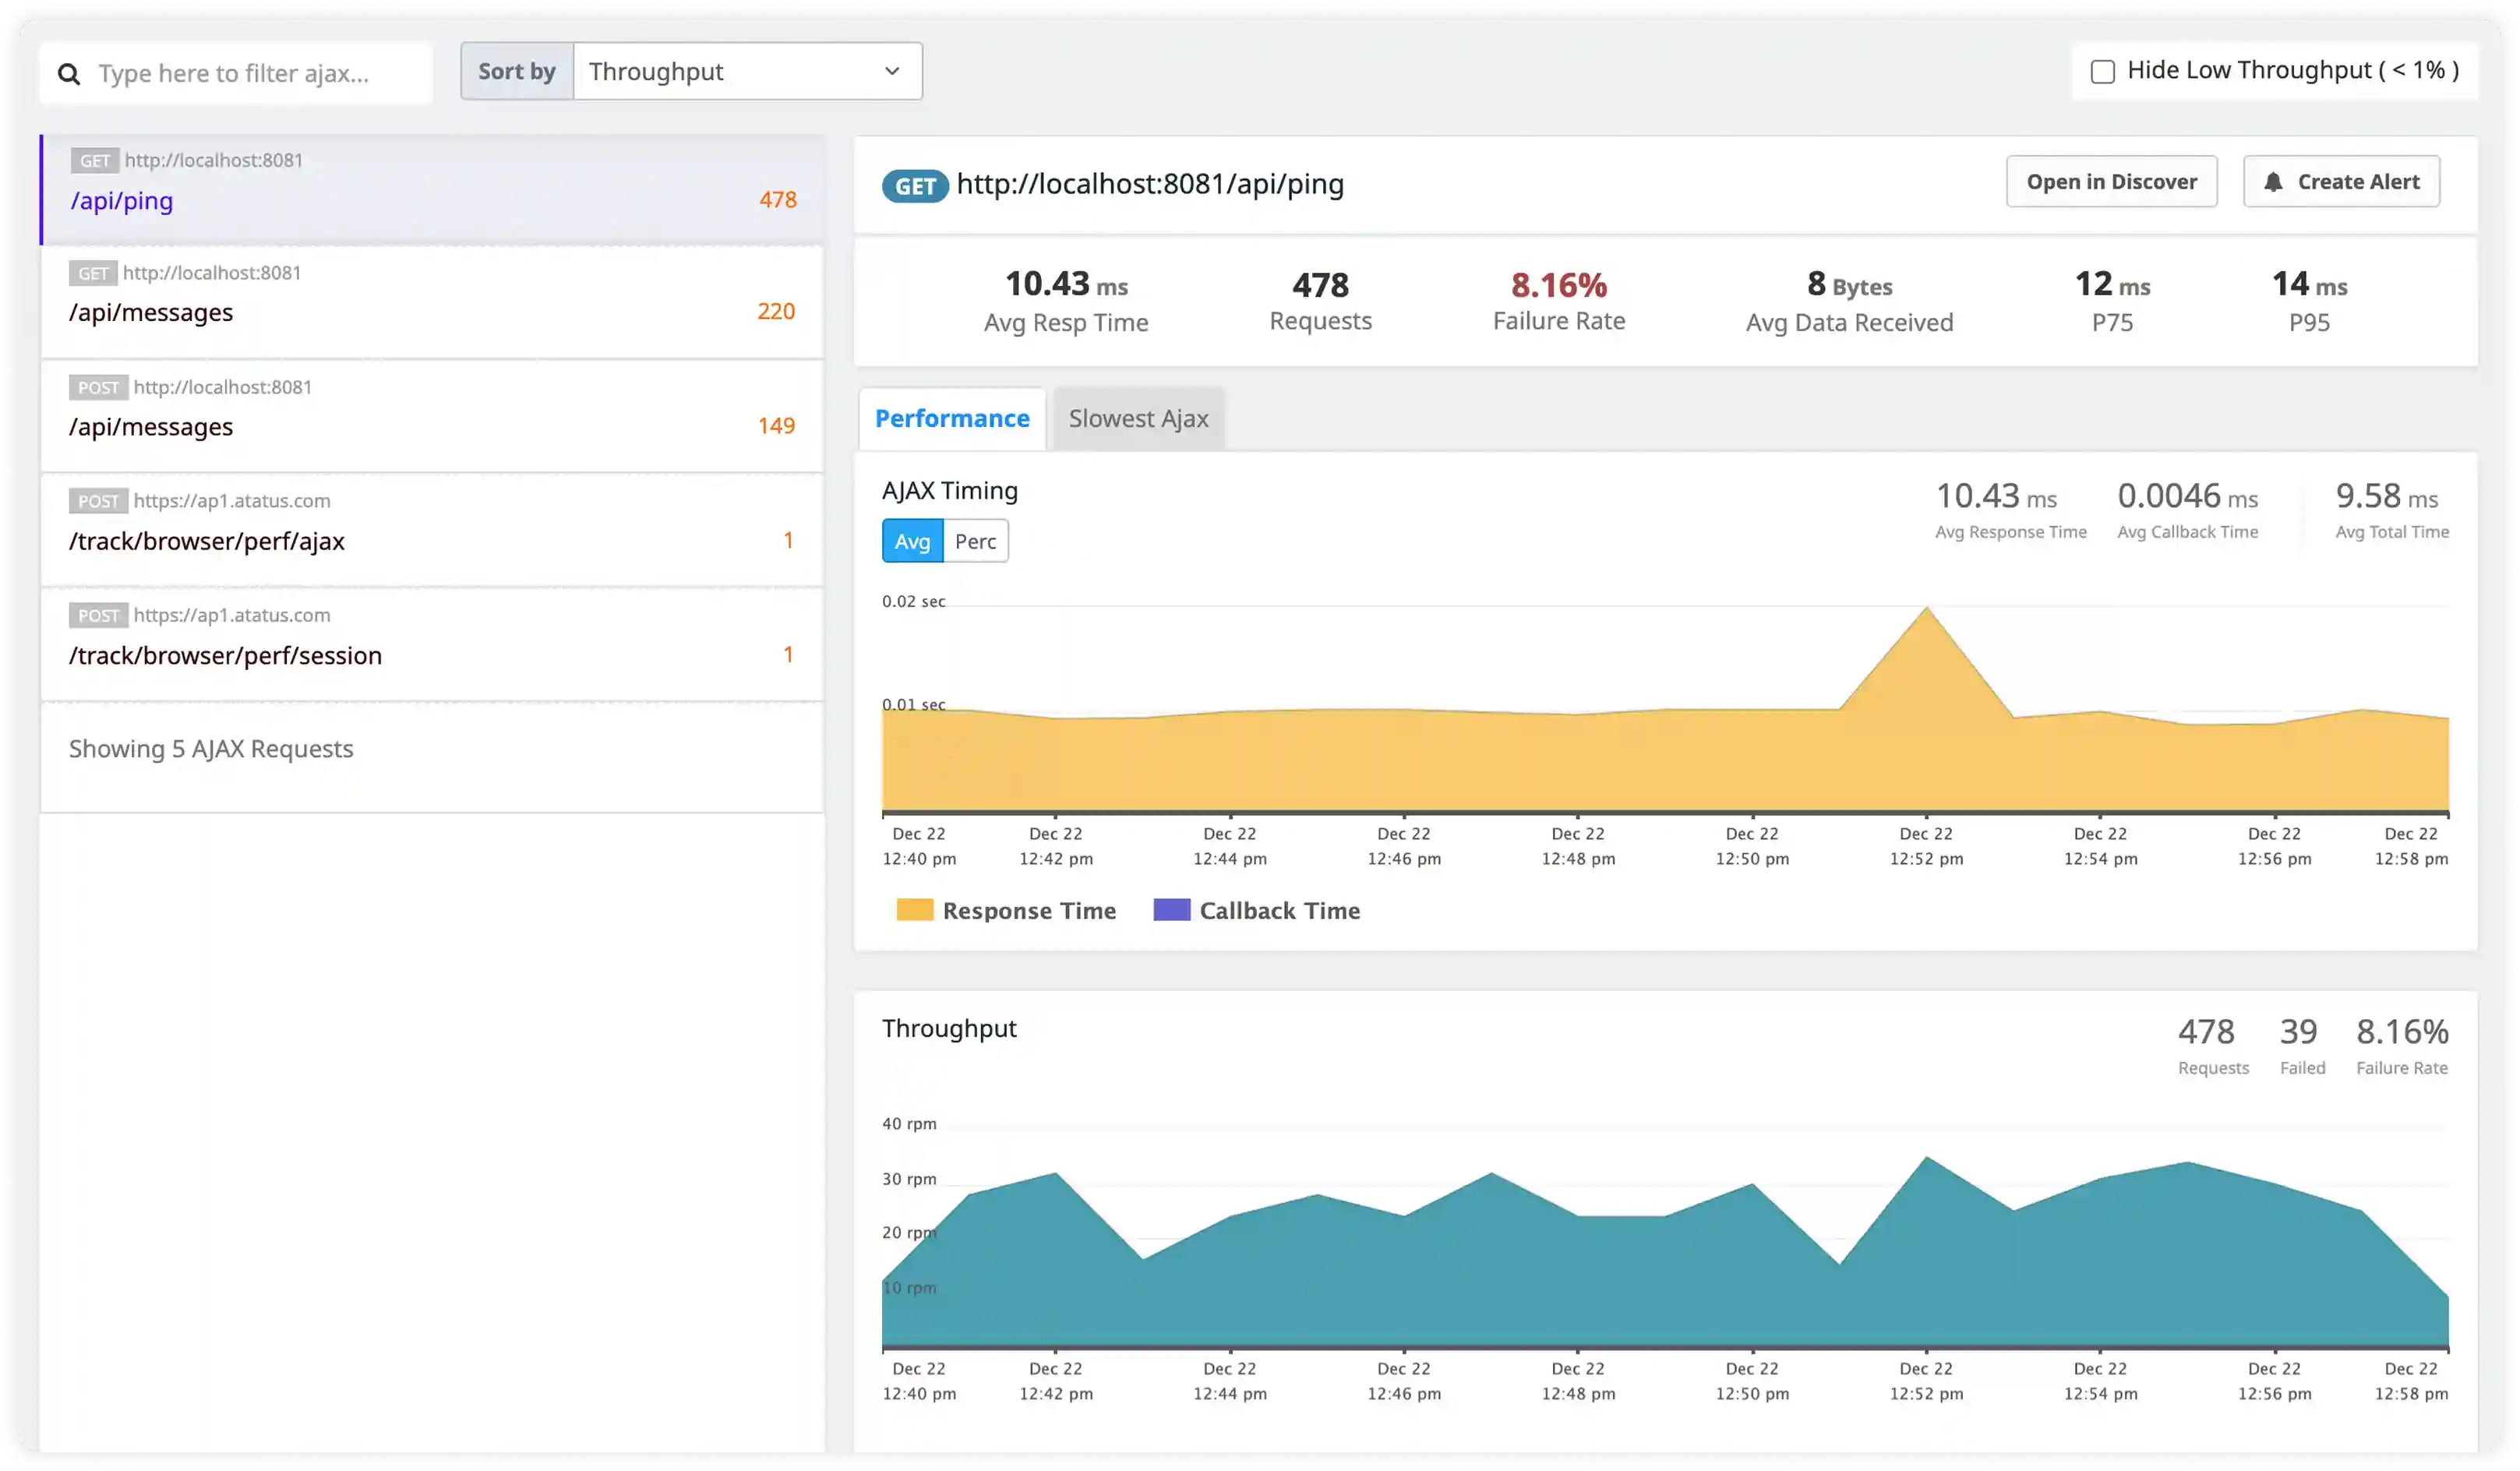
- Track asynchronous operations from API requests, promises, timers, web workers, and event-driven workflows.
- Measure the delay between async task completion and the resulting UI updates triggered by state changes.
- Identify concurrent async execution paths that compete for main thread resources and block rendering.
- Correlate async execution timing with navigation latency, workflow interruption, and perceived performance.

Memory and Resource Execution
- Measure memory allocation patterns and garbage collection timing during intensive script execution phases.
- Identify memory leaks caused by lingering event listeners, retained closures, detached DOM nodes, and unused objects.
- Analyze resource loading impact including scripts, images, and third-party assets on execution and rendering performance.
- Correlate resource execution timing with UI lag, responsiveness issues, and long task occurrences.

Why Choose Atatus for JavaScript RUM?
Master JavaScript main thread performance, event loop optimization, and modern module loading without framework dependencies.
Built for all JavaScript applications
Native monitoring of V8/SpiderMonkey/JSC engines, event loop scheduling, and DOM scripting performance across any JavaScript web app.
Universal JavaScript diagnostics
Execution waterfalls, long task traces, and memory timeline analysis across all JavaScript environments.
Zero-config script integration
Single script tag deployment monitors any JavaScript application—framework agnostic, build tool independent.
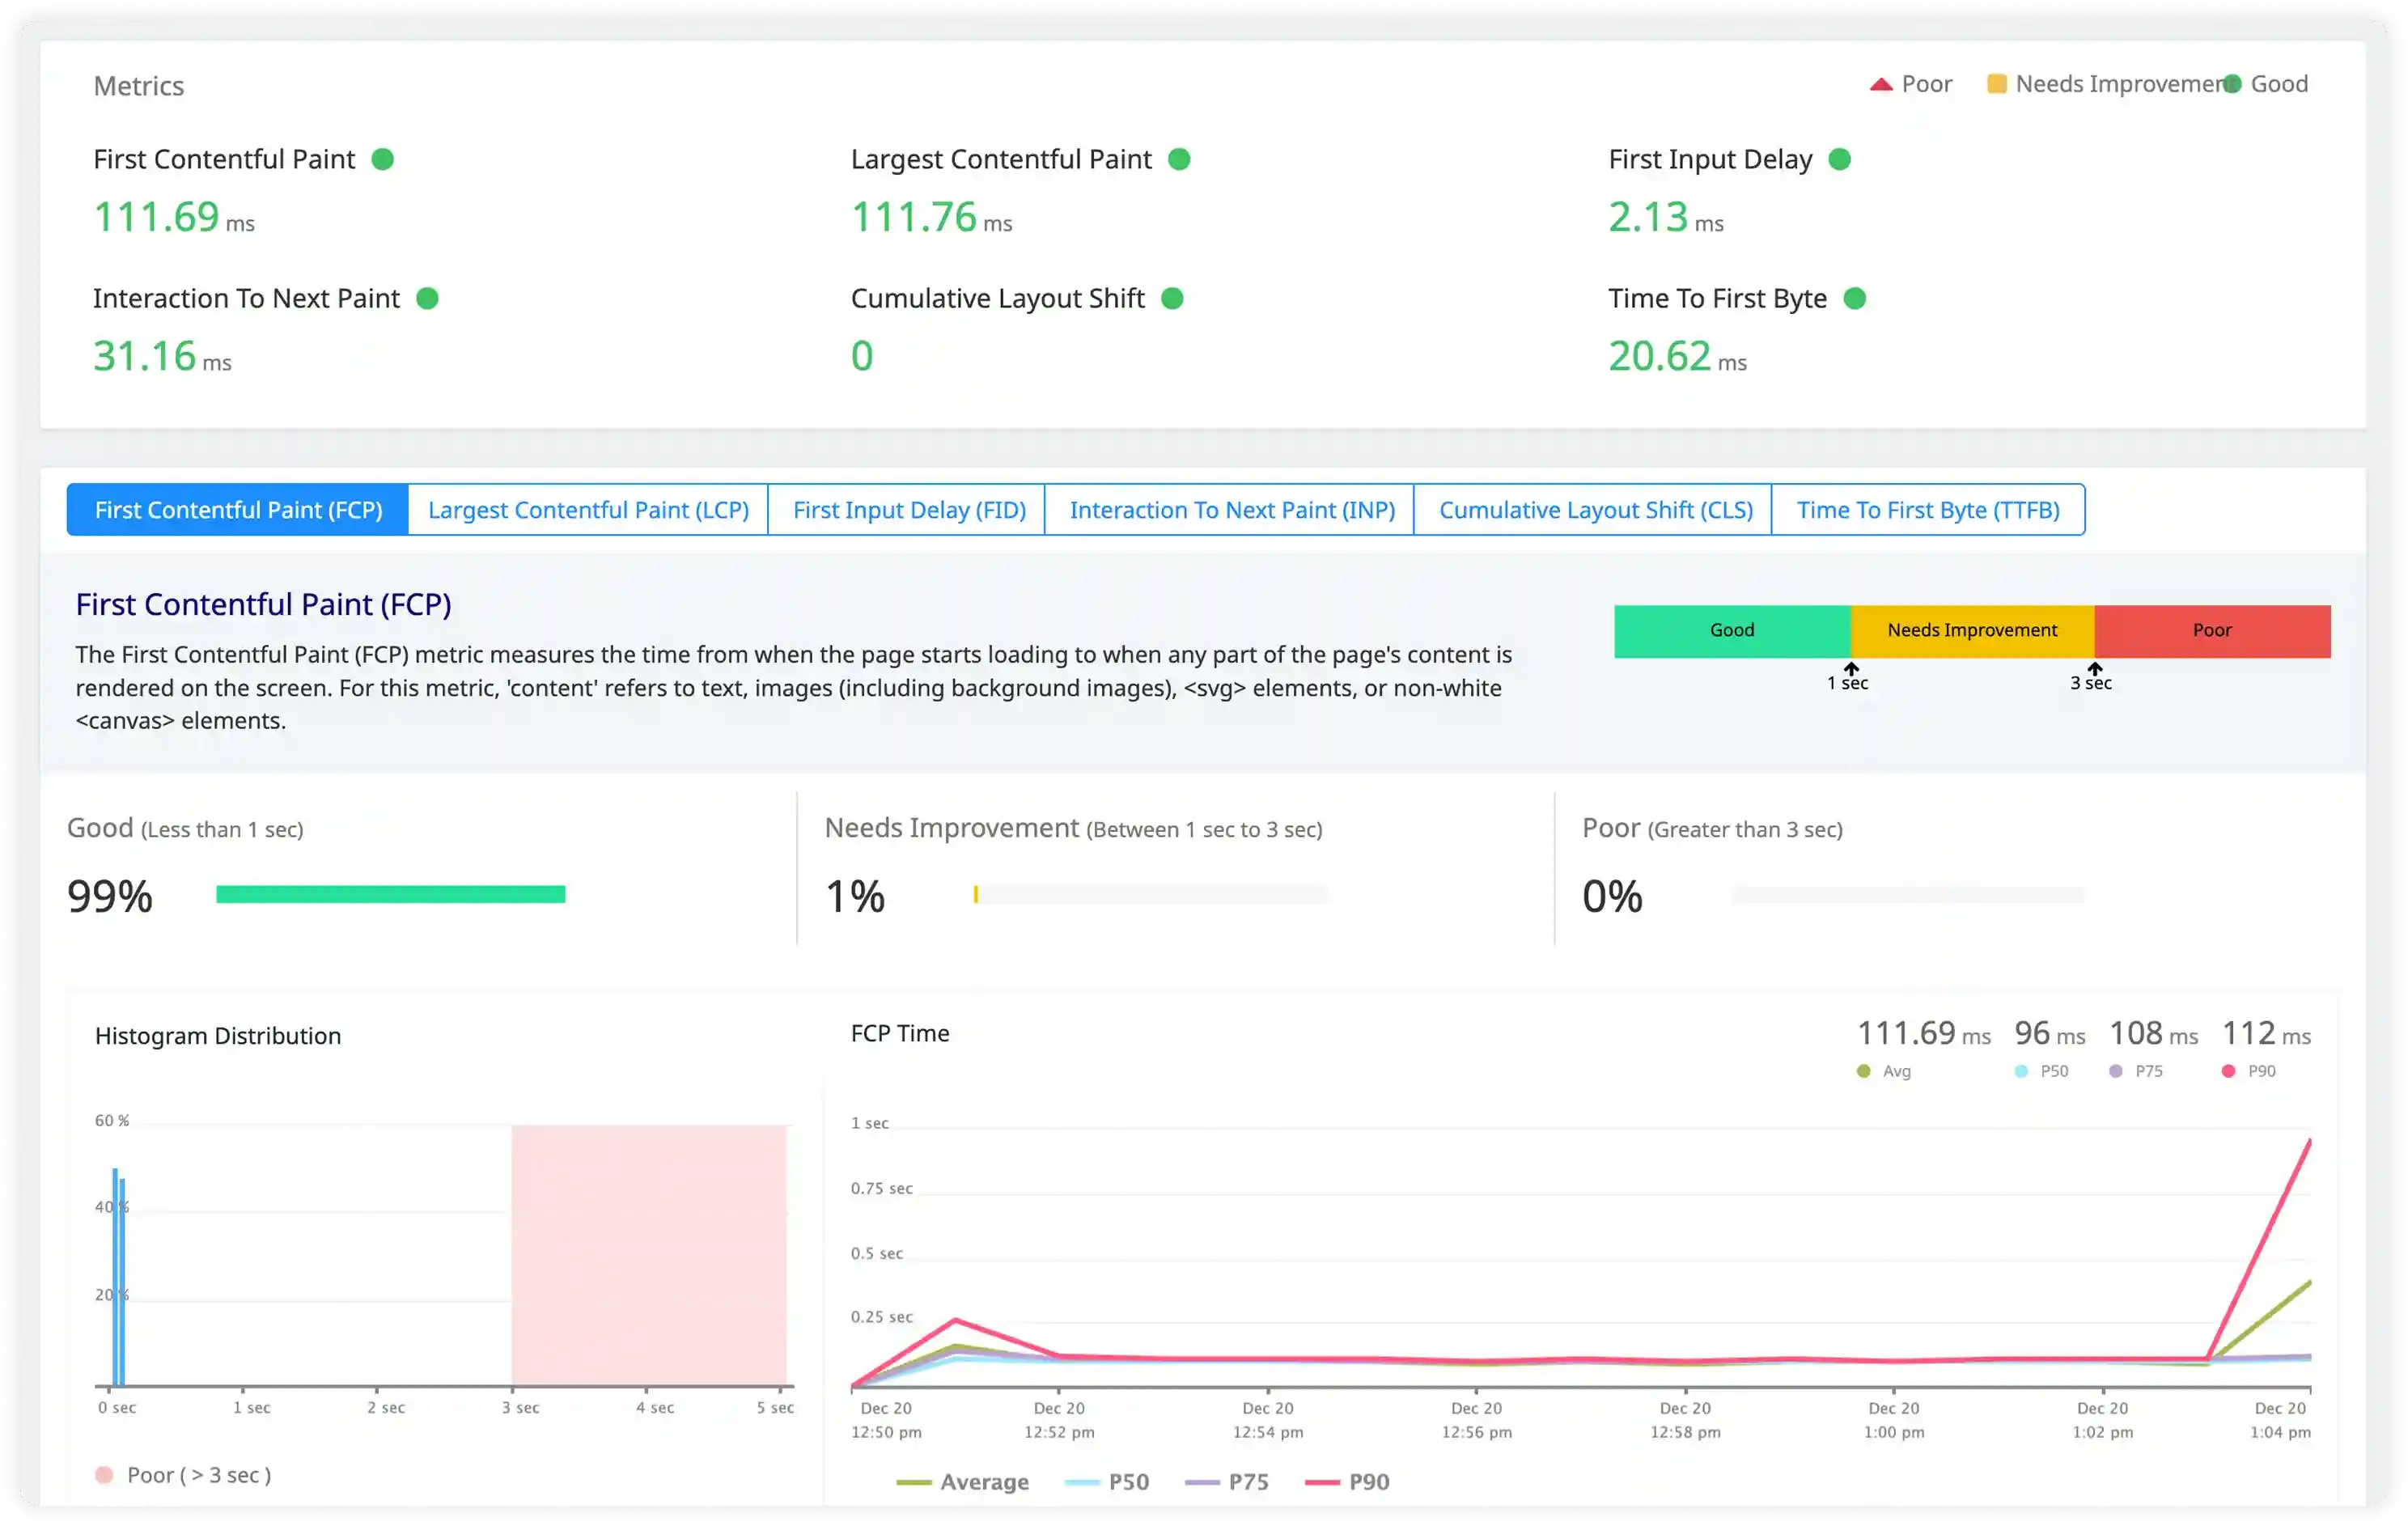
Pure JavaScript Core Web Vitals
LCP/CLS/INP metrics attributed to script execution, event handlers, and main thread blocking patterns.
Universal web app scaling
Enterprise-grade monitoring for custom JavaScript SPAs, micro-frontends, and legacy web applications.
JavaScript growth pricing
Scalable costs track JavaScript execution across user sessions—no framework licensing or migration costs.
Unified Observability for Every Engineering Team
Atatus adapts to how engineering teams work across development, operations, and reliability.
Developers
Trace requests, debug errors, and identify performance issues at the code level with clear context.
DevOps
Track deployments, monitor infrastructure impact, and understand how releases affect application stability.
Release Engineer
Measure service health, latency, and error rates to maintain reliability and reduce production risk.