React Error and Performance Monitoring
Get complete visibility into your React errors and performance issues that are impacting your end user experience. Fix critical issues sooner with in depth data points that helps you in analyzing and resolving issues with great speed.
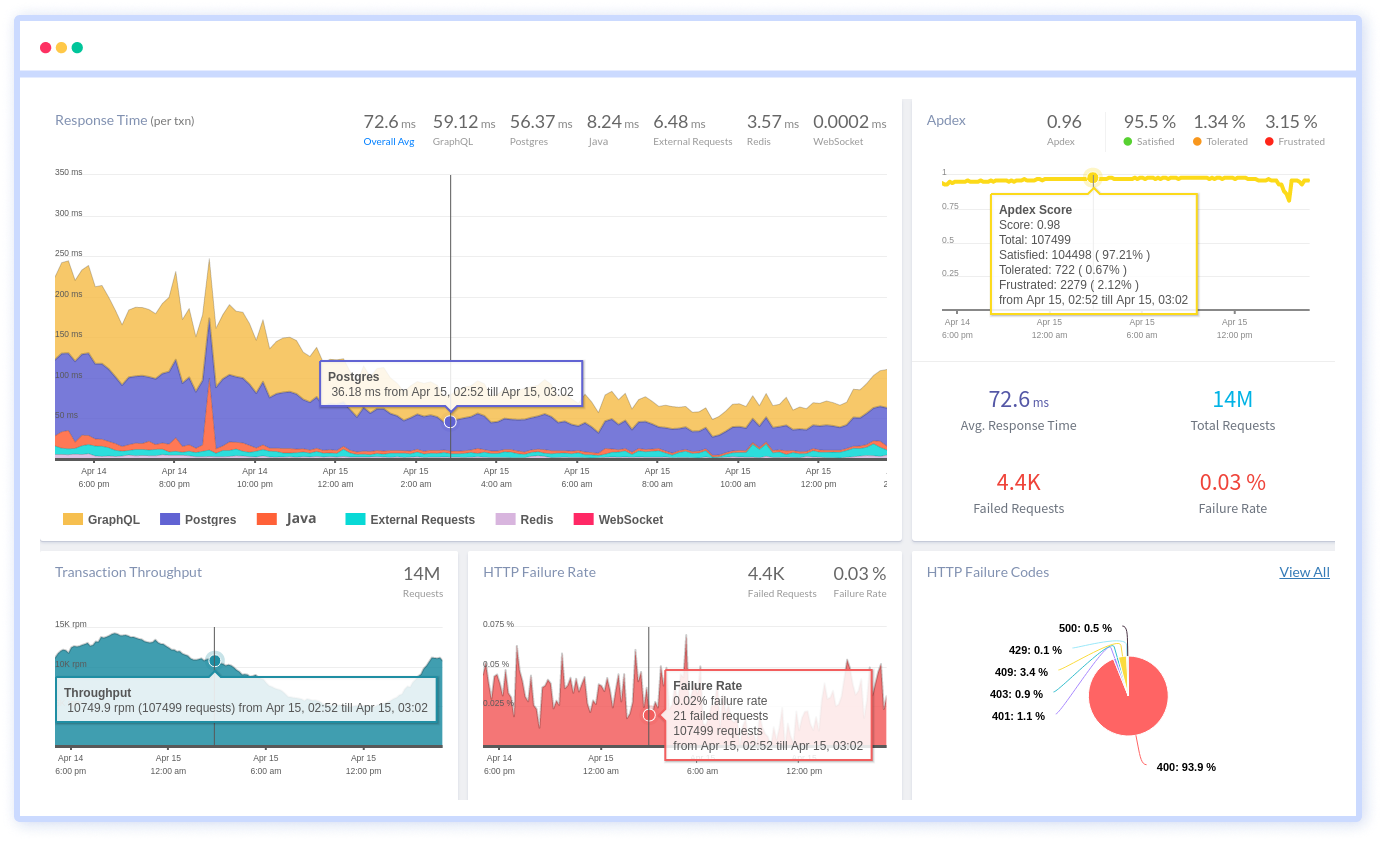
Unlock granular visibility into React component rendering and real user journeys in production
Complete React component render tracing
Capture every component render cycle, hook execution, and state update to pinpoint wasteful re-renders and performance bottlenecks in live traffic.
React Router & navigation waterfalls
Track React Router transitions, Suspense boundaries, and lazy loading waterfalls to identify slow route changes and hydration delays.
Hook execution performance
Monitor useEffect, useState, useMemo, and custom hook execution times across real sessions to optimize dependency arrays and prevent stale closures.
React error boundary captures
Catch errors thrown in component trees, Suspense fallbacks, and concurrent rendering failures with full component stack traces and fiber node context.
Interaction to fiber reconciliation
Trace user clicks, form submissions, and keyboard events through React's synthetic event system to ReactDOM reconciliation delays.
Render-to-commit correlation
Link slow user interactions directly to specific component trees, concurrent features, and server-side rendering hydration mismatches.
React 18+ concurrent insights
Measure time-to-interactive under concurrent rendering, transitions, and useDeferredValue patterns across browser rendering engines.
Bundle & tree-shaking validation
Validate code splitting effectiveness and detect unused code paths through real user navigation patterns and bundle analysis.
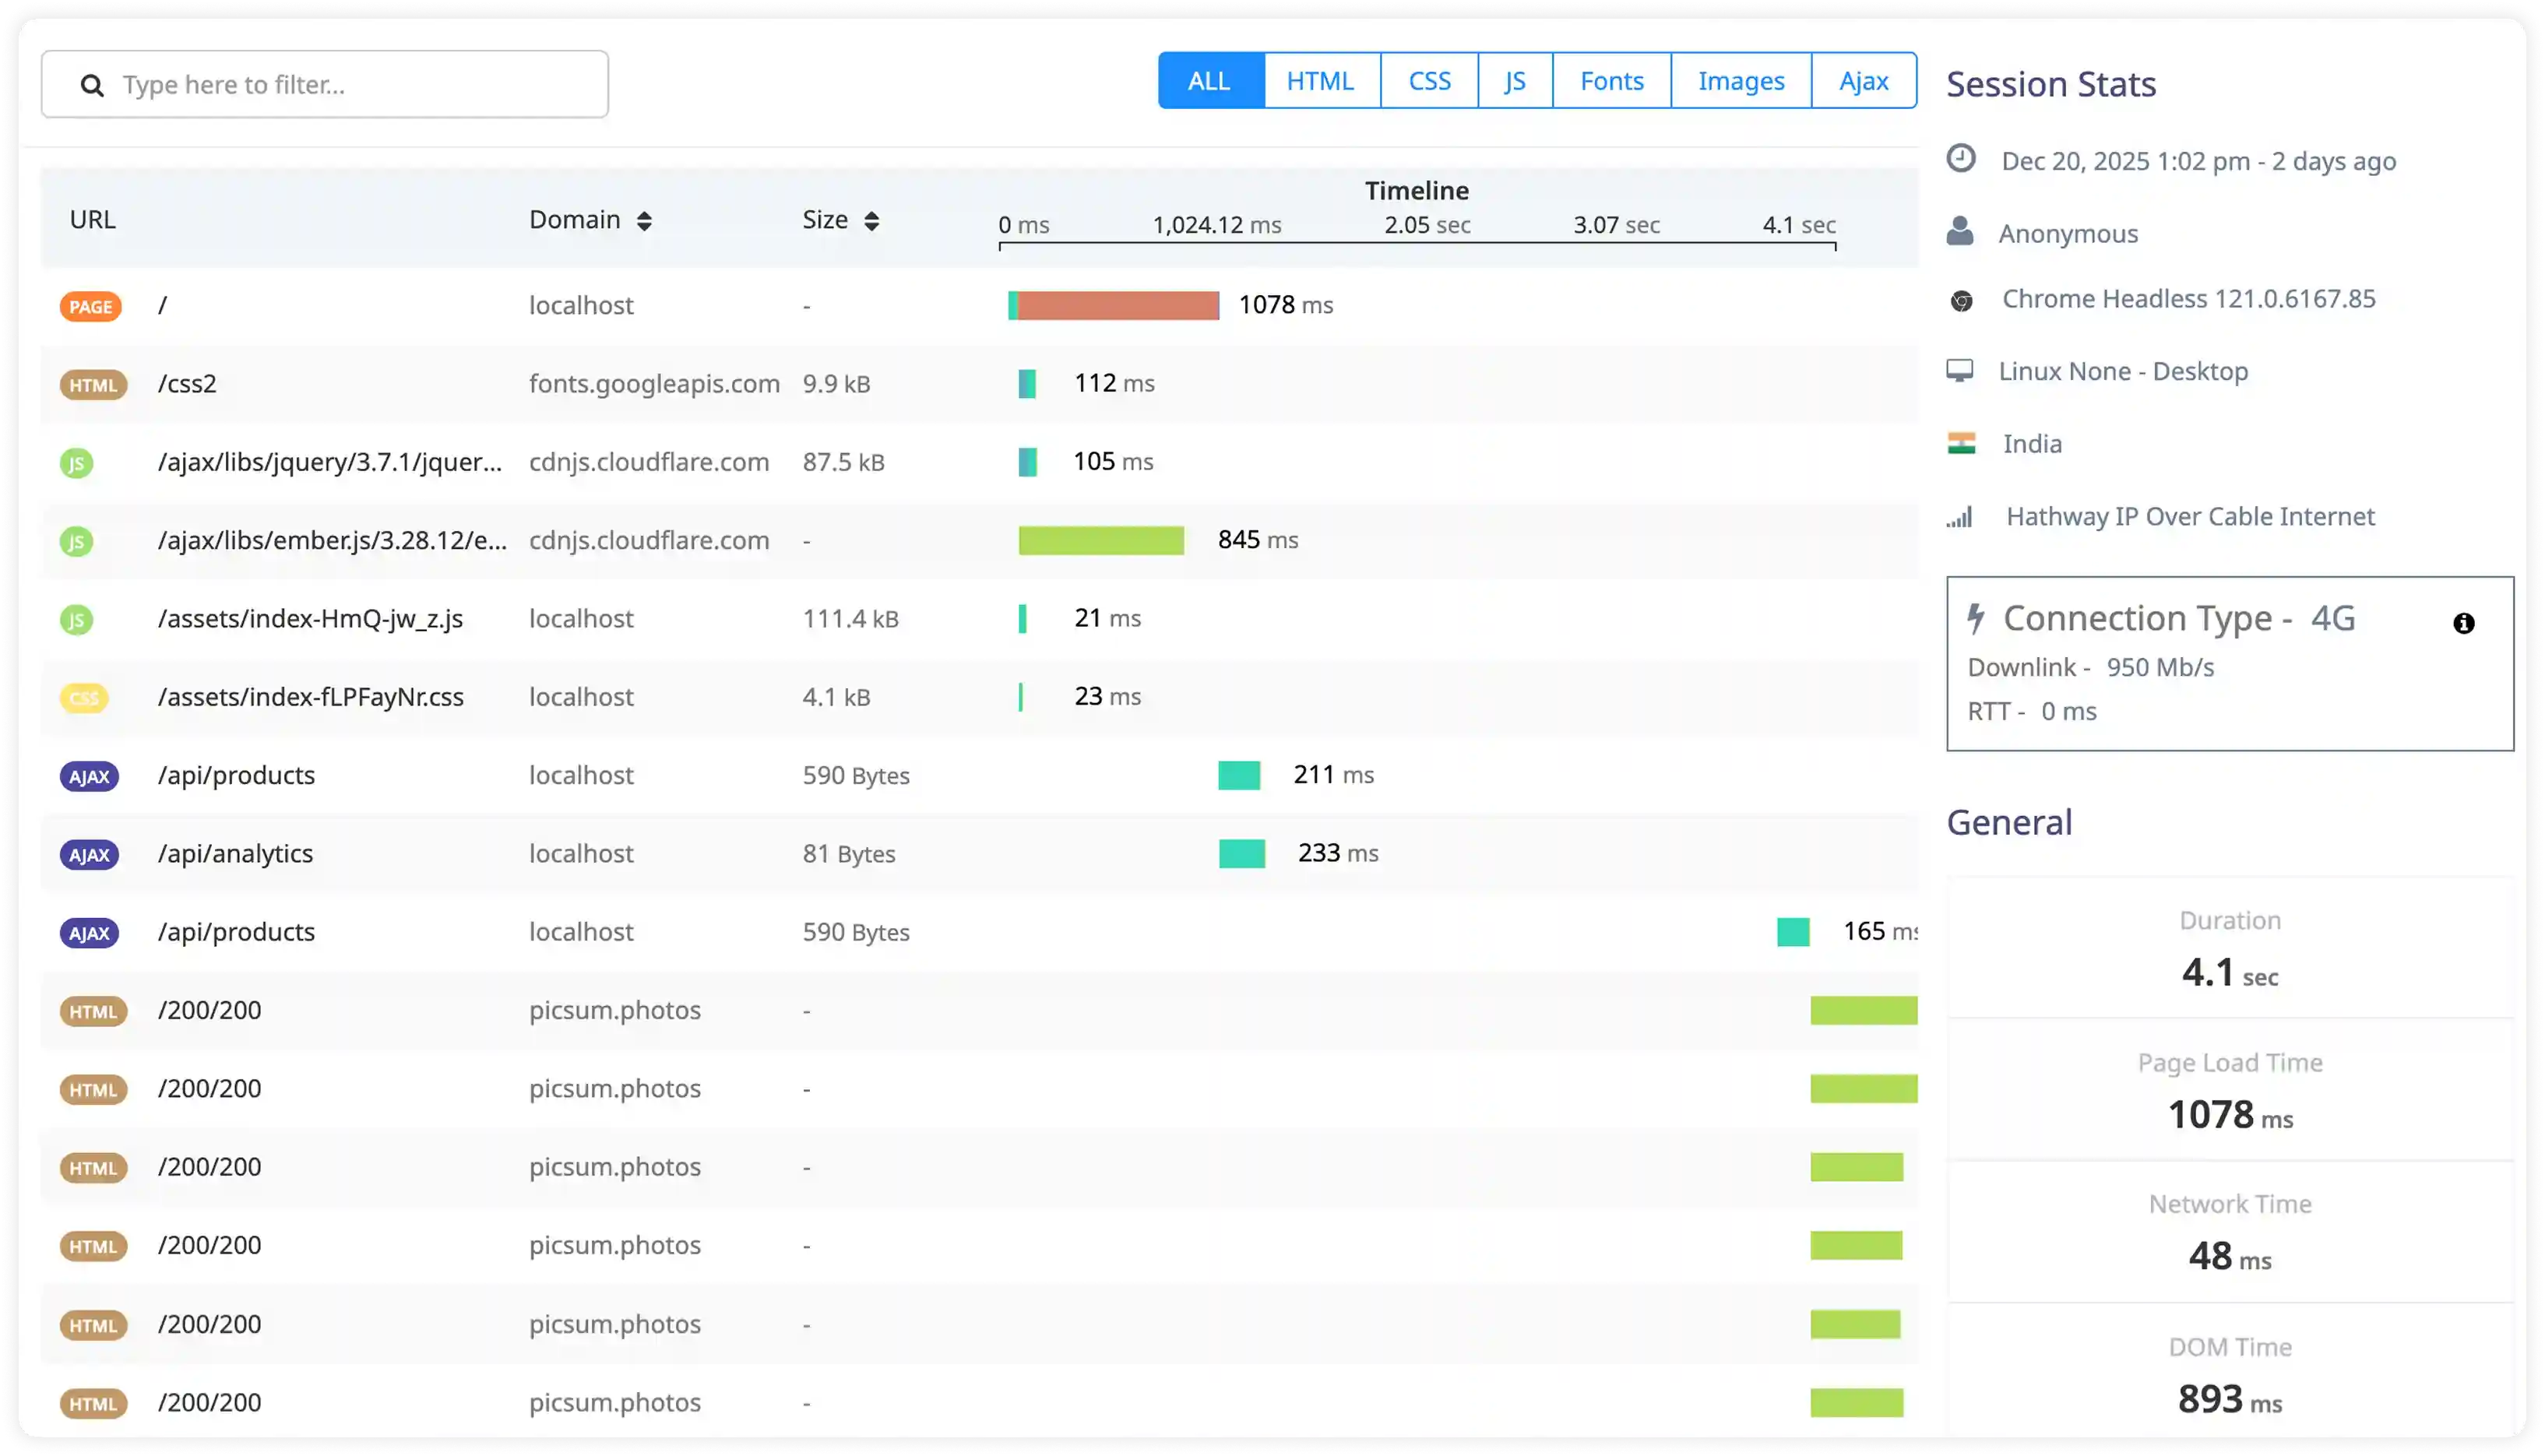
Component Rendering and Reconciliation
- Measure component render frequency during real user interactions and correlate execution cost with actual DOM commit latency to understand rendering impact.
- Identify unnecessary re-renders caused by prop changes, state updates, memoization gaps, or parent component re-execution.
- Analyze React reconciliation timing in detail to isolate the exact contributors to rendering delays and slow updates.
- Detect render propagation across deep component trees that causes redundant updates, layout shifts, and UI instability.
State and Hook Execution
- Measure execution timing of useState, useReducer, context updates, and derived state during real user workflows.
- Identify repeated or cascading state updates that trigger unnecessary renders even after state has stabilized.
- Analyze useEffect, layout effects, and custom hook execution during mount and update phases to surface expensive logic.
- Detect dependency array misconfigurations or missing dependencies that cause repeated side-effect execution.
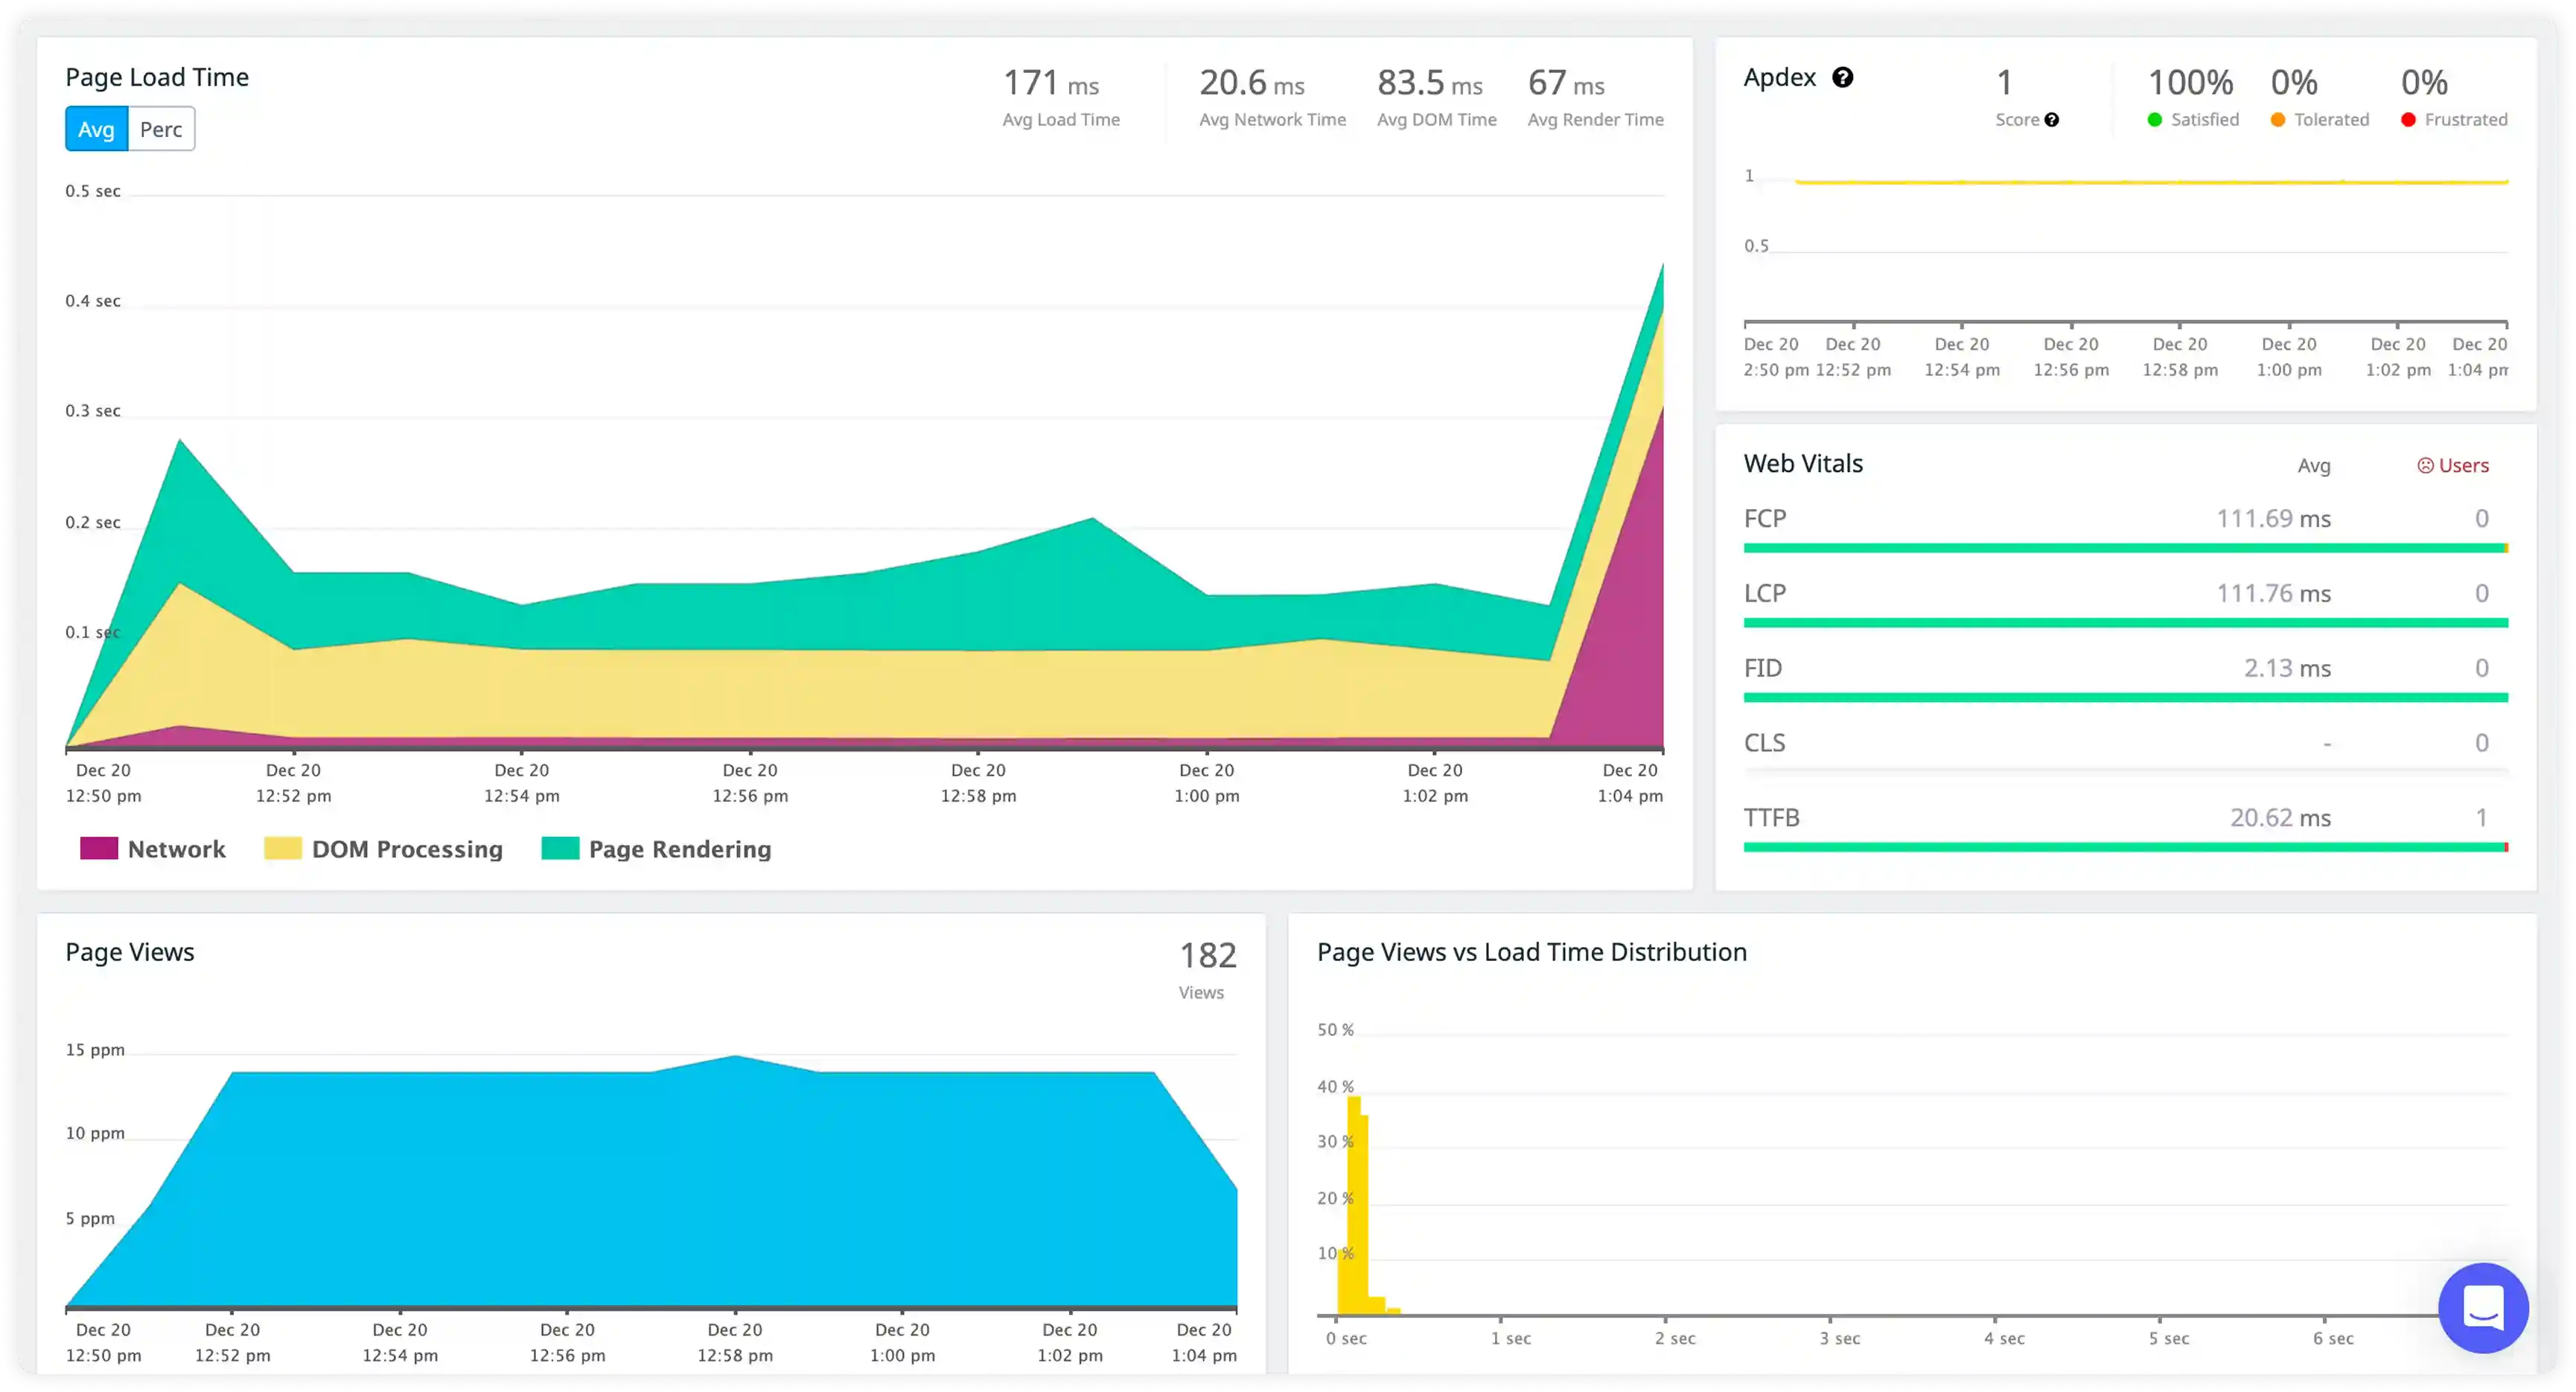
Asynchronous and Event Execution
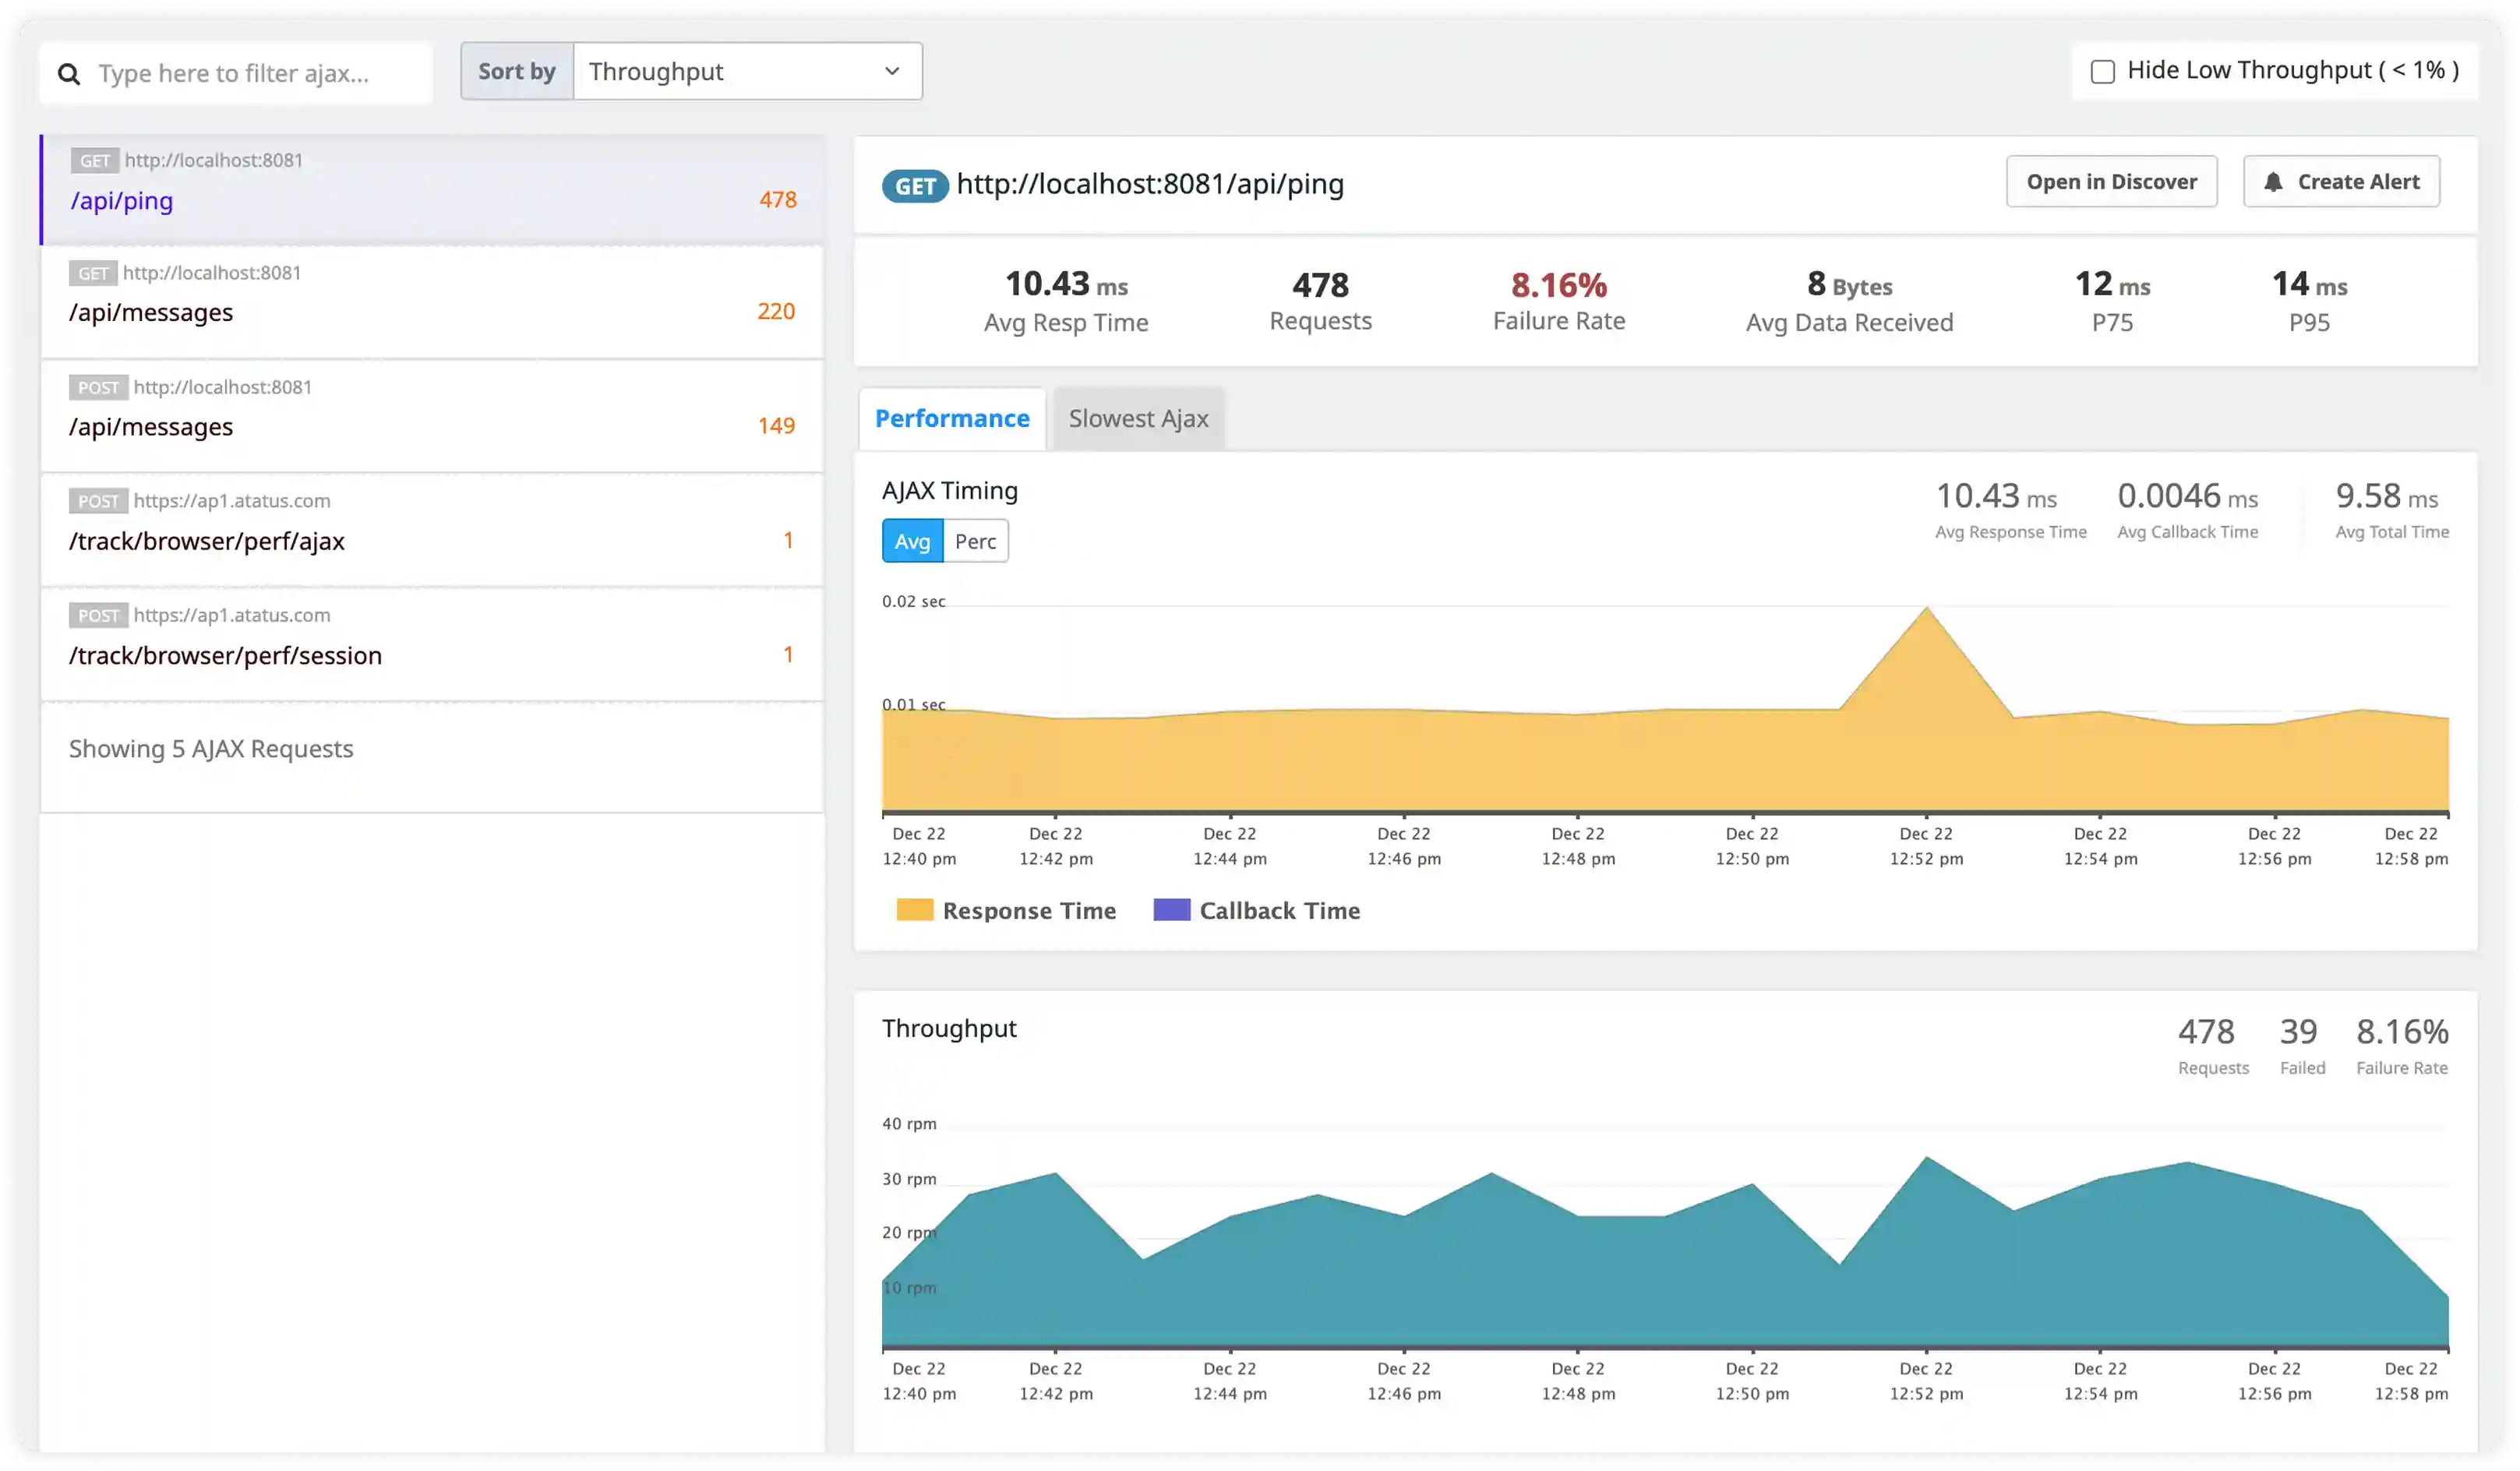
- Track asynchronous operations from API calls, promises, background tasks, and event-driven workflows across the application.
- Measure the delay between async task completion and UI updates triggered by state changes to detect slow render paths.
- Identify concurrent async execution paths that compete for main thread time and block rendering or user interactions.
- Correlate async execution timing with responsiveness, visual stability, and perceived performance.
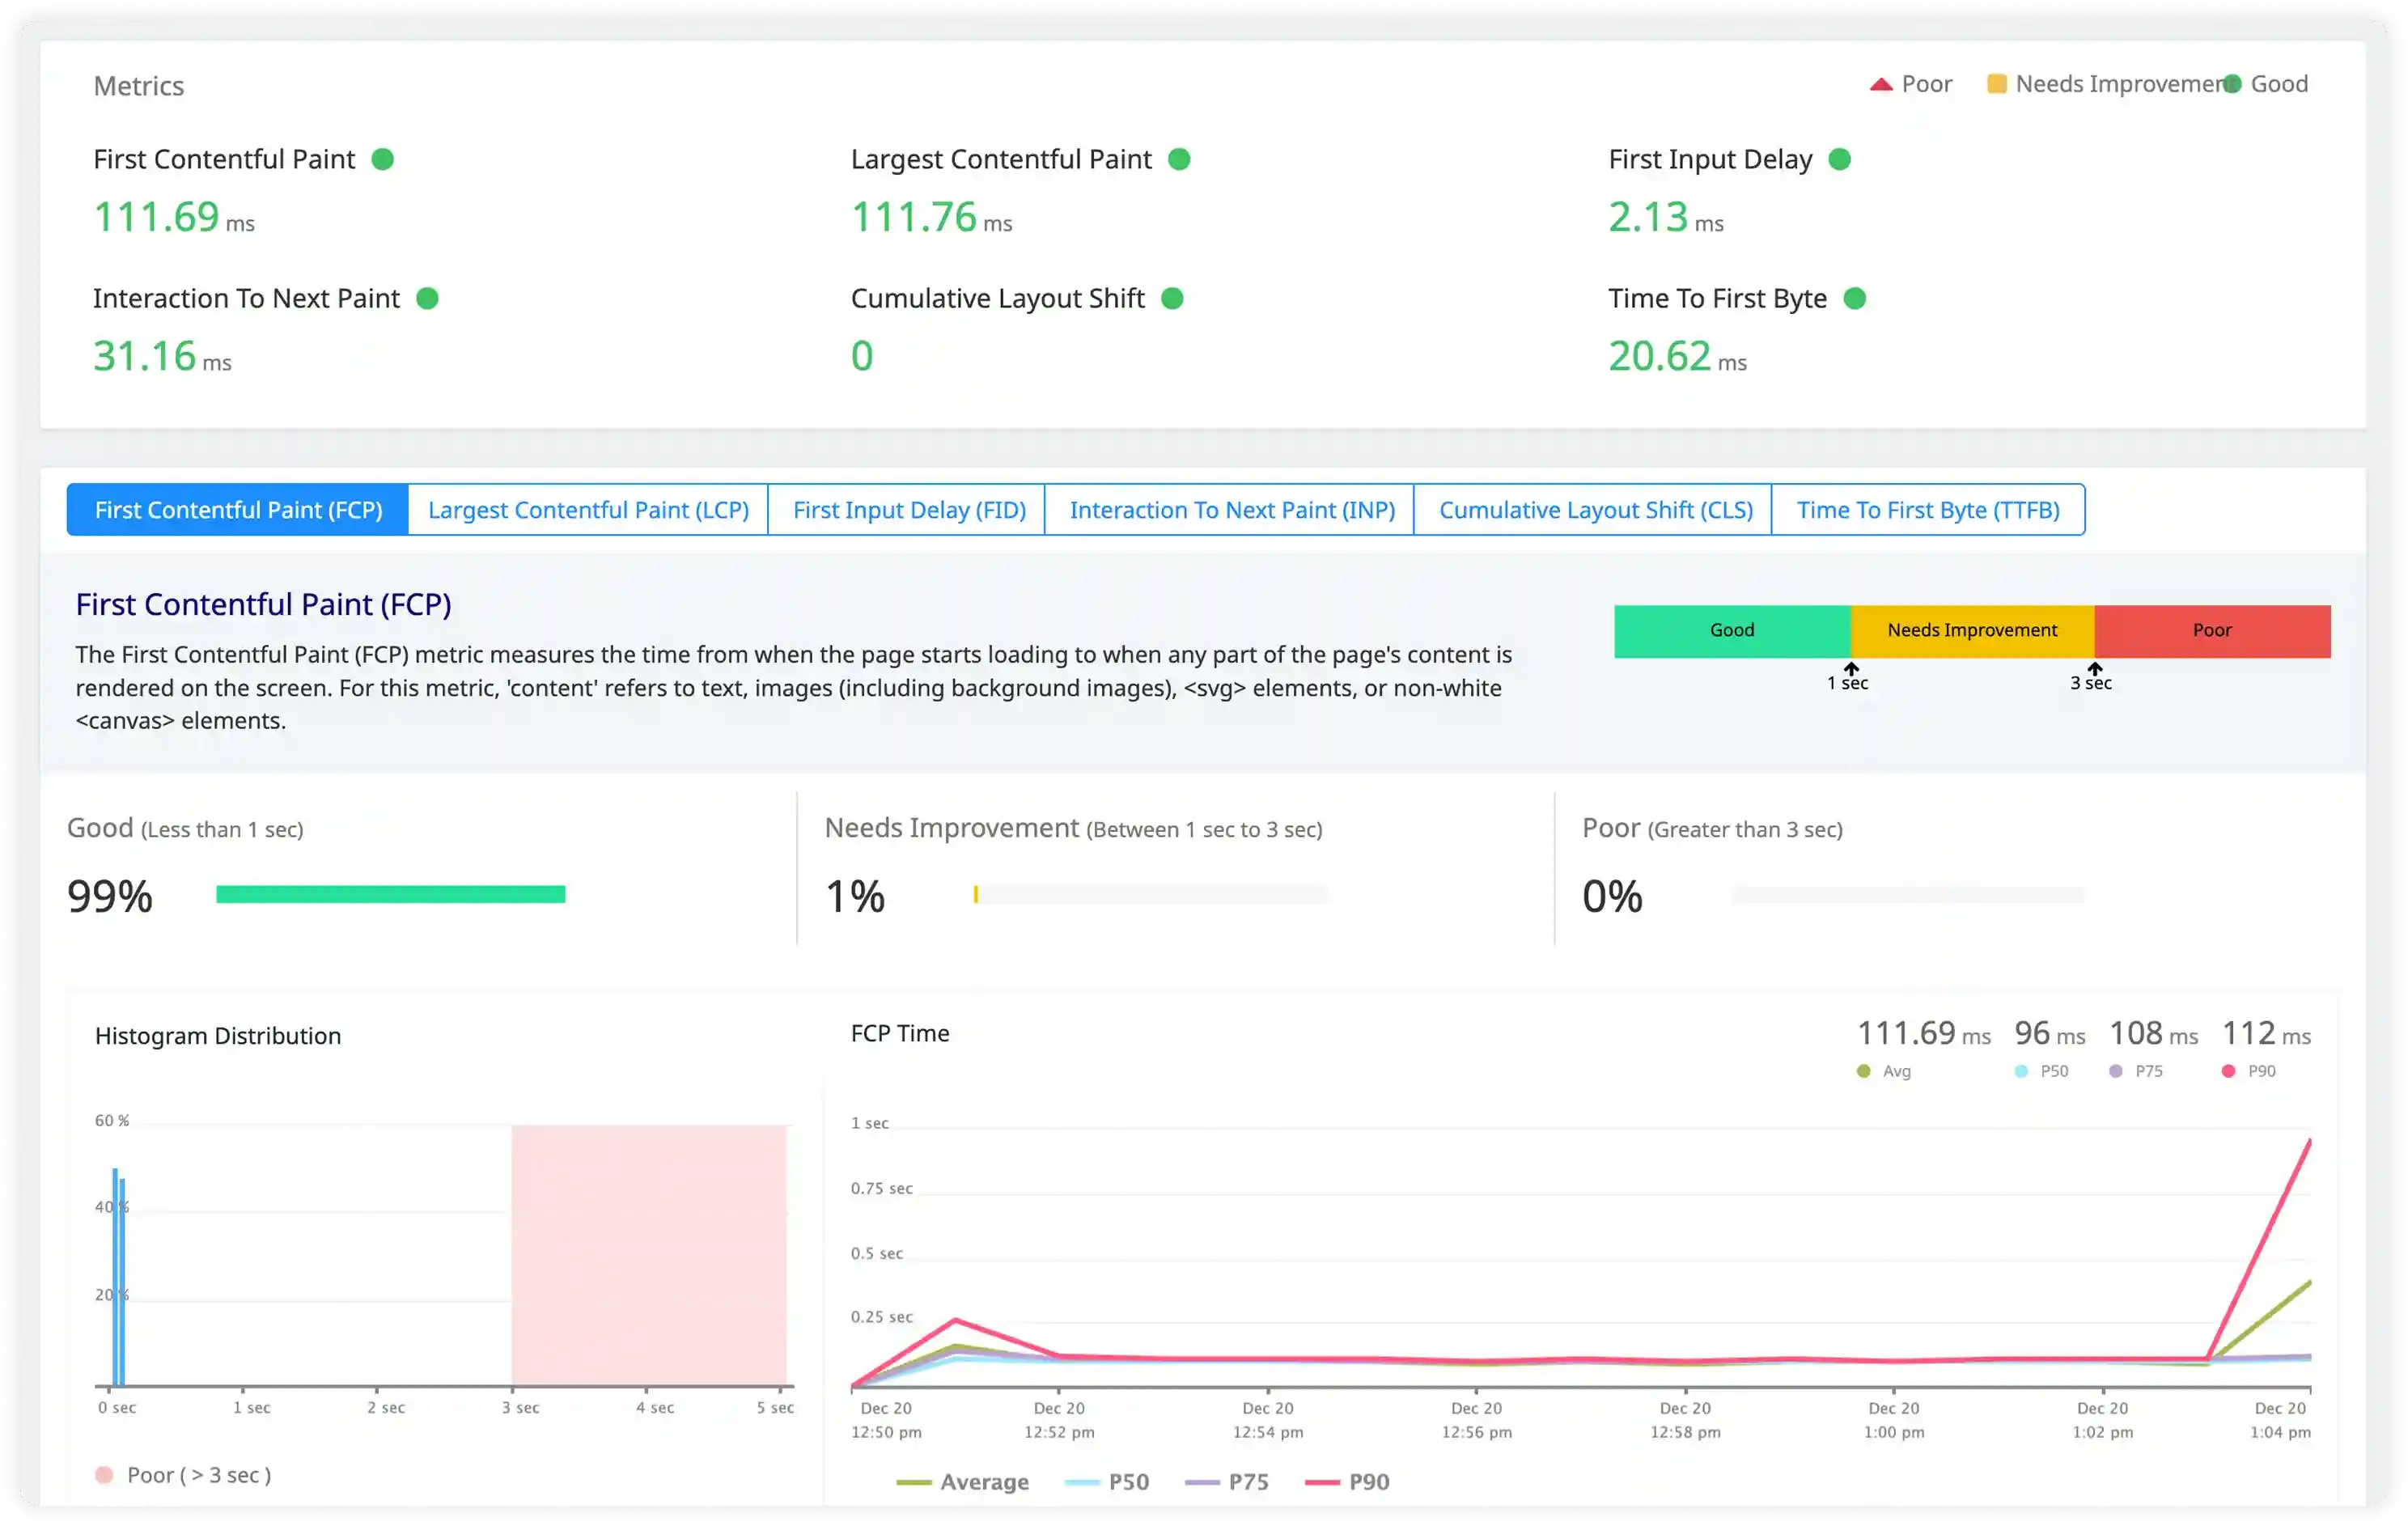
Routing and Code Splitting Execution
- Break down route transition timing across navigation handling, lazy-loaded components, data fetching, and render execution.
- Measure latency introduced by dynamic imports, bundle loading, and code splitting across different network conditions.
- Identify blocking operations that delay component mount or first paint during navigation flows.
- Correlate routing execution timing with workflow interruption, slow transitions, and interaction delays.
Why Choose Atatus for React RUM?
Master React rendering performance, hook execution, and concurrent features without instrumentation overhead.
Built for React rendering
Purpose-built insights into Fiber reconciliation, re-render cascades, and concurrent rendering patterns in production.
Faster React debugging
Real-time stack traces with component tree context, hook execution paths, and reproduction steps for rapid resolution.
Minimal performance footprint
Ultra-lightweight agent with zero sampling preserves React app performance while capturing complete user sessions.
Precise Core Web Vitals tracking
Clean LCP, INP, CLS measurements with React-specific attribution to component renders and hydration timing.
Enterprise React workload scaling
Proven reliability for high-traffic React SPAs, Next.js deployments, and global CDN distributions.
Usage-based scalable pricing
Predictable costs that scale with your React user growth—no vendor lock-in or feature limitations.
Unified Observability for Every Engineering Team
Atatus adapts to how engineering teams work across development, operations, and reliability.
Developers
Trace requests, debug errors, and identify performance issues at the code level with clear context.
DevOps
Track deployments, monitor infrastructure impact, and understand how releases affect application stability.
Release Engineer
Measure service health, latency, and error rates to maintain reliability and reduce production risk.