Serverless Monitoring
Gain complete serverless observability to detect issues early and ensure peak performance in your serverless applications.
Serverless Monitoring Challenges
Without proper serverless monitoring, teams face these critical operational challenges:
Cold Start Latency
Serverless functions experiencing 3-5 second cold starts, causing timeouts and poor user experience during function initialization.
"As a serverless developer, our Lambda functions have 4-second cold starts, causing API timeouts and frustrated users."
Hidden Function Errors
Lambda functions failing silently with no visibility into errors, making debugging nearly impossible without proper monitoring.
"As a backend engineer, our Lambda functions fail randomly and we only find out from customer complaints because CloudWatch Logs is hard to navigate."
Unpredictable Costs
Serverless costs ballooning unexpectedly due to inefficient functions, memory over-provisioning, or excessive invocations.
"As a cloud architect, our Lambda bill went from $500 to $5000 last month and we have no idea which functions are responsible."
No Distributed Tracing
Requests flowing through multiple Lambda functions and microservices with no way to trace the entire request path.
"As a solutions architect, we have 20 Lambda functions chained together, and when something fails, we can't trace which function caused the issue."
Memory and Timeout Issues
Functions timing out or running out of memory without proper insights into optimal memory configuration and execution patterns.
"As a DevOps engineer, our Lambda functions keep timing out, but we don't know if it's memory, CPU, or external API latency."
Concurrency Throttling and Limits
Serverless functions getting throttled during traffic spikes due to concurrency limits, causing dropped requests and degraded user experience.
"As a solutions architect, our Lambda functions hit concurrency limits during Black Friday, dropping 30% of requests, but we had no warning or visibility."
Serverless Monitoring
Without Complexity
Complete serverless observability for AWS, Azure, and Google Cloud. Reduce costs and improve performance effortlessly.
Lightning-Fast Function Monitoring
Monitor AWS Lambda, Azure Functions, and Google Cloud Functions in real-time. Track cold starts, execution times, and resource consumption to optimize serverless performance.
Multi-Cloud Serverless Visibility
Unified observability across all cloud providers. Track function calls, message queues, and third-party integrations from a single dashboard.
Cost Optimization Insights
Identify expensive functions, reduce cold starts, and optimize resource allocation. Cut serverless costs while maintaining peak performance.
How Atatus Serverless Monitoring Optimizes Function Performance
Minimize cold starts and optimize costs with measurable improvements in serverless reliability
Minimize Cold Starts
Track cold start frequency and duration. Get recommendations to reduce cold starts by 70% with provisioned concurrency and optimization tips.
Comprehensive Error Tracking
Capture every Lambda error with full stack traces, request context, and AWS X-Ray integration. Debug issues in minutes, not hours.
Optimize Serverless Costs
Identify expensive functions, optimize memory allocation, and reduce unnecessary invocations. Save 40% on serverless costs.
End-to-End Distributed Tracing
Trace requests across Lambda functions, API Gateway, DynamoDB, and external services. Complete visibility into serverless architectures.
Smart Memory Optimization
Data-driven recommendations for Lambda memory configuration. Find the sweet spot between performance and cost.
Improve Function Reliability
Monitor timeouts, retries, throttling, and concurrent executions. Ensure serverless functions perform reliably under any load.
Complete Serverless
Function Visibility
From cold starts to cost optimization - everything you need for serverless success
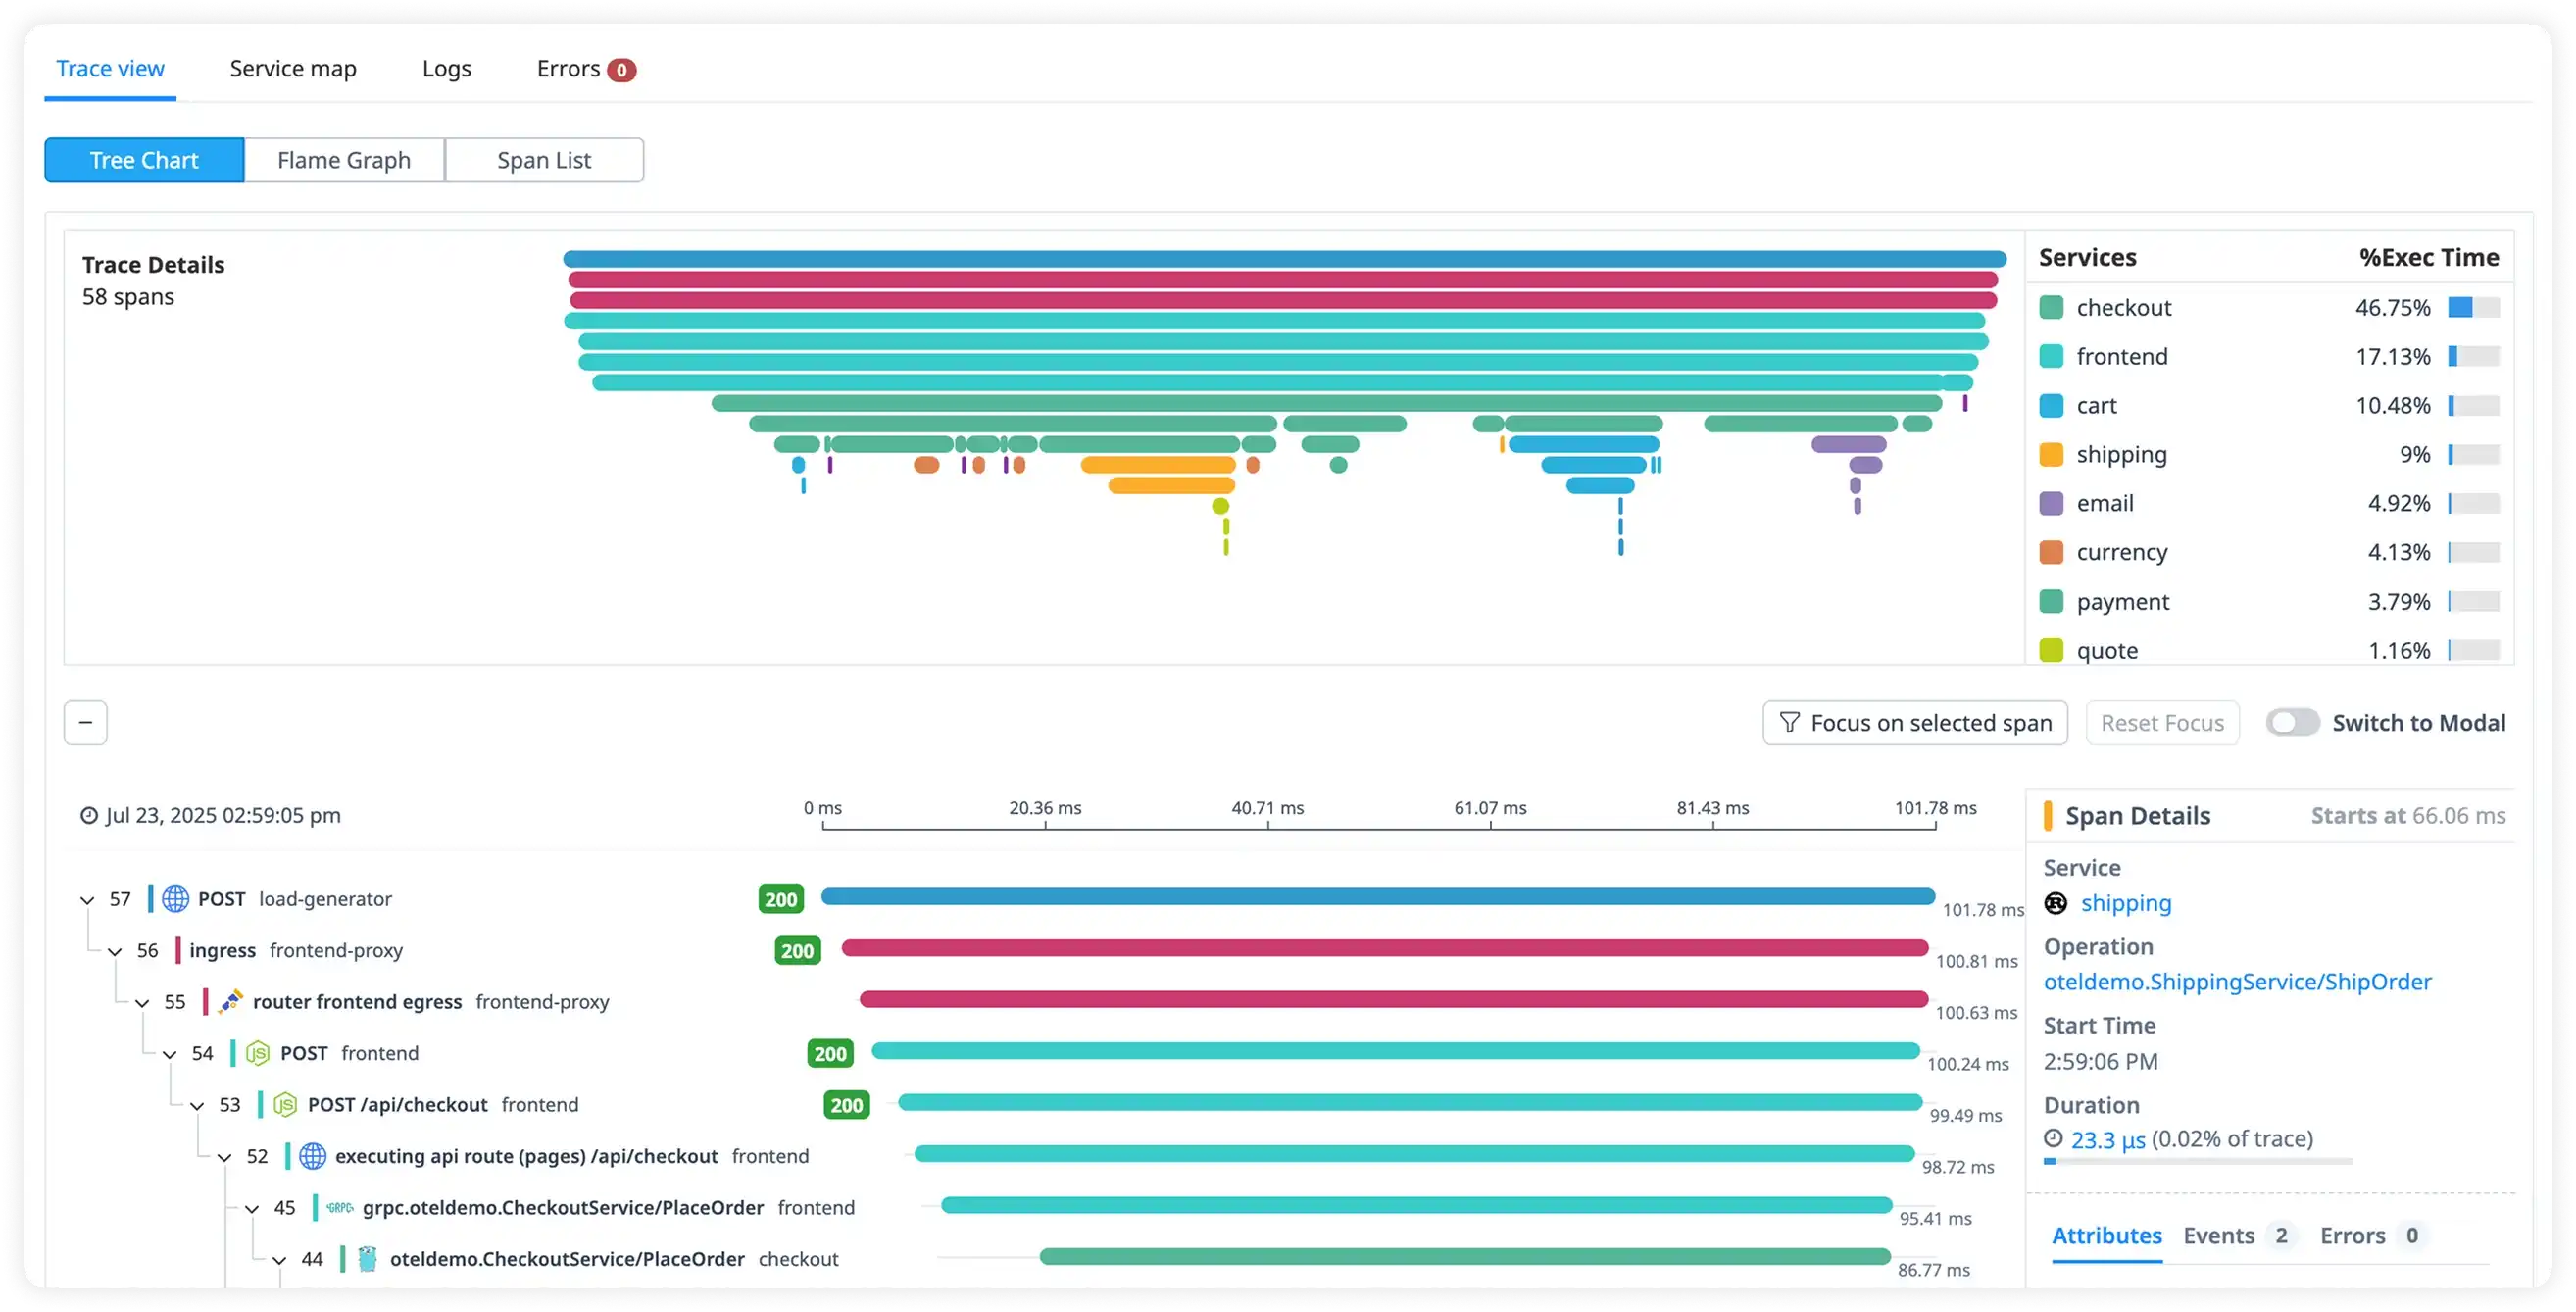
Trace Every Request Across Services
- Follow a single request as it flows across services, APIs, and dependencies
- Instantly identify which service or span is slowing down the request
- Compare execution time across services to pinpoint latency hotspots
- Debug complex distributed systems without guessing or switching tools
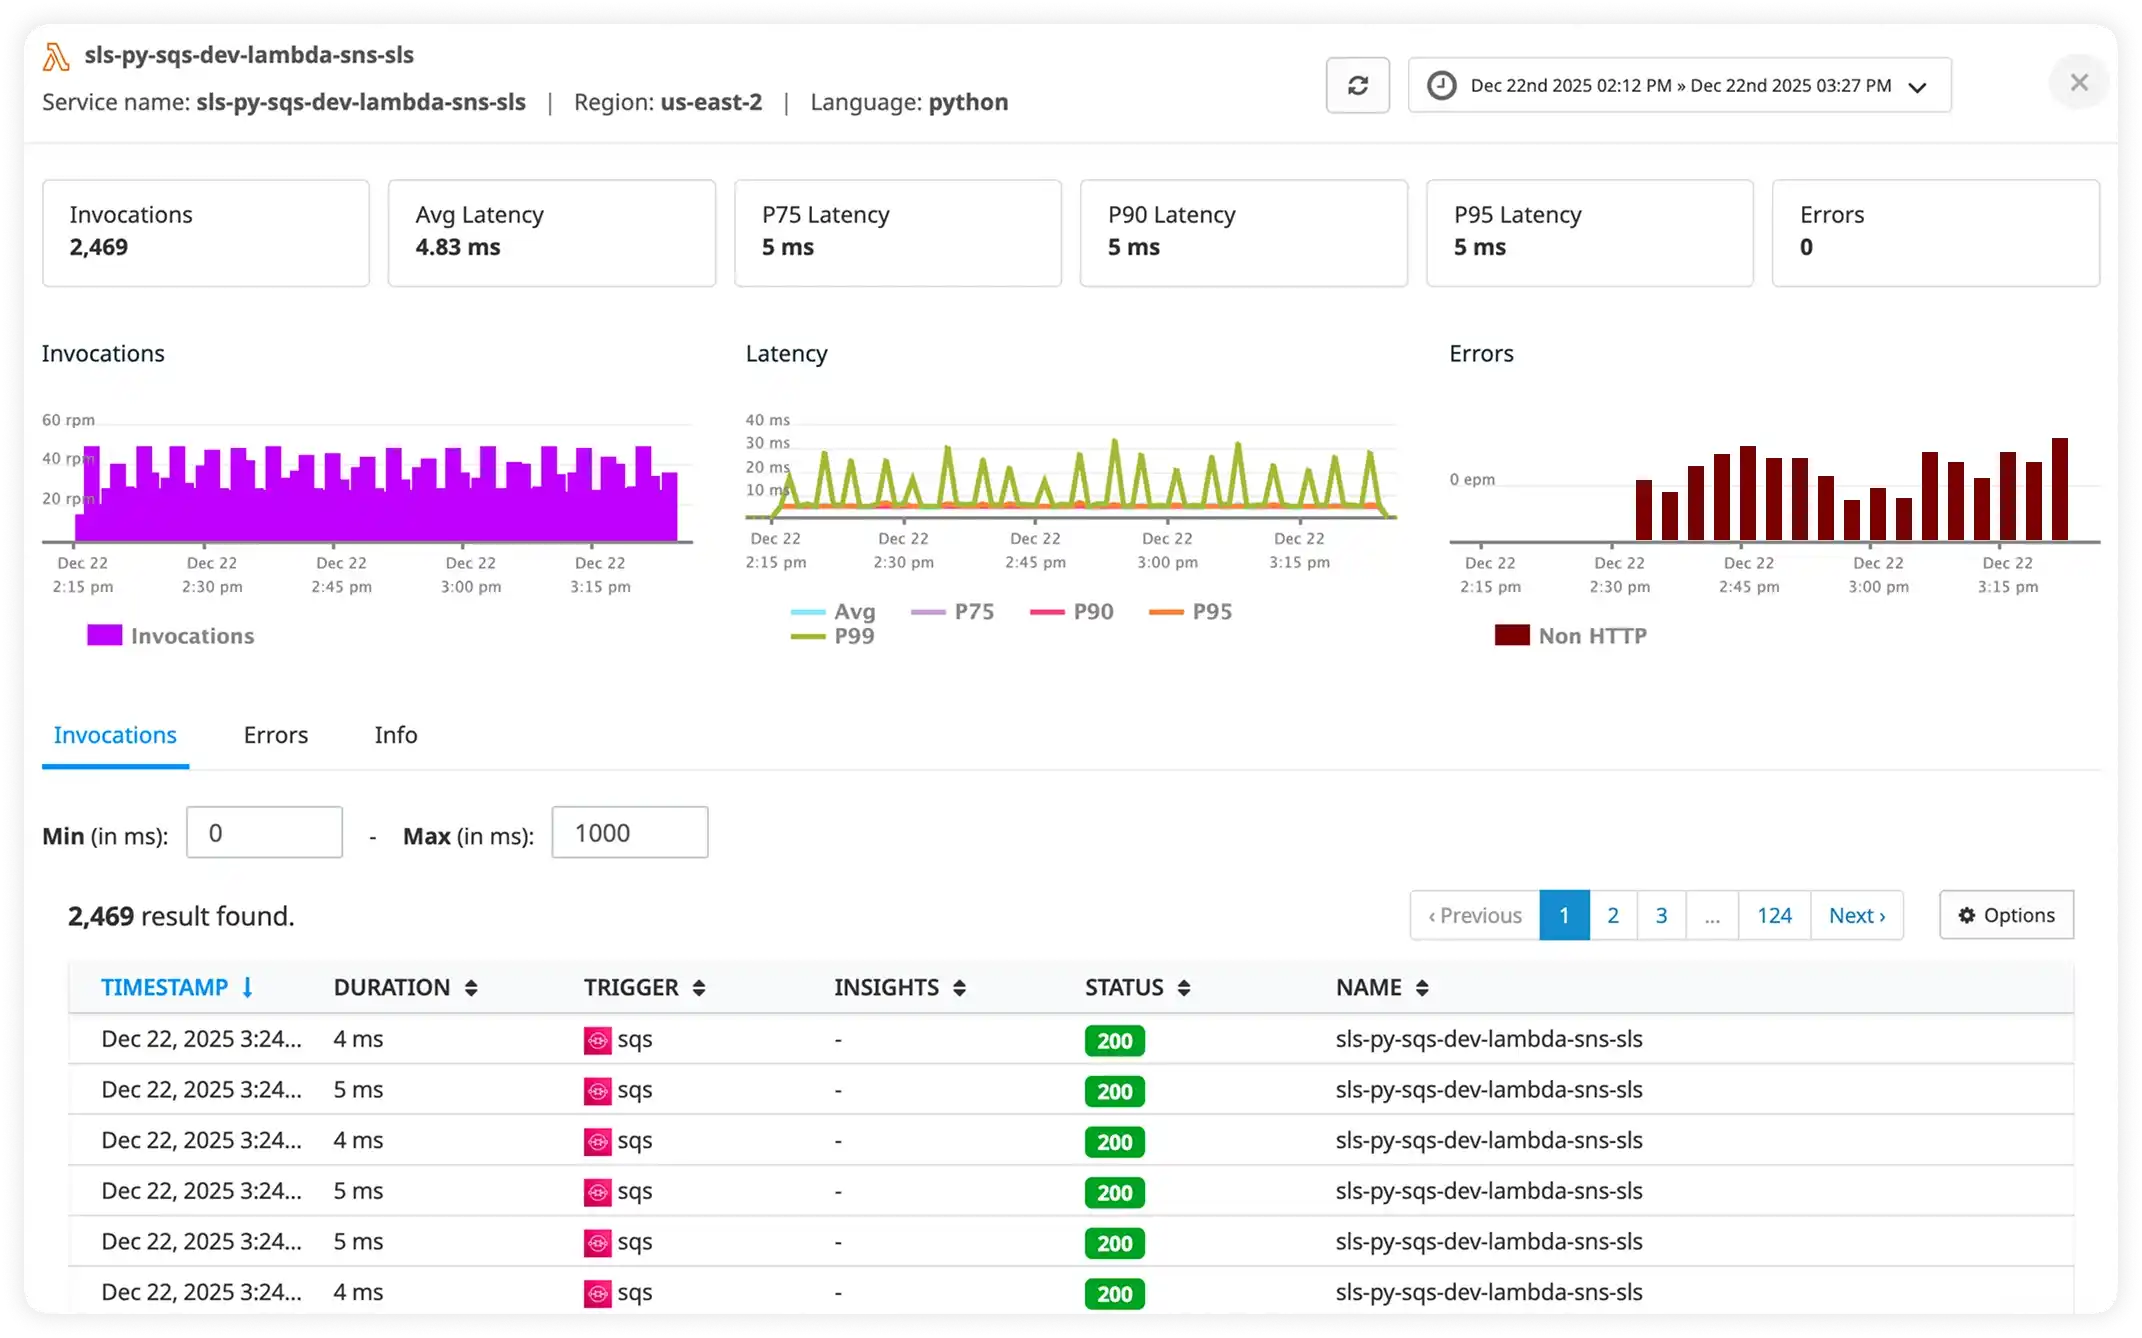
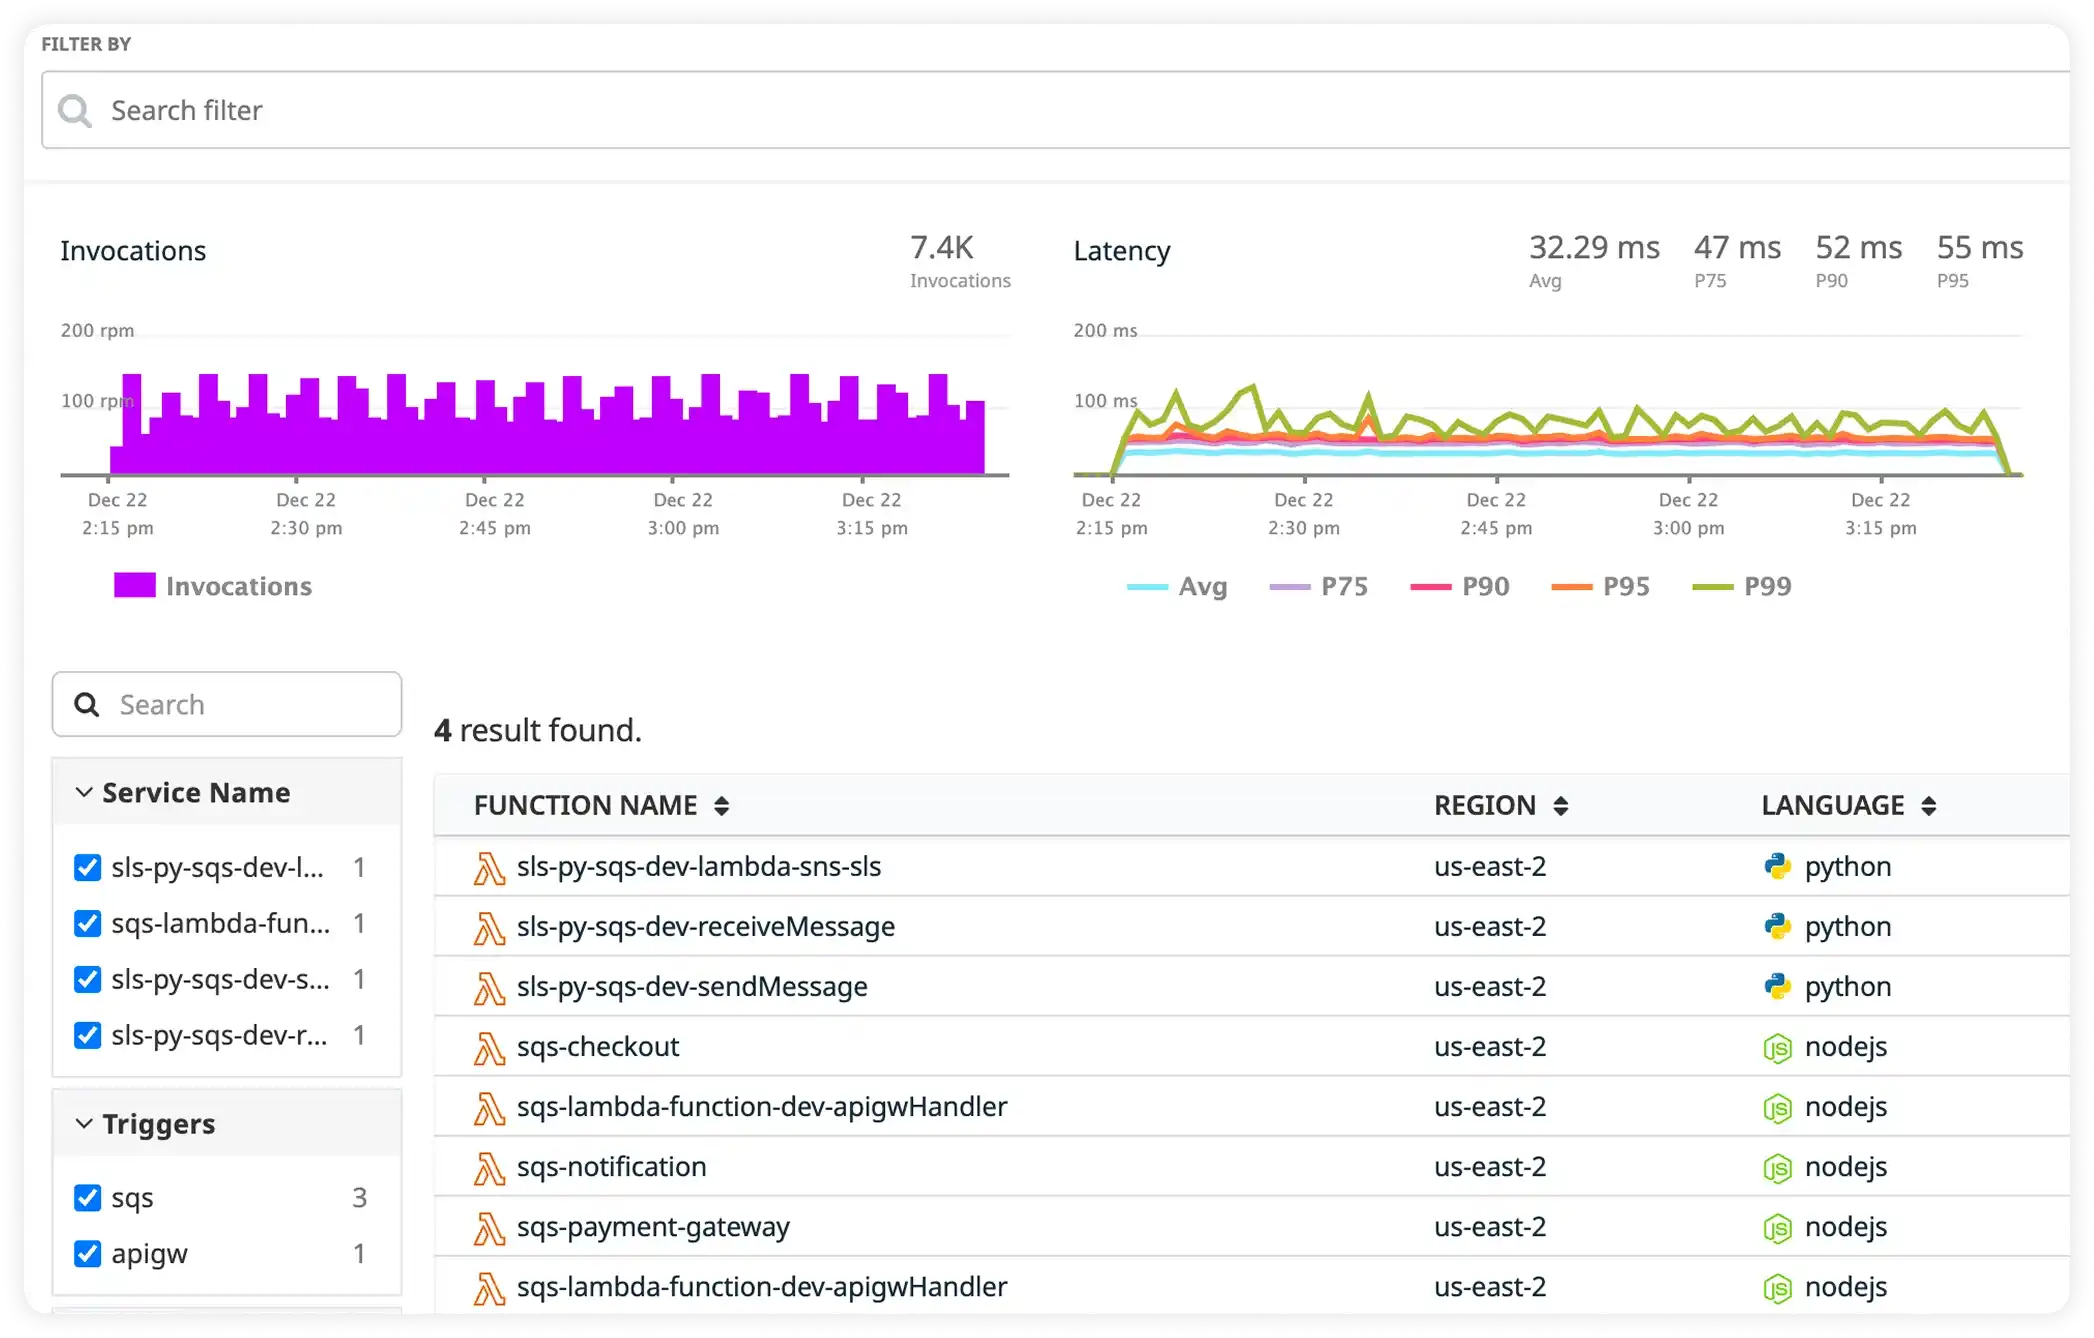
Get Real-Time Visibility Into Serverless Performance
- Monitor serverless invocations, latency percentiles, and error rates in real time
- Understand cold starts, execution duration, and throughput patterns
- Detect performance regressions before they impact downstream services
- Troubleshoot failures with full execution context and request details
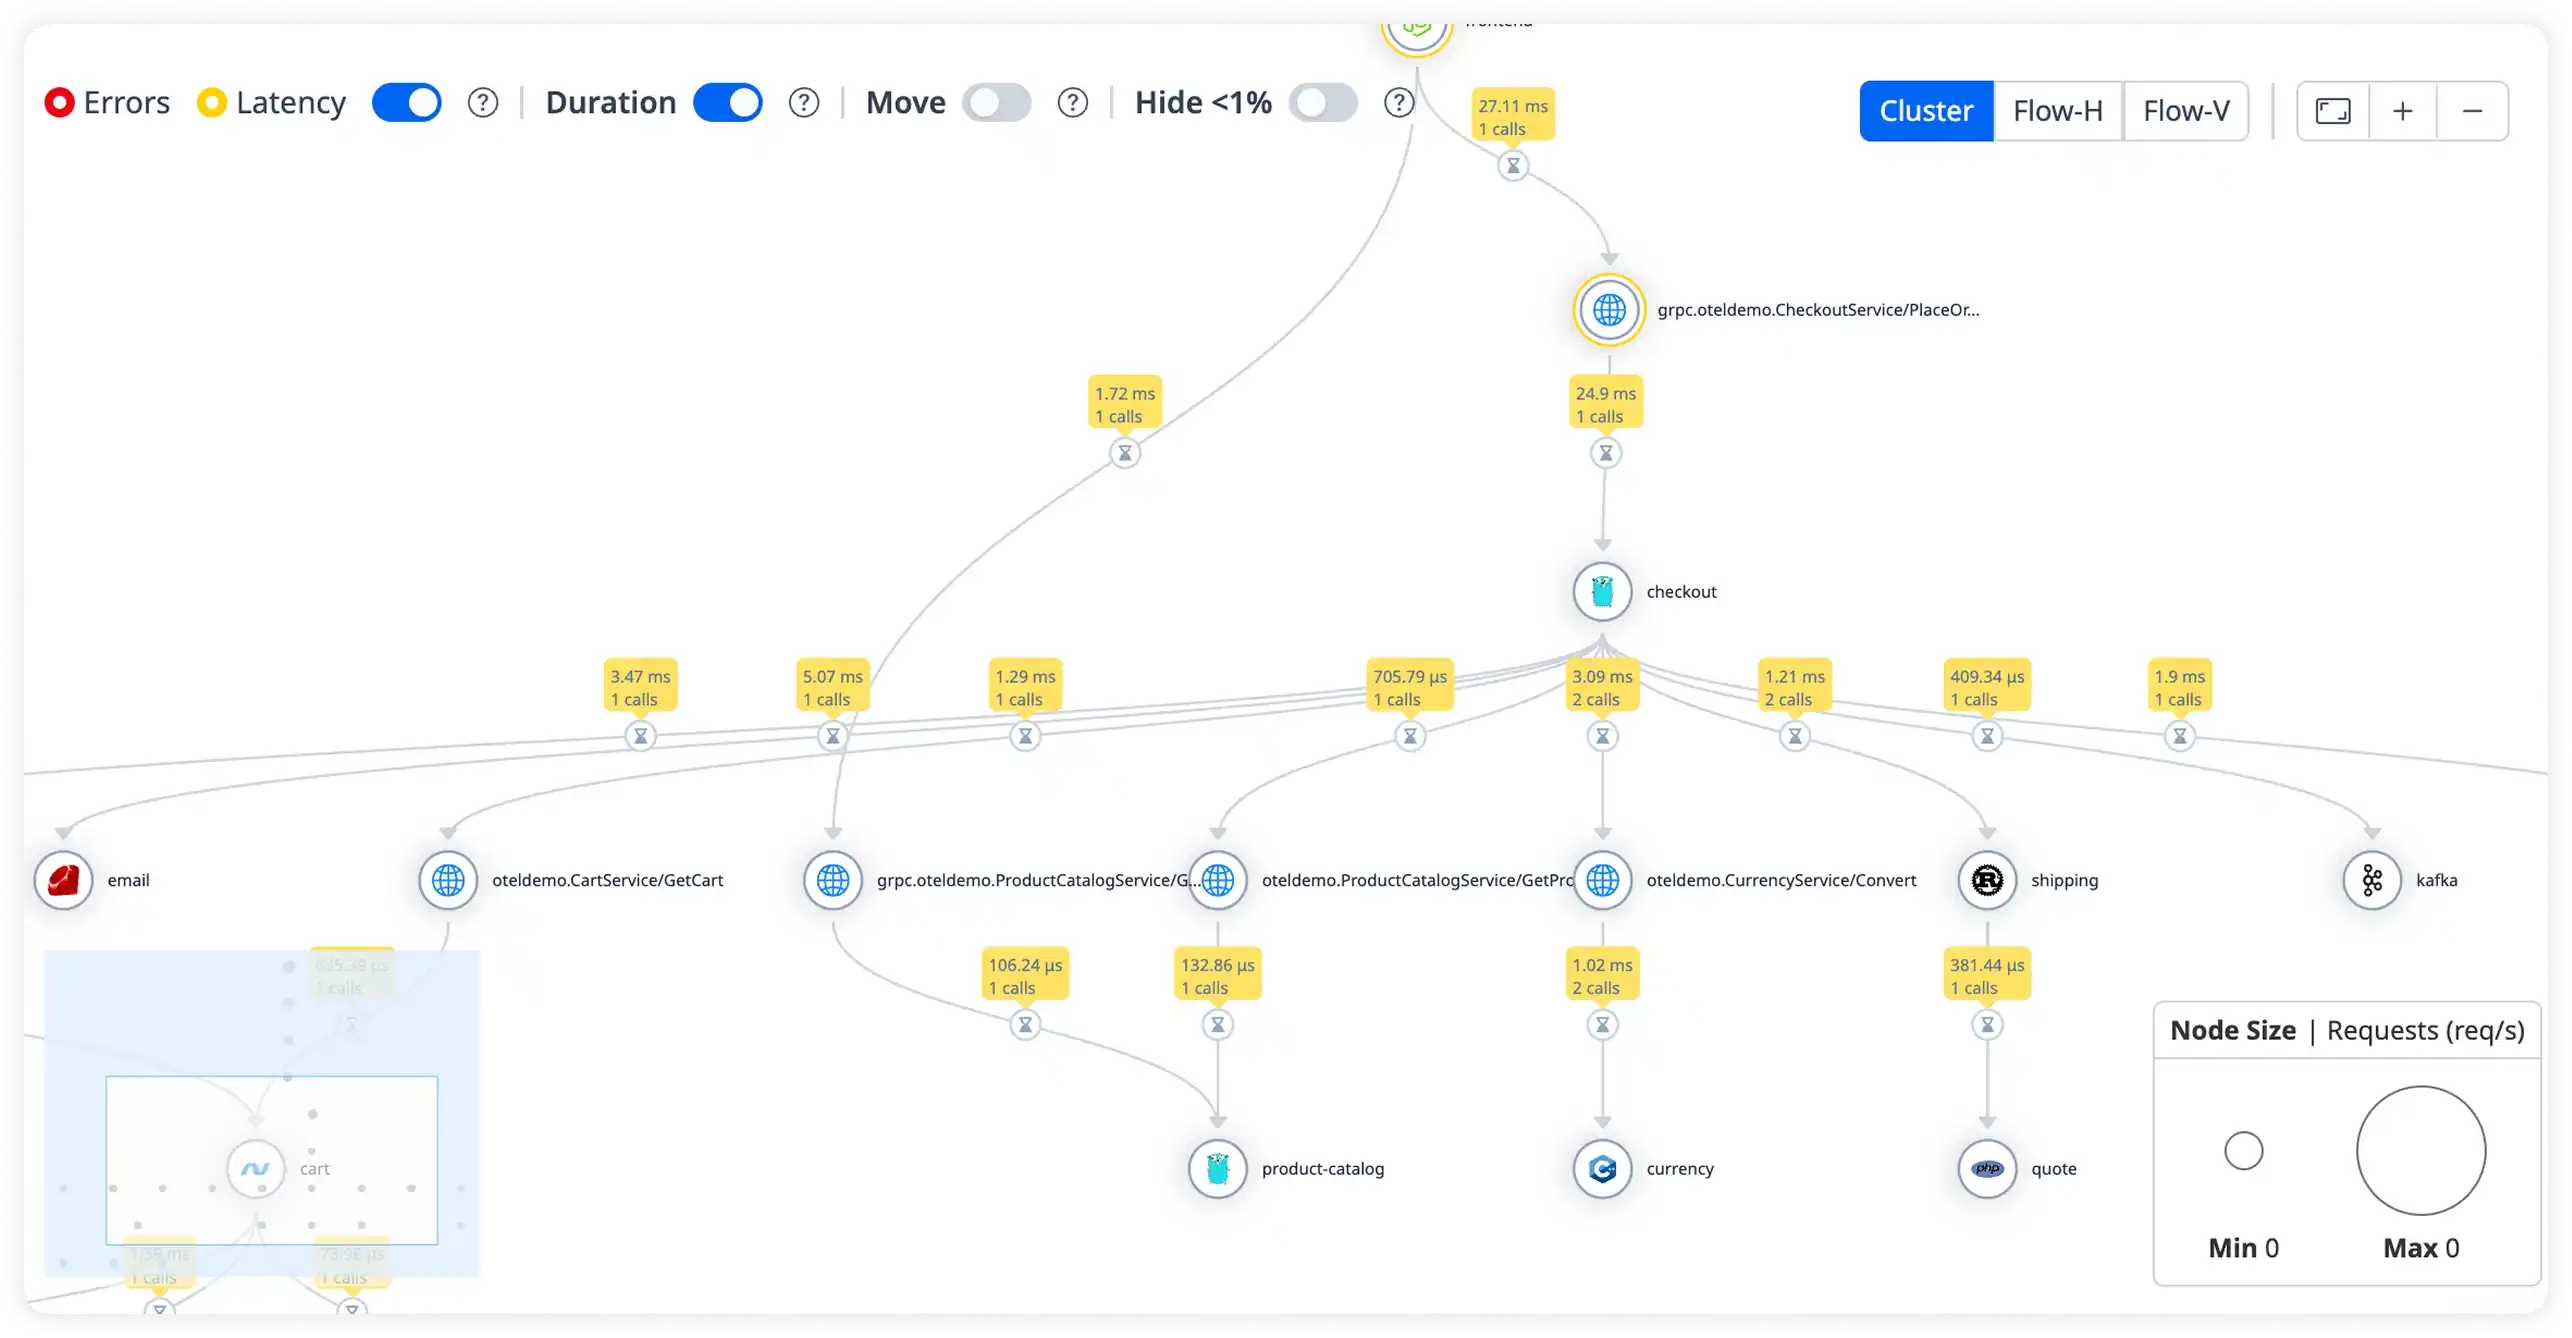
Visualize How Your Services Interact
- See a live map of service dependencies and request flows
- Understand how latency, errors, and traffic propagate across services
- Quickly isolate failing or overloaded services in complex architectures
- Gain clarity into system behavior without manually mapping dependencies
Serverless Monitoring in Under 5 Minutes
Three simple steps to complete serverless observability. No credit card required.
Install the SDK
Add Atatus SDK to your serverless functions. Supports AWS Lambda, Azure Functions, and Google Cloud Functions with minimal code changes.
Auto-Instrument Functions
Automatically captures execution metrics, cold starts, errors, and traces without manual instrumentation. Works out of the box.
Monitor & Optimize
Access real-time dashboards to track function performance, reduce cold starts, and optimize costs with actionable insights.
Milestones that spark performance excellence
Reflections from clients who've achieved unmatched excellence through innovative strategies.
Read customer stories


