Complete AWS Monitoring for Cloud-Native Applications
Monitor your entire AWS infrastructure with deep visibility into EC2, Lambda, RDS, ECS, and more. Track performance metrics, identify bottlenecks, and optimize costs across your AWS environment with real-time dashboards and intelligent alerting.
Full-Stack Observability for AWS Workloads
End-to-end AWS coverage
Observe workloads across EC2, ECS, EKS, Lambda, RDS, S3, and networking layers with a unified operational view.
Container workload visibility
Track task, pod, and node behavior across ECS and EKS clusters without losing application context.
Serverless execution clarity
Maintain visibility into Lambda executions where compute is ephemeral and infrastructure is abstracted.
Distributed request tracing
Follow requests across load balancers, microservices, background jobs, and data stores.
Application-aware infrastructure
Interpret CPU, memory, and network usage in relation to real application workload and traffic.
Correlated telemetry timelines
Analyze logs, metrics, and traces together through a shared execution timeline.
Scale-ready observability
Maintain consistent visibility as traffic increases and resources autoscale.
Shared operational context
Enable platform, SRE, and backend teams to operate from the same production view.
Unified AWS Observability
- Bring metrics, logs, traces, and events into a single unified platform so teams can investigate issues without jumping between multiple AWS tools
- Monitor performance across EC2, EKS, Lambda, RDS, storage, and networking services in one consistent, real-time view
- Automatically correlate infrastructure health with application behavior to surface root causes faster
- Visualize service dependencies and request flows to understand how failures cascade across AWS components
- Reduce alert fatigue with intelligent anomaly detection and context-aware notifications
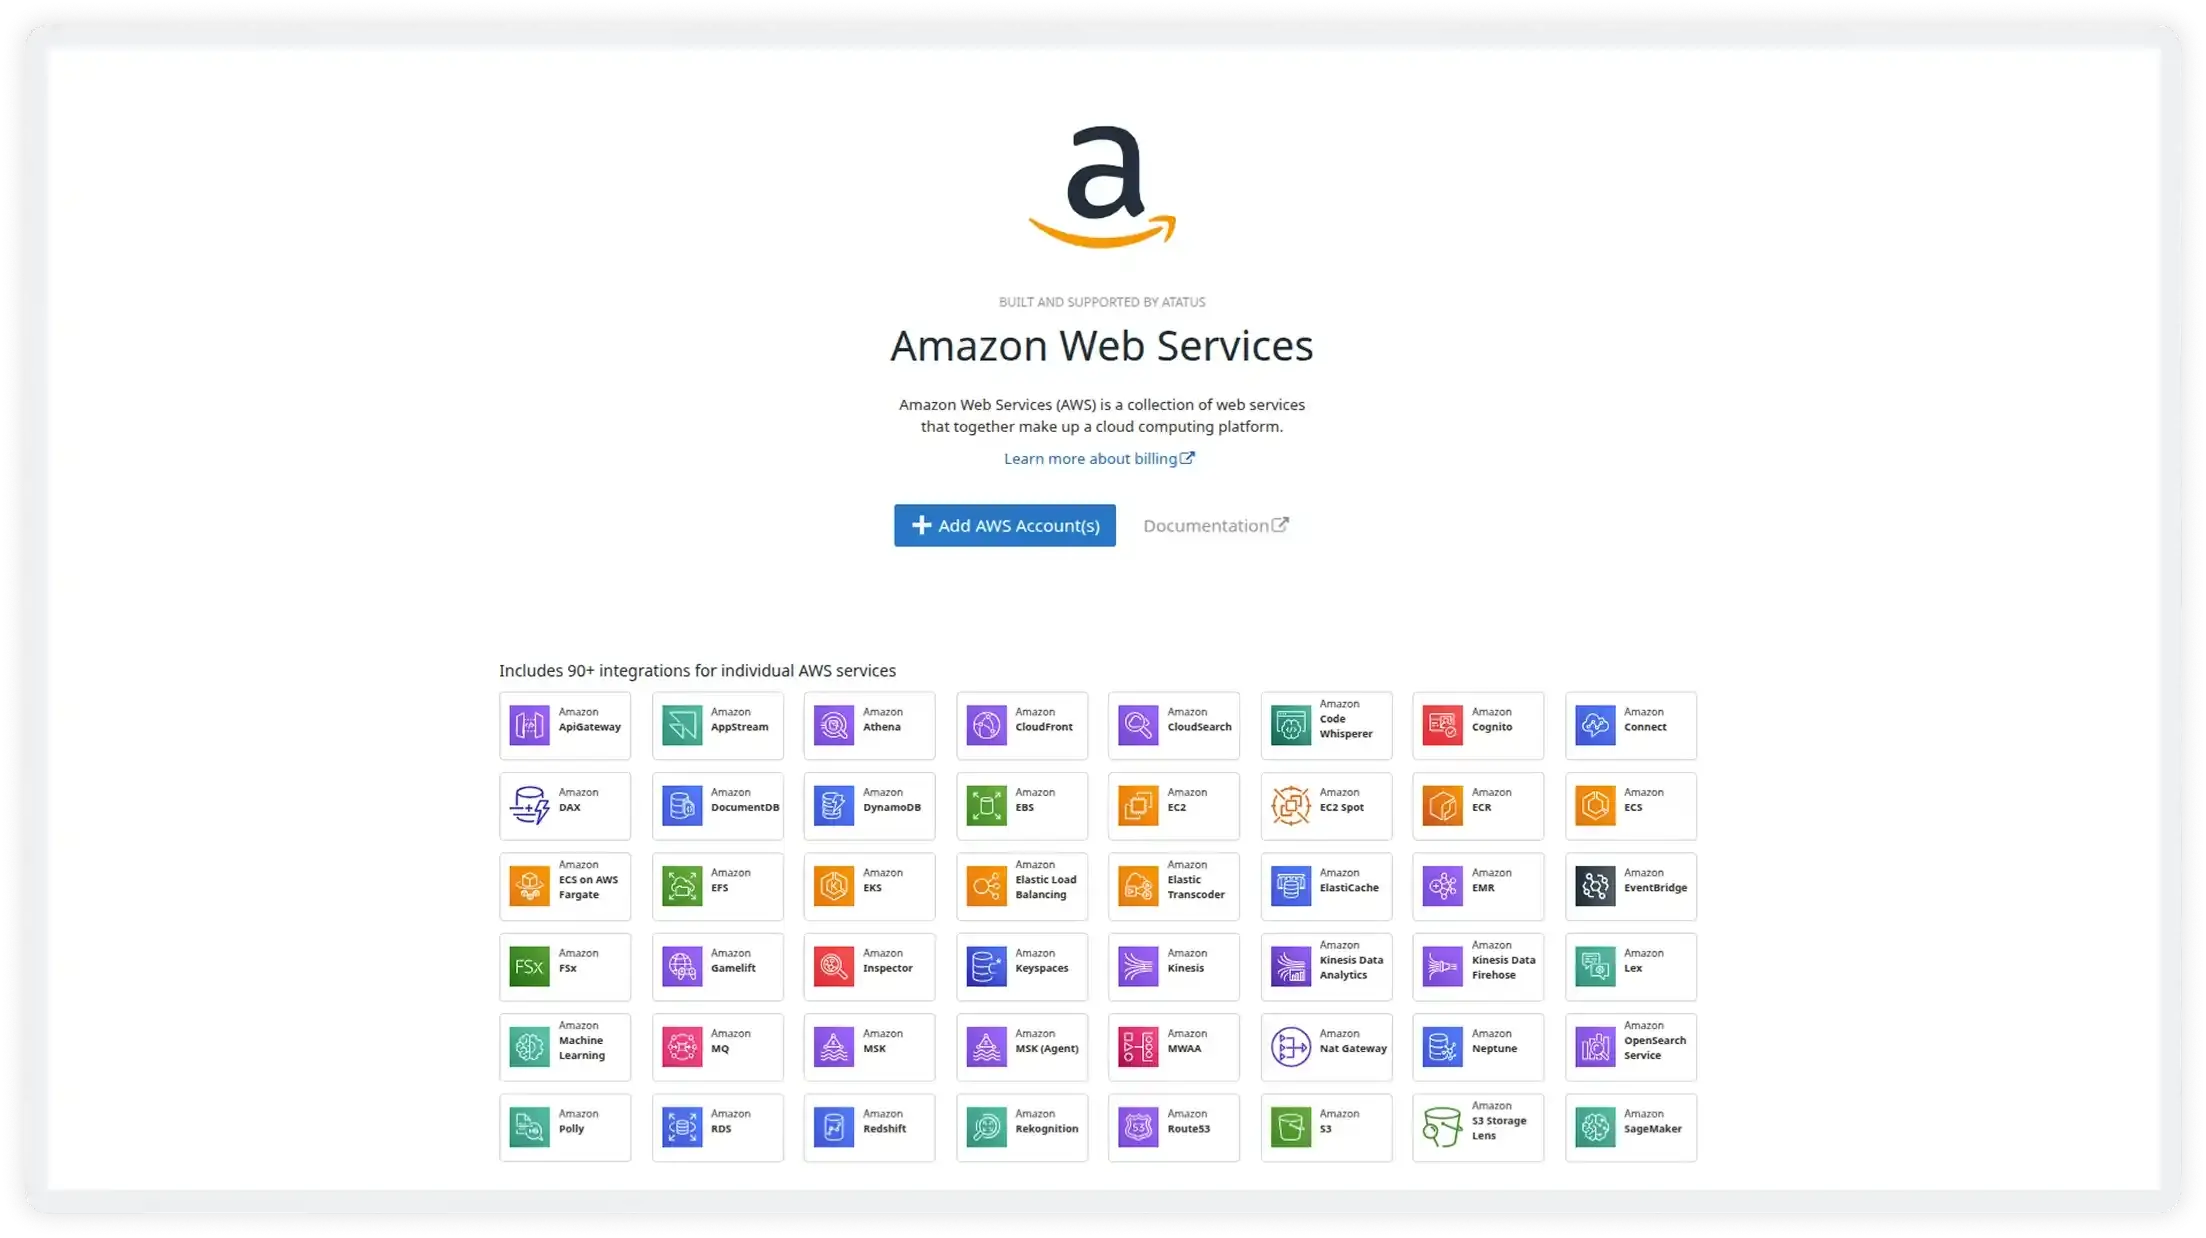
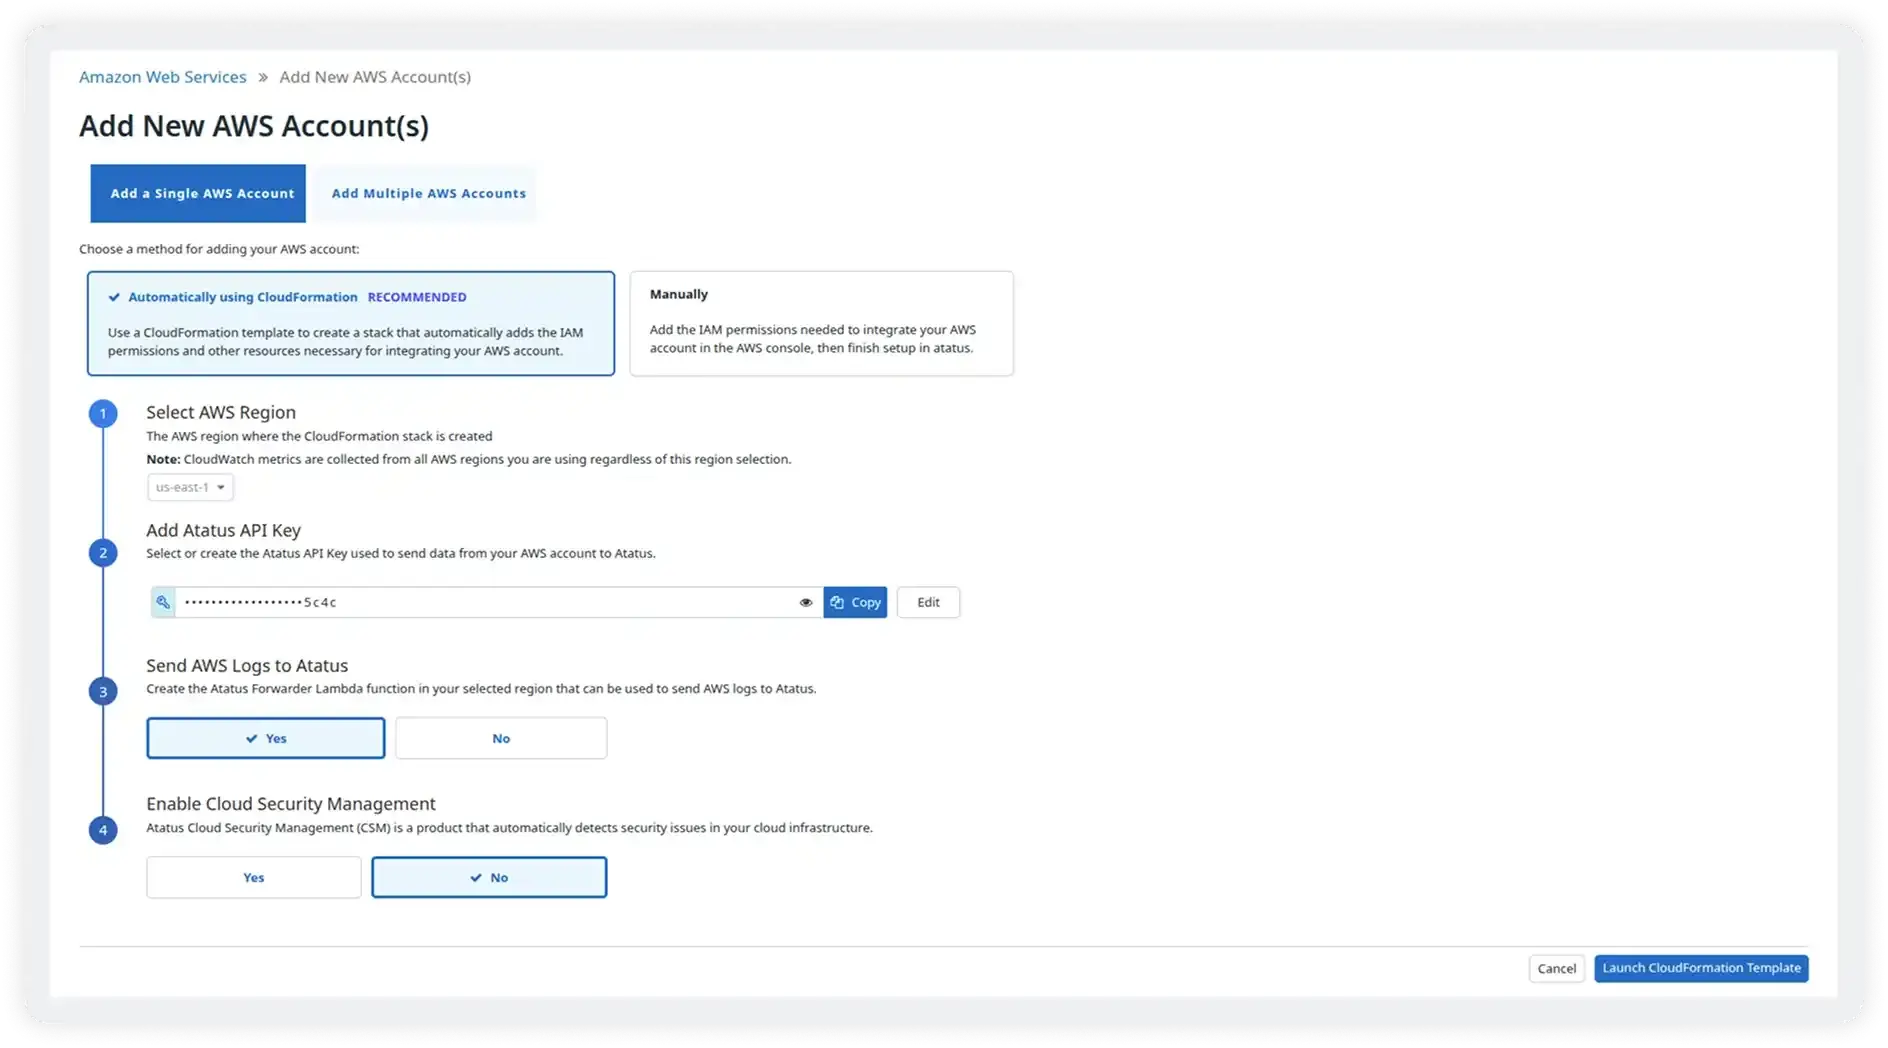
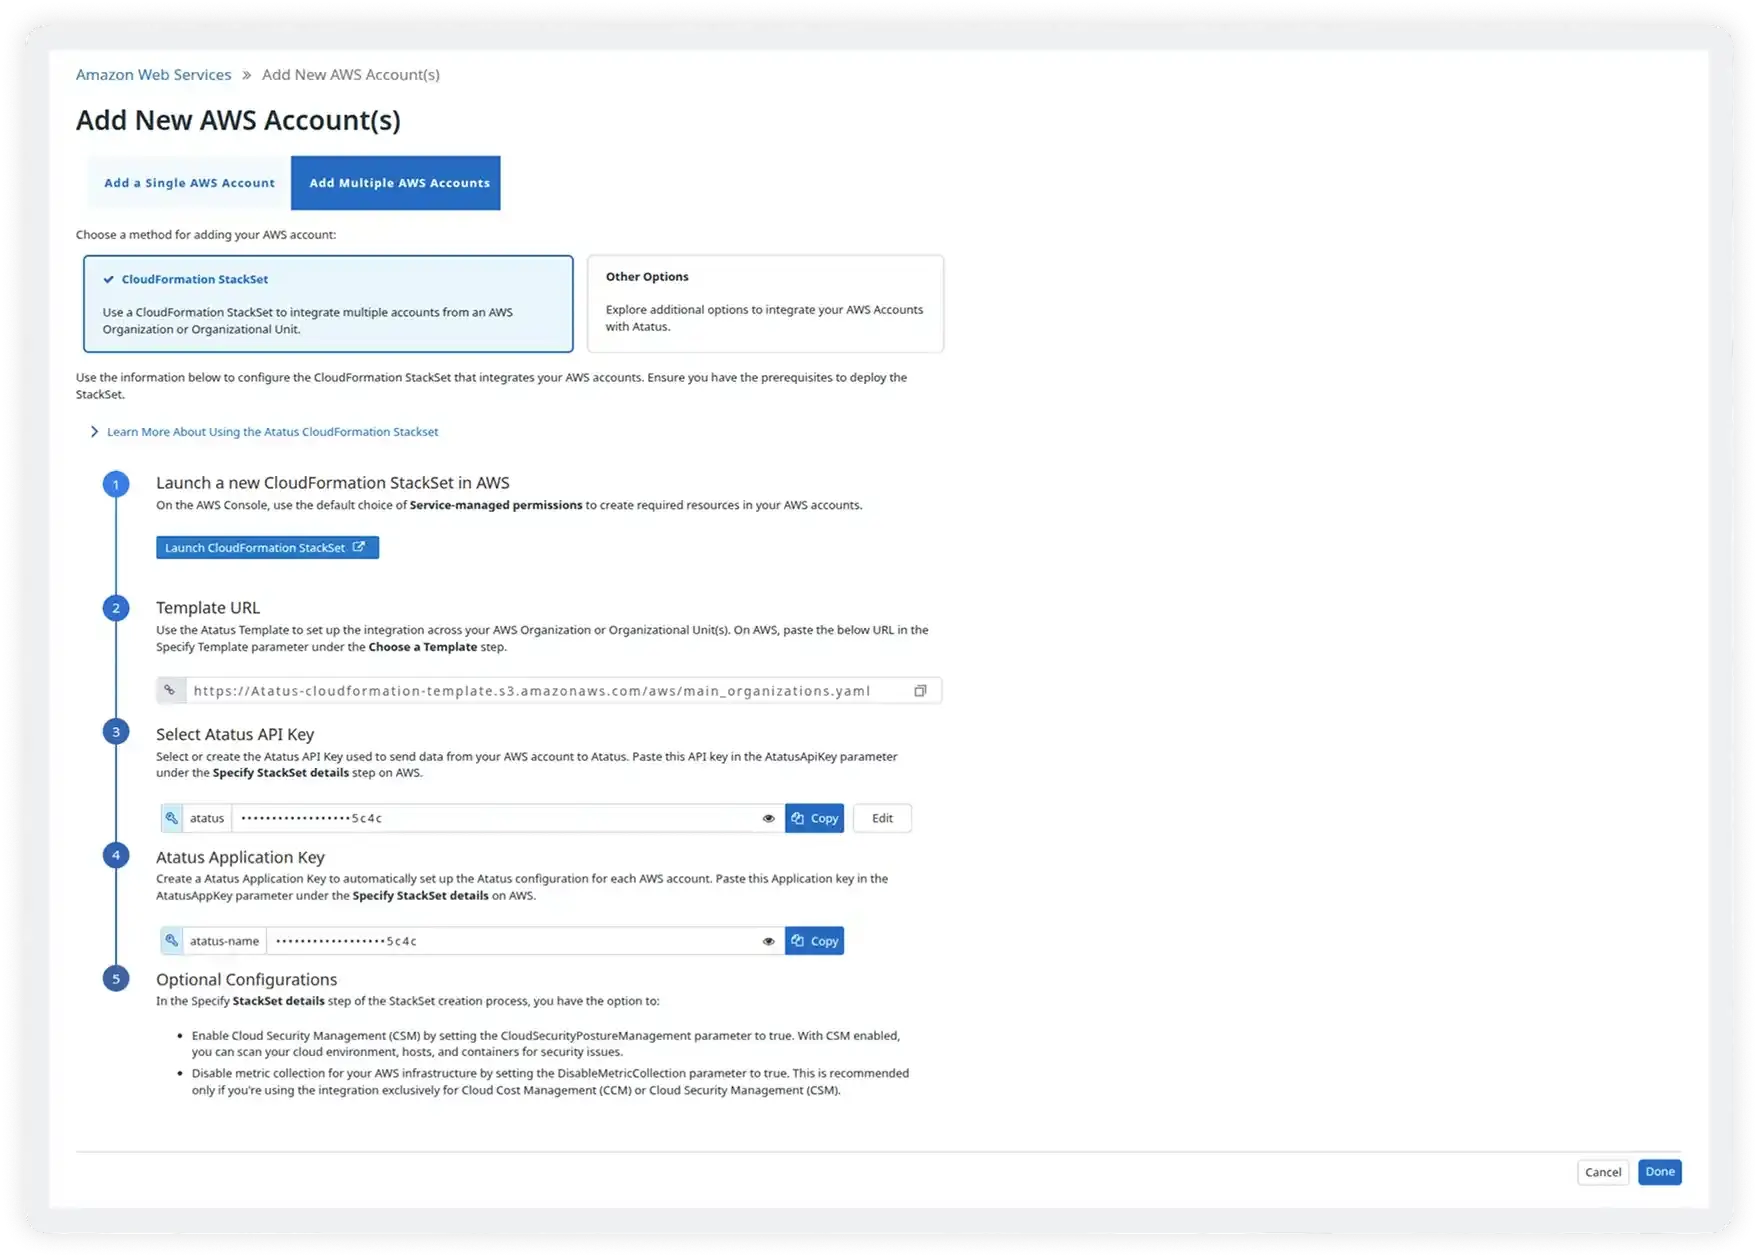
Seamless Onboarding
- Set up AWS monitoring in minutes using guided workflows, CloudFormation templates, or secure API connections with minimal engineering effort
- Automatically discover and monitor new AWS resources as soon as they are created without manual configuration
- Collect telemetry without code changes or complex setup, reducing developer and operational overhead
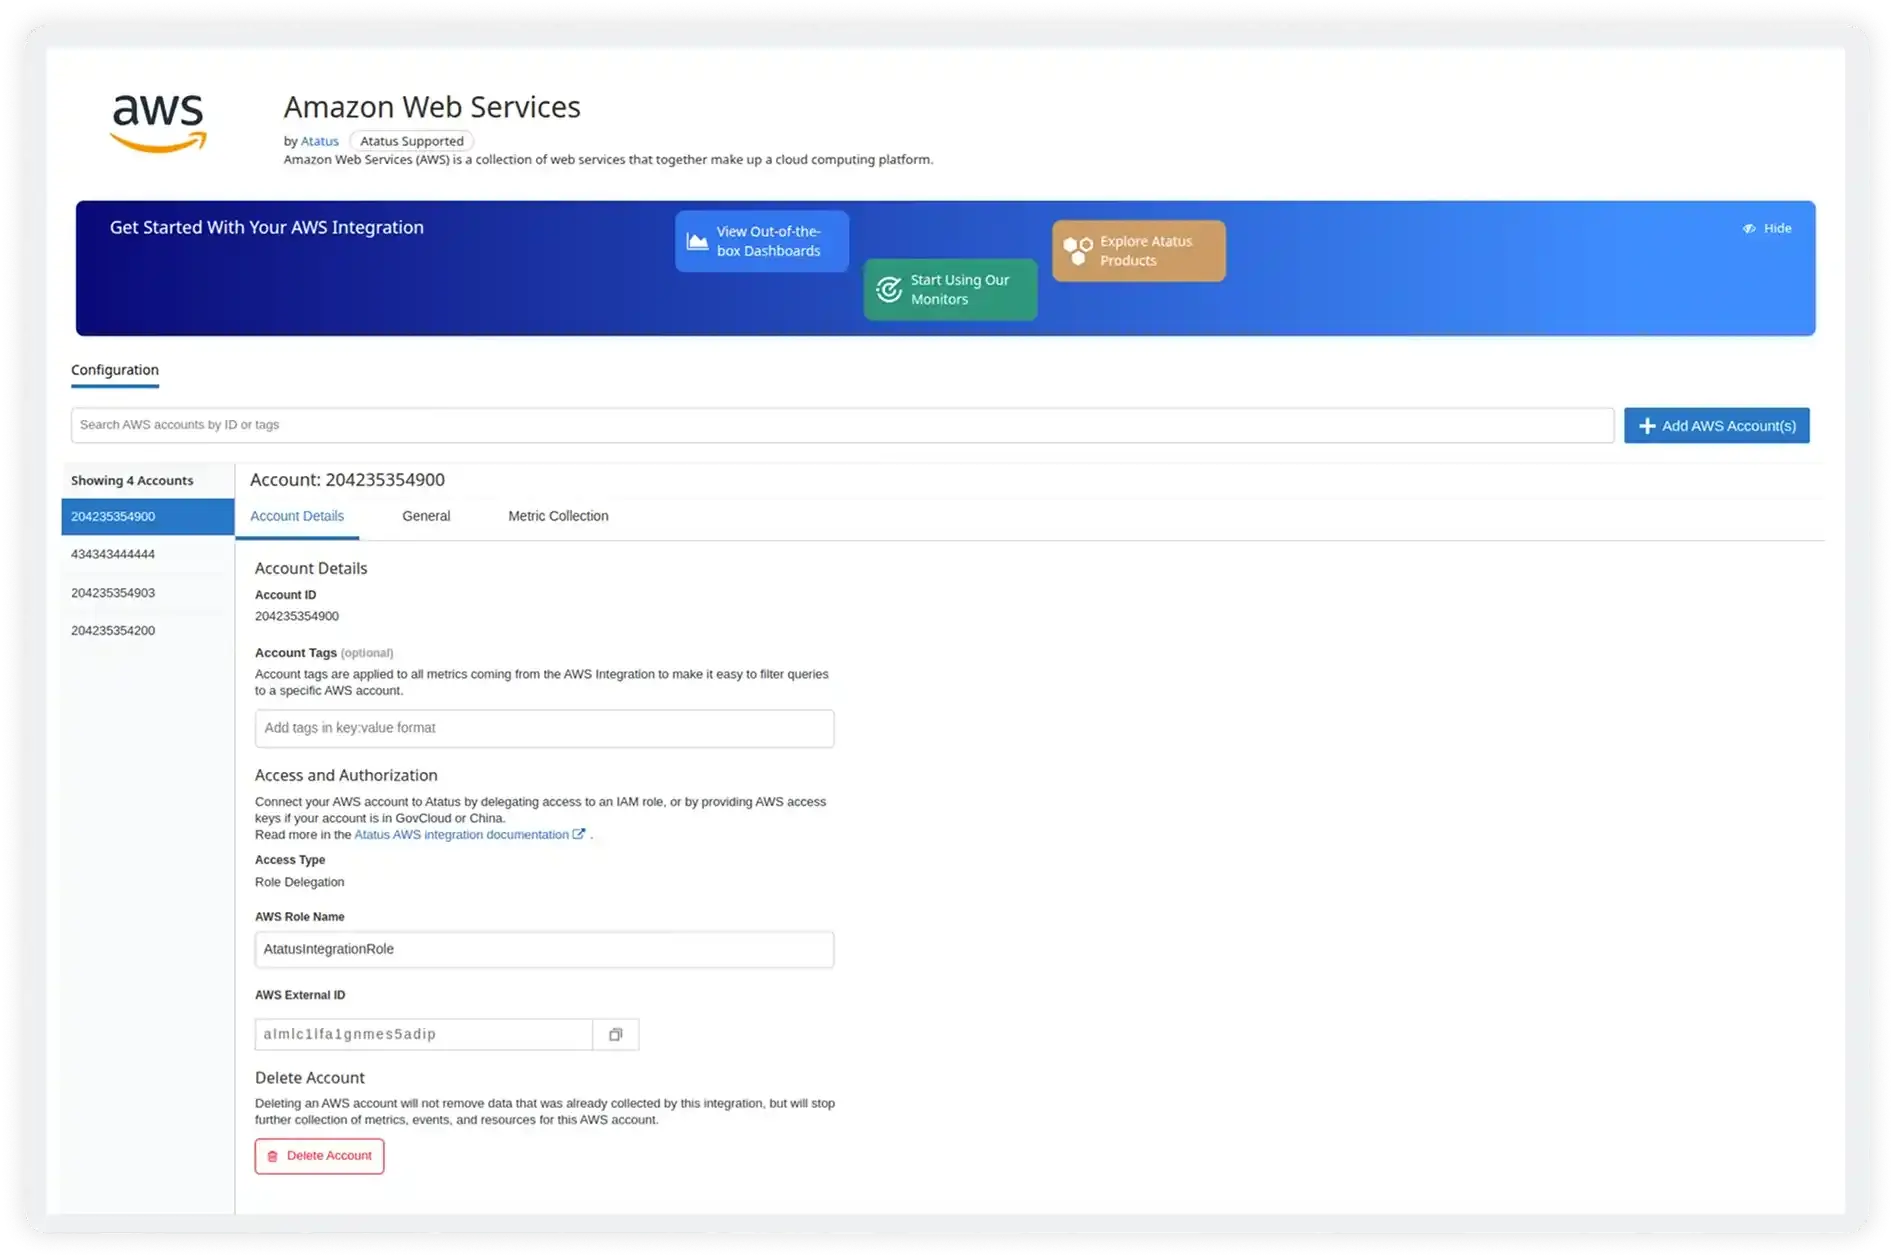
- Securely connect multiple AWS accounts with proper access controls and centralized governance
- Standardize onboarding across teams and environments for faster, consistent rollout
Deep Resource Visibility
- Gain detailed insights into compute, containers, and serverless workloads at the individual resource level
- Track CPU, memory, disk, network, and health metrics continuously to detect performance risks early
- Identify underutilized and overloaded resources to improve system reliability and optimize cloud costs
- Understand service dependencies and performance impact across distributed systems and workflows
- Link infrastructure behavior directly to application performance and overall user experience
Effortless Setup & Scalability
- Automatically scale monitoring as traffic, services, and environments grow without requiring constant configuration changes
- Process increasing volumes of metrics and logs while maintaining performance, reliability, and real-time visibility
- Monitor multi-region and multi-account AWS environments from a single centralized dashboard for easier operations
- Maintain consistent visibility across development, staging, and production environments to avoid blind spots
- Easily extend monitoring as new AWS services and workloads are introduced without added complexity
Why teams choose Atatus for AWS?
AWS teams choose Atatus to stay in control of complex, fast-scaling environments without losing production clarity.
Fits AWS service sprawl
Atatus handles visibility across EC2, containers, serverless, and managed services cohesively.
Built for scale events
System behavior remains understandable during autoscaling, deployments, and traffic spikes.
Trustworthy production signals
Engineers rely on consistent runtime data instead of conflicting dashboards.
Faster incident alignment
Teams spend less time reconstructing events and more time fixing issues.
Minimal operational overhead
Observability does not add complexity or ongoing maintenance burden.
Supports multi-team ownership
Shared context reduces handoffs between platform, SRE, and application teams.
Unified Observability for Every Engineering Team
Atatus adapts to how engineering teams work across development, operations, and reliability.
Developers
Trace requests, debug errors, and identify performance issues at the code level with clear context.
DevOps
Track deployments, monitor infrastructure impact, and understand how releases affect application stability.
Release Engineer
Measure service health, latency, and error rates to maintain reliability and reduce production risk.
Milestones that spark performance excellence
Reflections from clients who've achieved unmatched excellence through innovative strategies.
Read customer stories


