Application Performance Monitoring
Atatus APM delivers ready-to-use dashboards with real-time metrics, detailed transaction traces, slow database queries, and inefficient network calls. Quickly uncover root causes and resolve issues to enhance application performance and reliability.
Challenges Without Proper APM
Development teams face these critical performance issues daily:
Slow Application Performance
Applications experiencing high latency, slow response times, and poor user experience without clear visibility into the root cause.
"As a developer, I spend hours debugging performance issues because I can't see which part of my code is causing the slowdown."
Blind Spots in Microservices
Difficulty tracing requests across distributed microservices architecture, making it impossible to identify which service is causing bottlenecks.
"As a DevOps engineer, I struggle to troubleshoot issues in our microservices because I can't trace requests end-to-end across all services."
Production Errors Catching You Off Guard
Critical errors happening in production that go unnoticed until customers complain, leading to revenue loss and poor customer experience.
"As a CTO, I hate learning about production issues from angry customers instead of our monitoring system."
No Visibility into Database Performance
Slow database queries causing application bottlenecks, but no insight into which queries are the problem or how to optimize them.
"As a backend developer, I know our database is slow, but I can't identify which queries need optimization without APM."
Complex Deployment Troubleshooting
New deployments causing performance regressions, but lack of before/after comparison makes it hard to pinpoint what changed.
"As a release manager, I need to quickly identify if our latest deployment introduced performance issues before it impacts all users."
Resource Waste and High Cloud Costs
Over-provisioned infrastructure and inefficient code consuming excessive resources, leading to unnecessarily high cloud bills.
"As a FinOps manager, our cloud costs keep growing but we don't have insights into which applications or services are wasting resources."
Built for Developers,
Loved by Teams
Experience enterprise-grade APM without the enterprise complexity. Get started in minutes and scale effortlessly.
Single-Pane Observability
Traces, logs, and metrics - all in one place. Easily jump between signals, identify root causes, and fix issues faster with full context using native OpenTelemetry.
Always-On Insights at any scale
Experience high-speed observability with Atatus, powered by ClickHouse and Quickwit for real-time metrics, fast log indexing, and compressed storage.
Live metrics that catch issues early
Monitor key application metrics like p99 latency, Apdex scores, error rates, and request volumes with built-in charts. Visualize trends by service or endpoint in real time.
How Atatus APM Transforms Your Workflow
Get measurable improvements across DevOps and business metrics
60% Faster Issue Resolution
Distributed tracing and real-time metrics help identify root causes in minutes instead of hours. Jump directly from errors to code-level insights.
Complete Request Visibility
Trace every request across microservices, databases, and external APIs. Visualize service dependencies and identify bottlenecks instantly.
Prevent Revenue Loss
Get alerted to critical errors before they impact customers. Proactive monitoring catches issues in real-time, preventing revenue loss.
Optimize Database Performance
Identify slow queries, N+1 problems, and missing indexes. Get actionable recommendations to improve database efficiency by 10x.
Safe Deployments
Compare performance before and after deployments. Quickly rollback if performance degrades. Deploy with confidence.
Better User Experience
Faster applications mean happier users. Reduce page load times, minimize errors, and deliver seamless digital experiences.
Everything You Need to
Monitor & Optimize
Production-ready observability features that help you ship faster with confidence
Trace‑level Visibility Across Your Stack
See every request from frontend or API to backend services, including timing, errors, and relationships. Quickly pinpoint performance issues and link them to code and user impact.
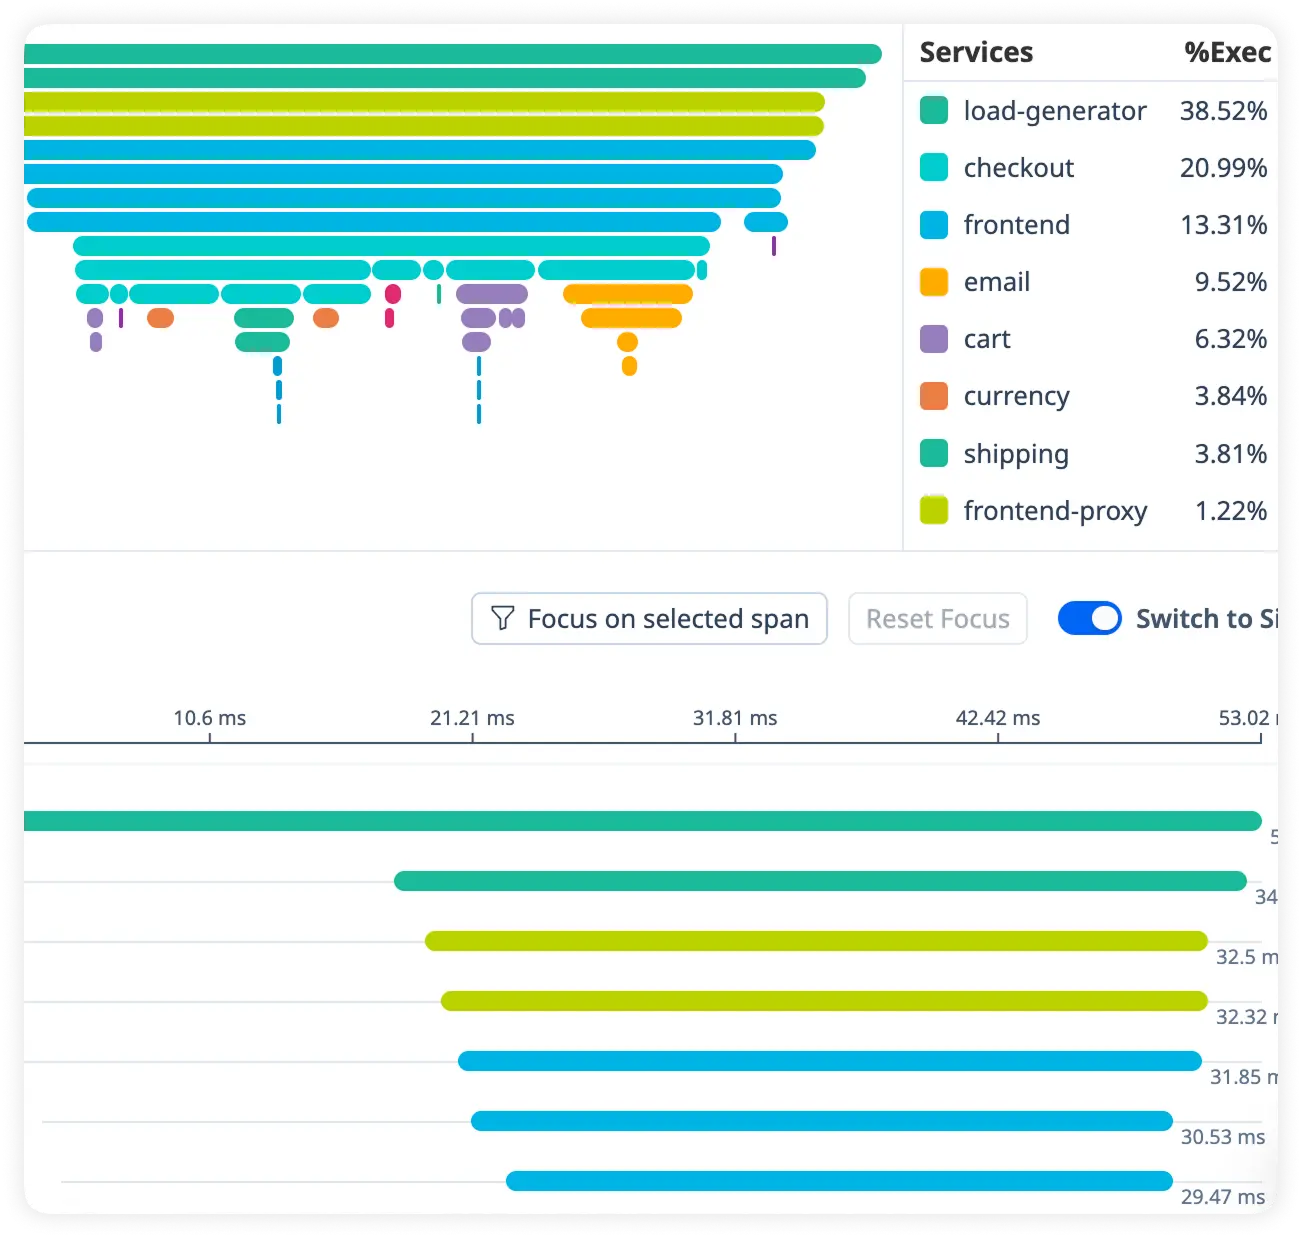
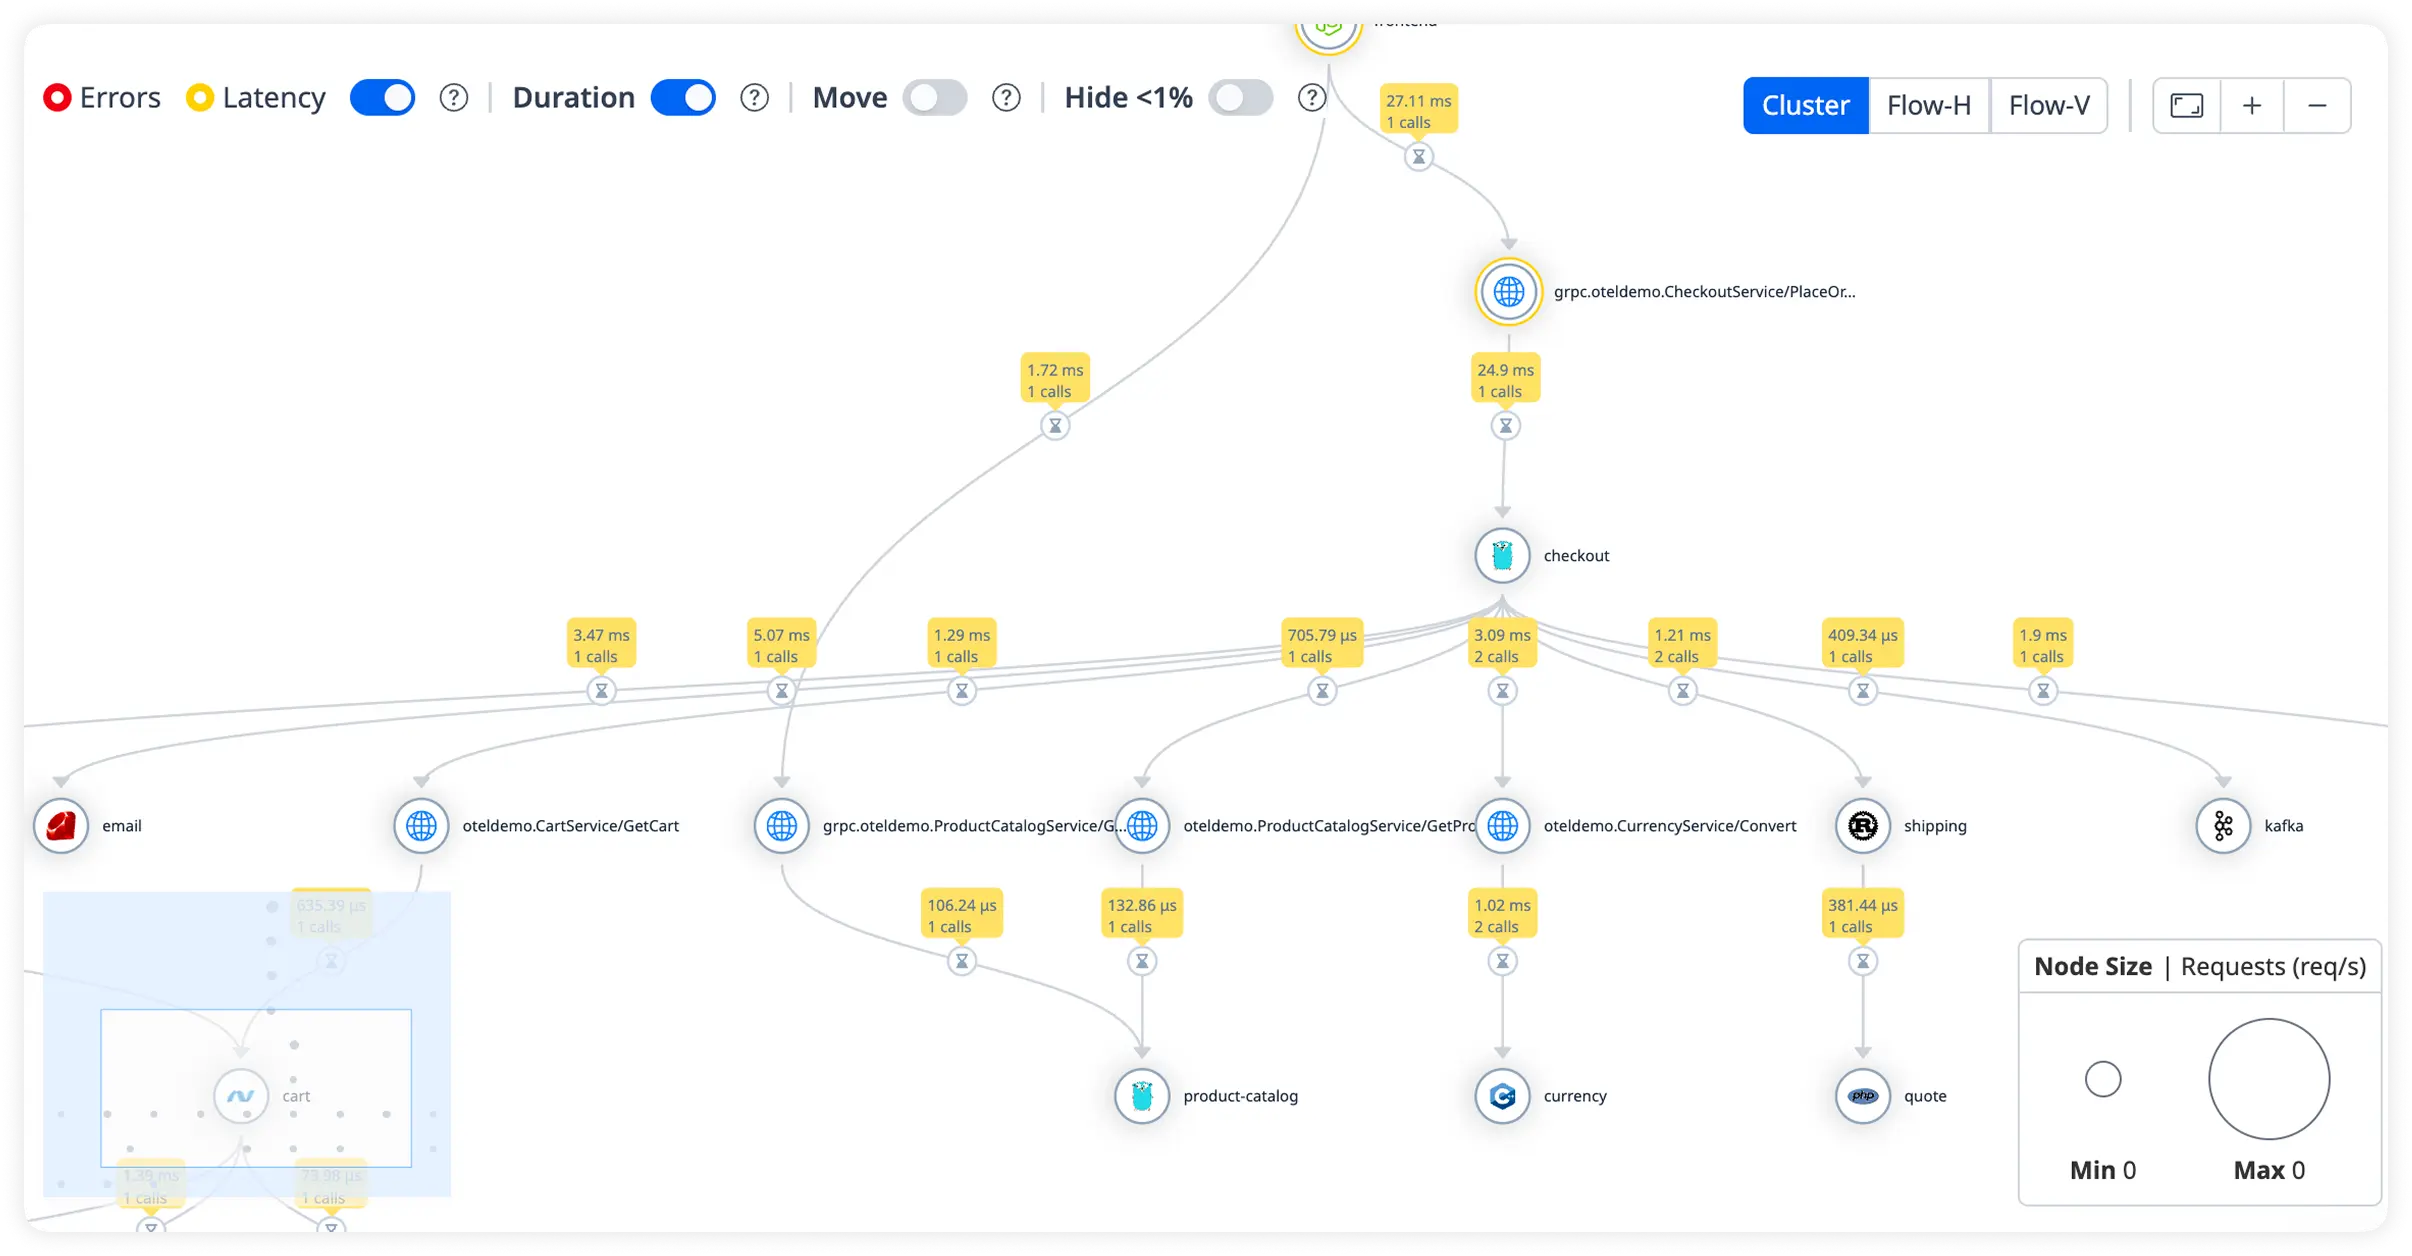
Visualize Service Dependencies
Map service interactions, frequency, and latency to uncover bottlenecks. Overlay health metrics for a clear view of system performance.
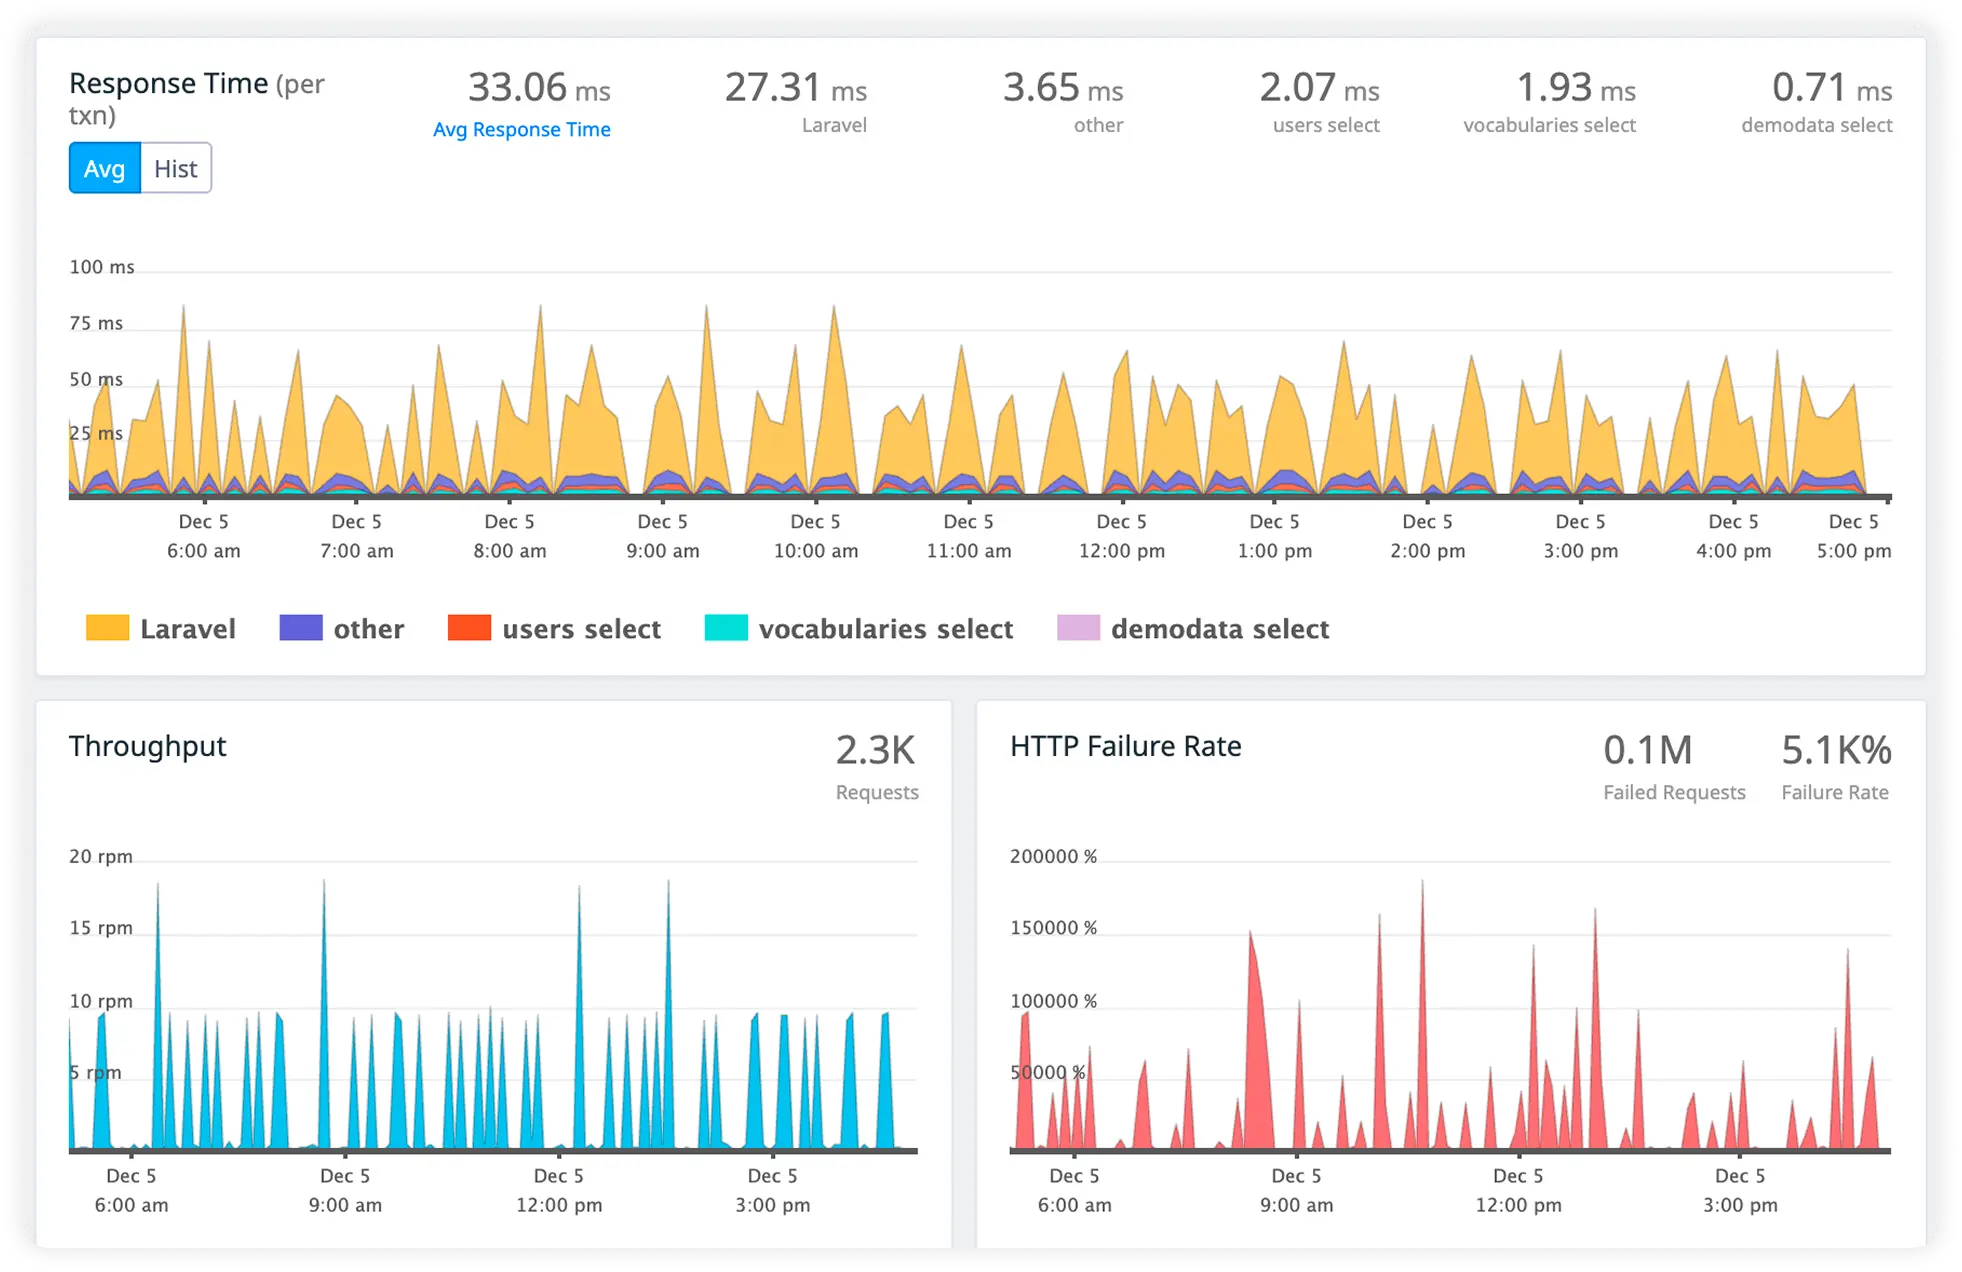
Monitor Critical Transactions
Group requests by endpoints, business flows, or operations to track latency, errors, and throughput. Keep key user journeys and SLAs on track.
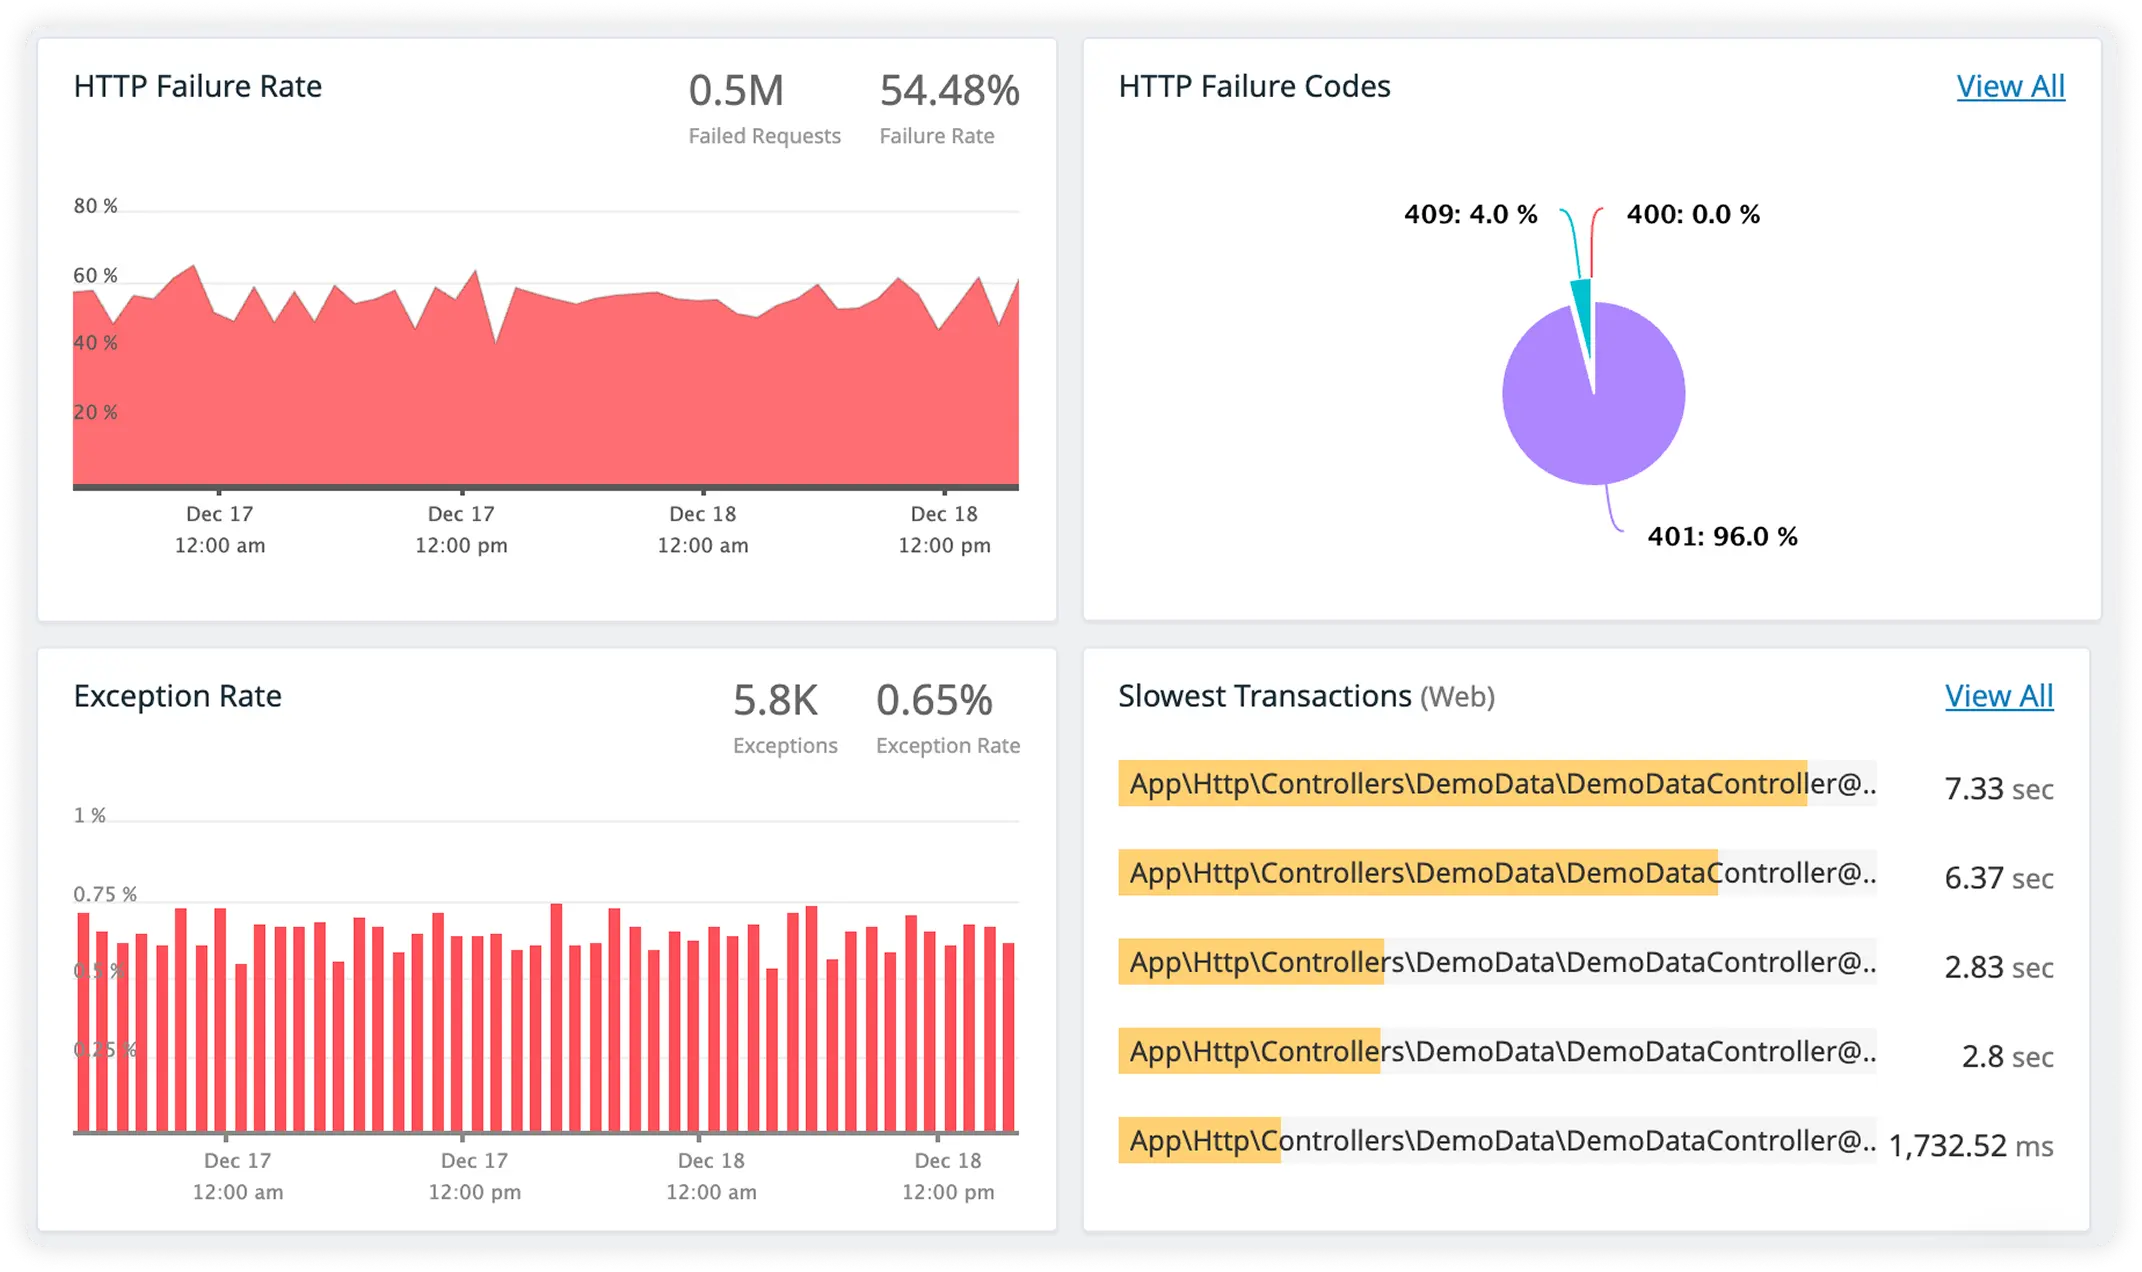
Track External Dependencies
Monitor third-party API calls, latency, and errors to spot external slowdowns and prevent wasted troubleshooting.
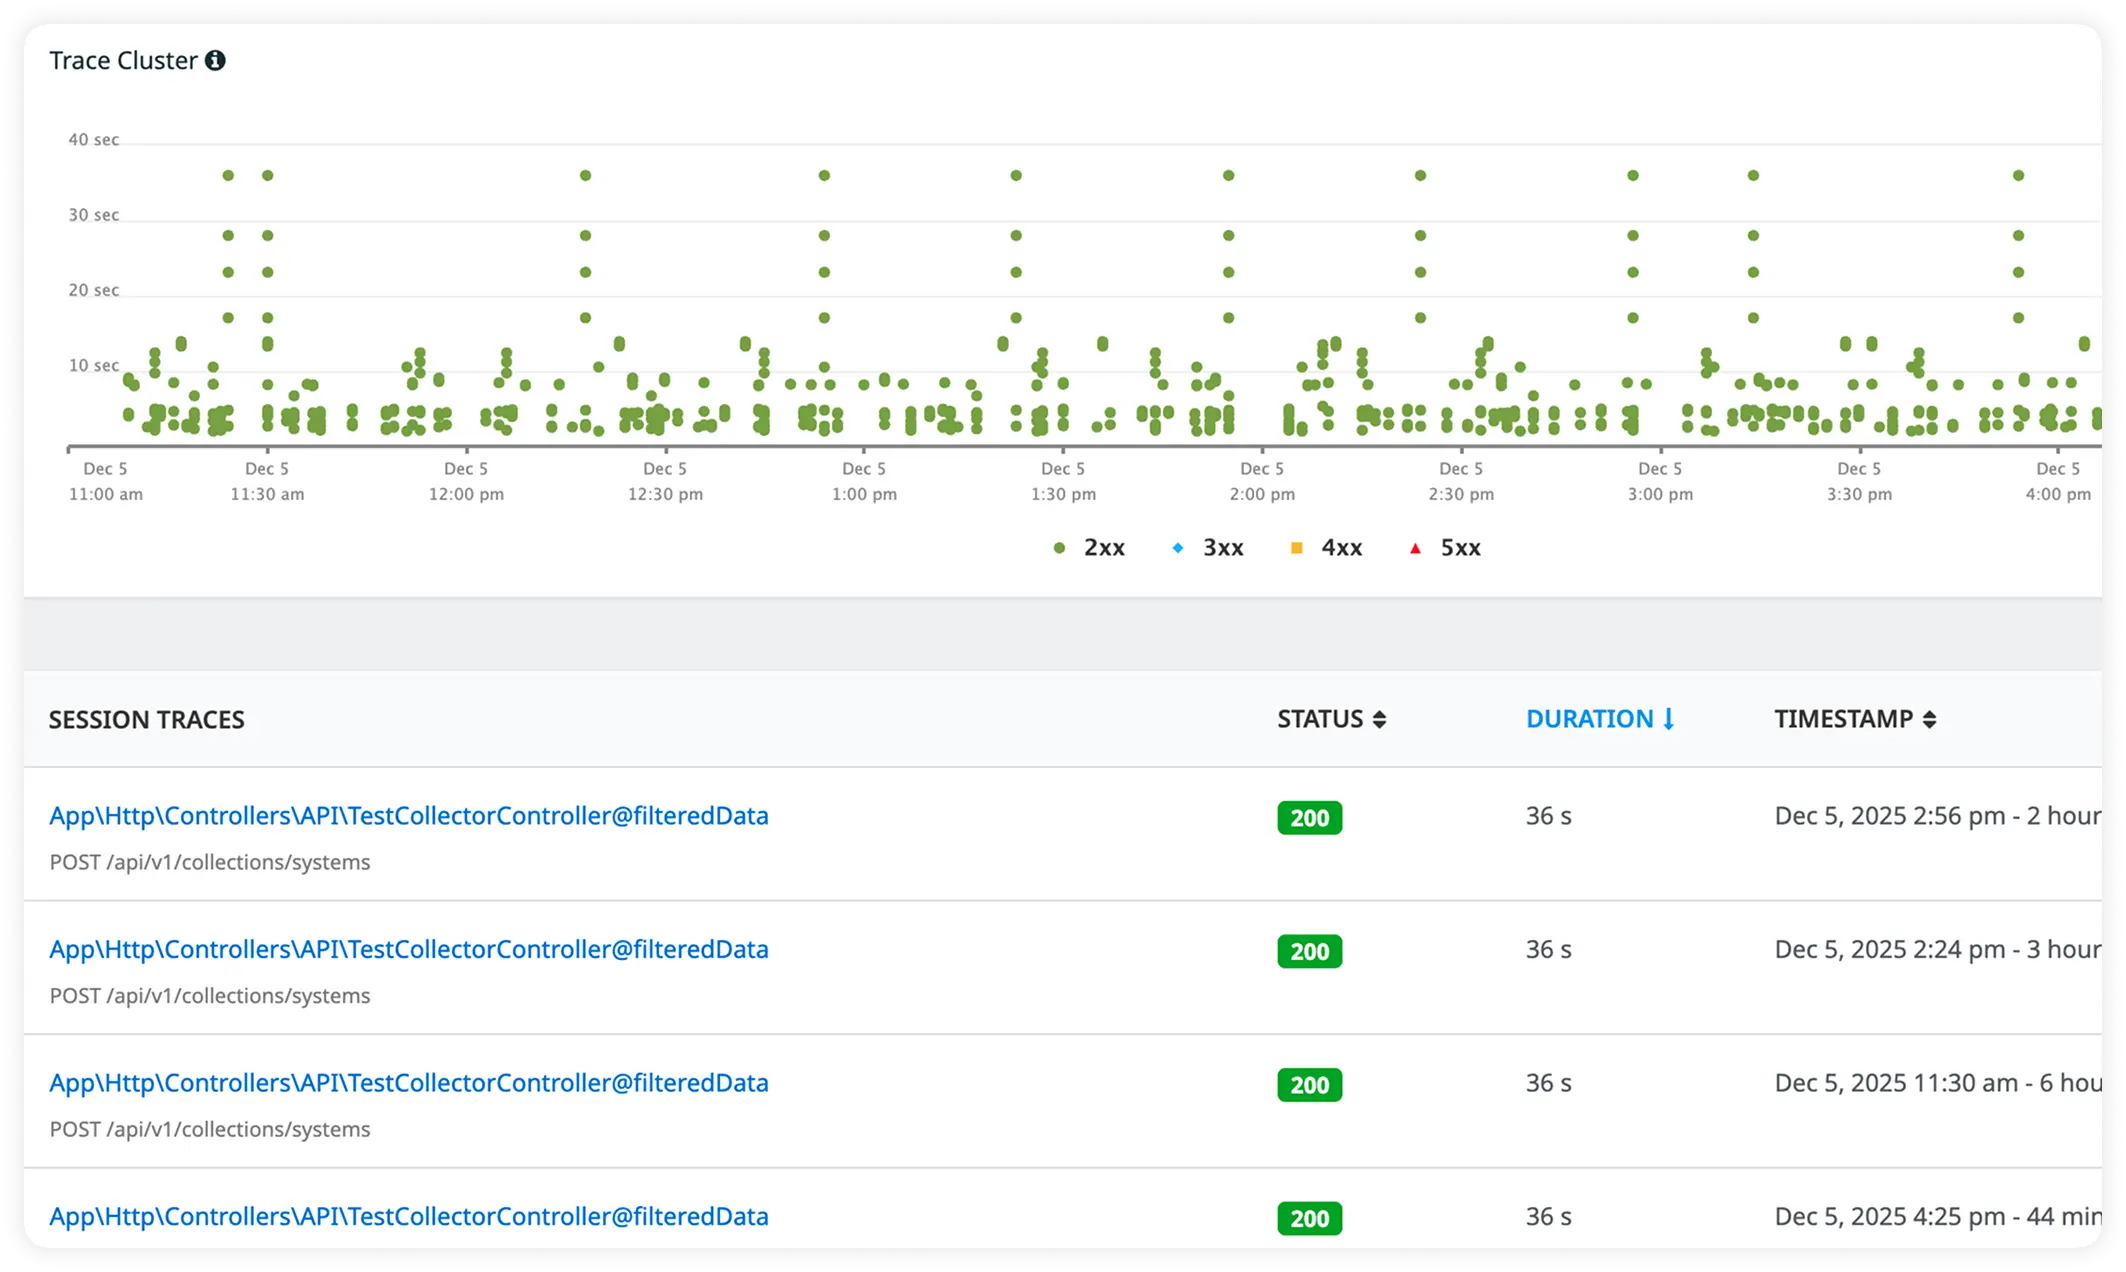
Unified Monitoring for Your Entire Application Stack
Designed to support applications built with popular languages and frameworks, providing unified visibility across the entire application stack.
Start Monitoring in Under 5 Minutes
Three simple steps to complete observability. No credit card required.
Install the Agent
Quickly add the lightweight Atatus APM agent to your application using a simple command. No complex setup or code changes are needed, so you can start monitoring without delay.
Auto-Instrument Your App
Once installed, the agent automatically instruments your app's services and frameworks, capturing detailed performance data like latency, errors, and throughput out of the box.
Monitor, Analyze & Fix Fast
Access real-time dashboards to visualize key metrics and logs. Correlate traces, logs, and errors across your stack to quickly identify and resolve performance bottlenecks and issues.
Milestones that spark performance excellence
Reflections from clients who've achieved unmatched excellence through innovative strategies.
Read customer stories


